
| MANAGEMENT REPORT | |||||||||||
| Annual review | Sustainability statement | Financial statements and additional information | ||||||||||||||||||||||||||||||
4 5 7 8 9 10 11 12 17 26 32 38 41 42 45 | Introducing Novo Nordisk Letter from the Chair and the CEO Key figures Purpose and strategy Value creation Strategic Aspirations 2025 progress Strategic Aspirations Purpose and sustainability Innovation and therapeutic focus Commercial execution Financials Risks Management Board of Directors Executive Management | 47 47 49 50 51 52 54 54 60 64 65 67 69 71 71 80 88 90 90 95 | General information ESG Performance Basis for preparation of the Sustainability statement Sustainability governance Interests and views of stakeholders Double materiality assessment Environment Climate change Resource use and circular economy Pollution Water Biodiversity and ecosystems EU Taxonomy Social Patient protection and quality of life Own workforce Workers in the value chain Governance Business conduct Appendix | 101 102 103 104 105 106 138 138 139 141 143 144 145 146 | Consolidated financial statements Income statement and Statement of comprehensive income Cash flow statement Balance sheet Equity statement Notes to the Consolidated financial statements Statements and auditor’s reports Statement by the Board of Directors and Executive Management Left blank intentionally Left blank intentionally Additional information More information Product overview Financial statements of the parent company | |||||||||||||||||||||||||||
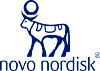 |  | ||||||||||
| A new chapter in our integrated reporting | ||||||||||||||
| The Annual Report 2024 marks a significant step in the evolution of Novo Nordisk’s integrated reporting. This year, our Sustainability statement is for the first time prepared according to the EU Corporate Sustainability Reporting Directive (CSRD) requirements. | ||||||||||||||
 | ||||||||||||||
| We have been committed to integrated reporting since 2004, when we first started evaluating our performance based on social, environmental and financial impact. This commitment was further strengthened in 2019 with the adoption of our Strategic Aspirations 2025, which cover our financial and sustainability ambitions. This year, in line with the CSRD, we have conducted a double materiality assessment to identify the sustainability matters that are most important to Novo Nordisk, considering both societal and financial implications. The essential topics identified include patient protection and quality of life, climate change, resource use and circular economy, and own workforce – reflecting our aspirations of progress towards zero environmental impact, being respected for adding value to society and being a sustainable employer. The outcomes of this assessment have provided us with key metrics to track our performance across our material sustainability topics. You can read more about our progress towards achieving our sustainability ambitions in the Annual review on page 12, while detailed breakdowns of our performance can be found in the Sustainability statement on page 46. Together, these sections make up this year’s Management report. Moreover, our commitment to sustainability is reflected in our incentive programmes, which incorporate our Strategic Aspirations 2025 into both individual and corporate performance targets. This highlights our dedication to driving sustainable growth and creating long-term value for all stakeholders. | ||||||||||||||
| Annual review / Introducing Novo Nordisk / Letter from the Chair and the CEO | | |||||||||
| Building a healthier tomorrow | |||||||||||||||||
| 2024 was a year of significant growth for Novo Nordisk, characterised by continued innovation, capacity expansions and strong commercial execution. As we reflect on our progress, we also recognise the magnitude of the challenges that lie ahead. | |||||||||||||||||
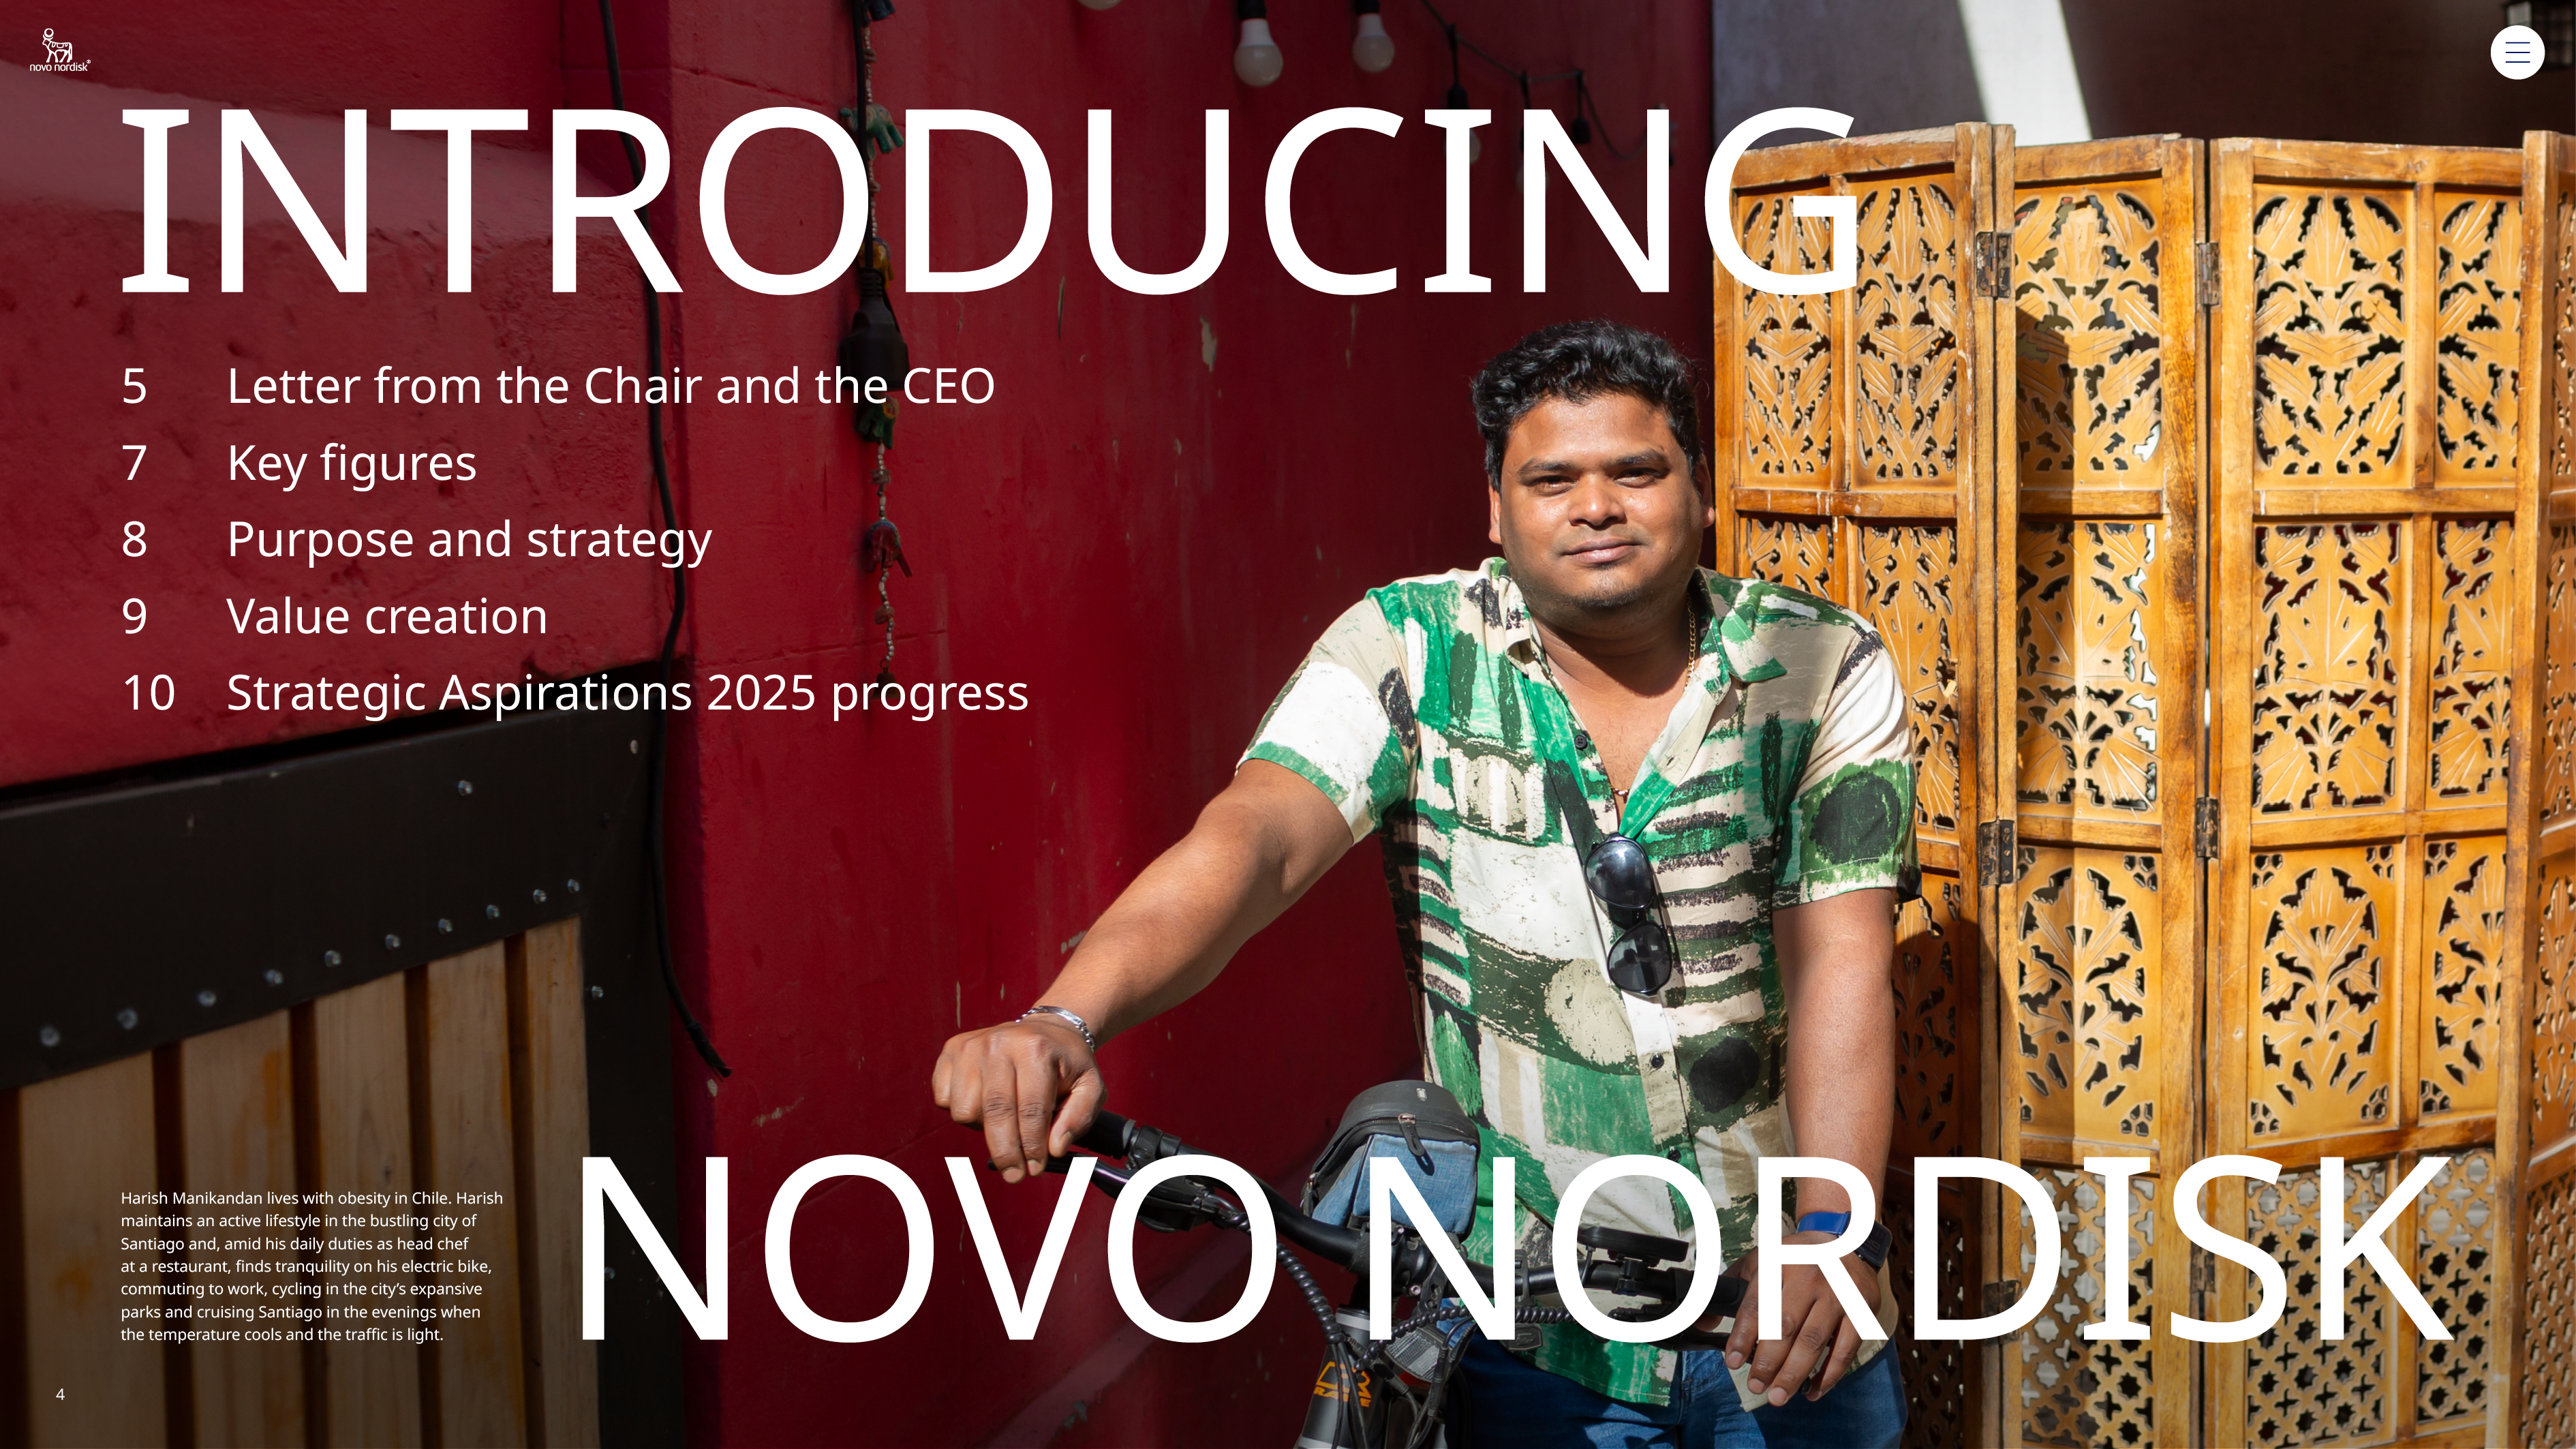
| Chair of the Board of Directors, Helge Lund (left) and President and CEO, Lars Fruergaard Jørgensen (right). | 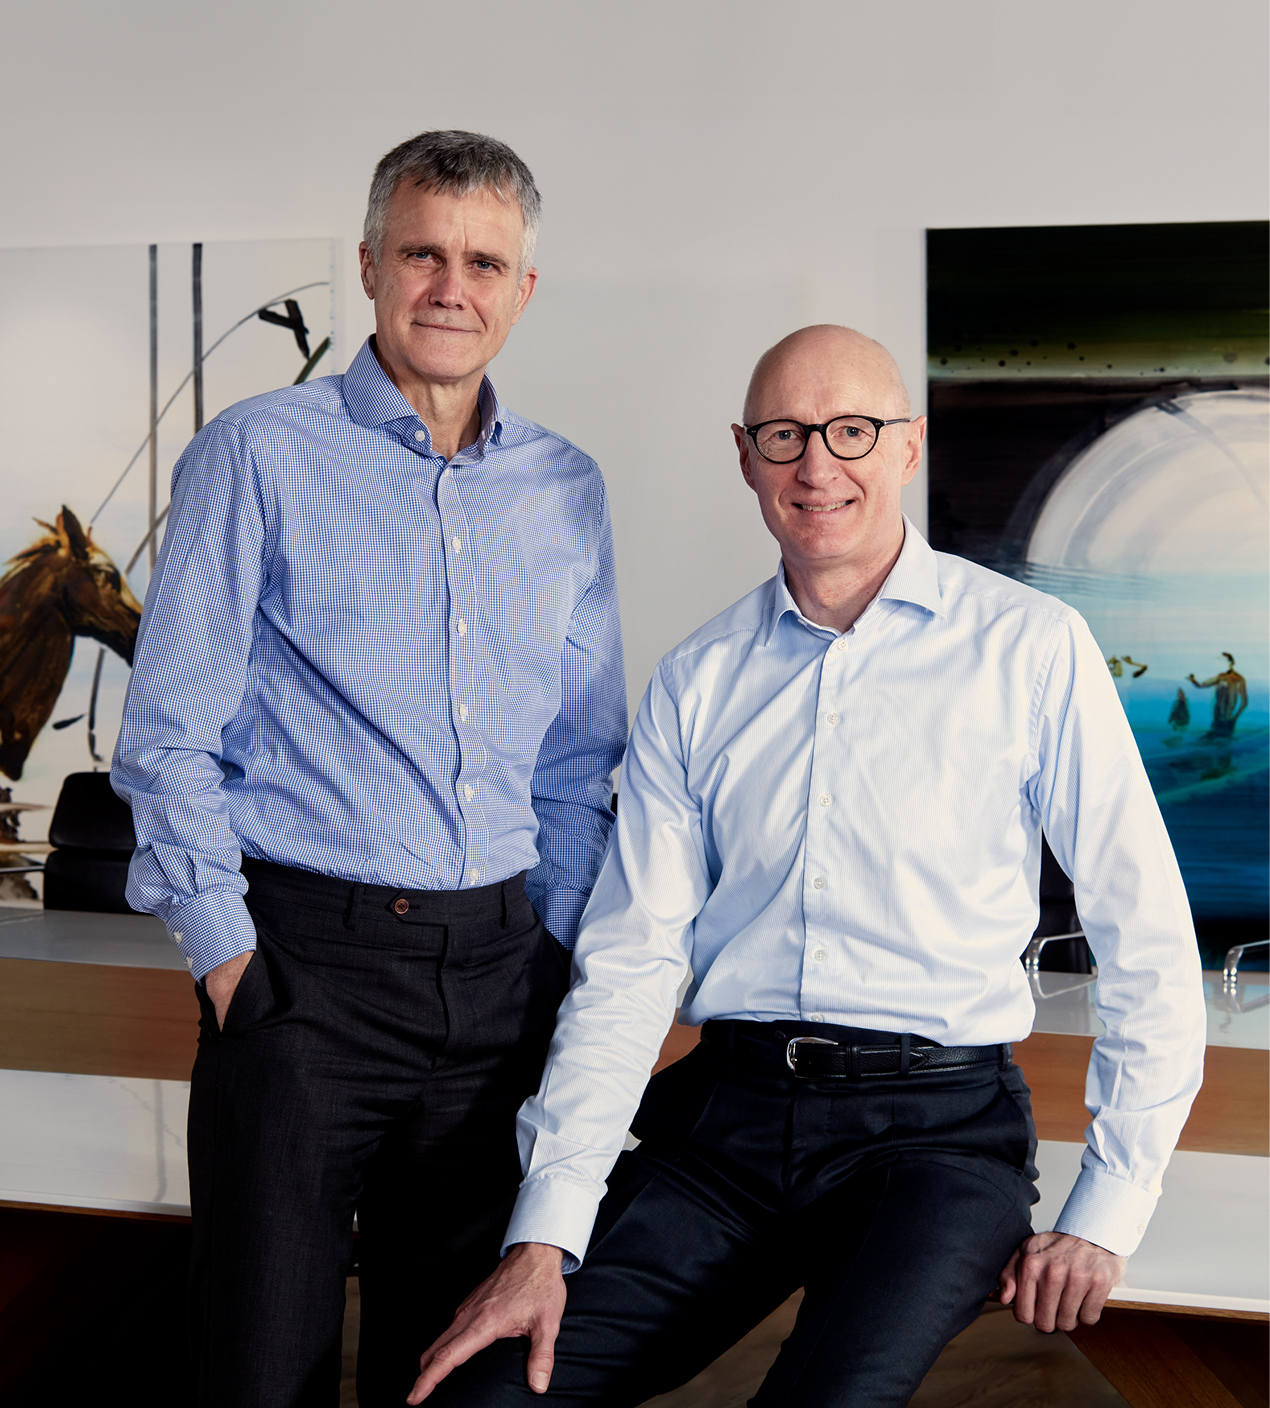 | The global prevalence of serious chronic diseases is growing by the day, impacting millions of lives and placing a heavy burden on overstretched healthcare systems. This has created unprecedented demand for our life-changing GLP-1-based medicines. Over the past four years, we have more than quadrupled the number of people reached with these treatments and increased our volume market share in the GLP-1 segment to 63%. In 2024, we served more than 45.2 million people living with serious chronic diseases, while our global sales and operating profit both grew by 26% at constant exchange rates. As we strive to keep pace with the growing demand for our medicines, our production capacity has been stretched. In response, we have continued to invest heavily in scaling up our manufacturing capabilities with capital expenditure and acquisitions amounting to more than DKK 129 billion in 2024. The acquisition of three fill-finish sites formerly run by contract and development manufacturer Catalent Inc., along with significant expansions of our existing production facilities in Denmark, France, Brazil, China and the US, are testament to our commitment to improving supply stability. In order to meet increasing demand and ensure a stable supply of our medicines, we are also taking steps to consolidate our product portfolio by gradually phasing out some of our older insulin products. This will create much-needed space in our global manufacturing network as we seek to reach millions more people with our medicines over the next decade. At the same time, we strive not to leave existing patients without alternative treatment options, either from Novo Nordisk or other companies, and we remain committed to working closely with local health authorities and the medical community to enable access to affordable care. Our belief that health is a fundamental human right drives our extensive partnership programmes and access initiatives. In times of geopolitical instability, safeguarding access to care for those in conflict zones and underserved areas is paramount. Our partnerships with humanitarian organisations such as the Danish Red Cross play a crucial role in this effort, demonstrating our dedication to making a difference where it is needed most. | |||||||||||||||
| Annual review / Introducing Novo Nordisk / Letter from the Chair and the CEO | | |||||||||
Moreover, we are increasing our investment in preventive health measures through initiatives like Cities for Better Health – a pioneering urban health partnership now active in 51 cities worldwide – and our collaboration with UNICEF to prevent childhood obesity. These efforts aim to address the root causes of serious chronic diseases, thereby reducing the global health burden and fostering a healthier future. Our Transformational Prevention Unit complements our partnership-driven approach, looking to develop scalable, science-based solutions that can predict and pre-empt obesity and its consequences. The same scientific rigour is being applied across our R&D activities, which are driving transformative change across multiple therapy areas. Rooted in our deep understanding of proteins and peptides and fuelled by research partnerships, AI-driven drug discovery and the acquisition of new technology platforms, we are striving to accelerate the discovery of new targets and optimise our clinical trials to the benefit of people living with serious chronic diseases. Innovation remains our core contribution to society and the driving force behind our continued growth. The past year has seen us add to the growing body of clinical evidence supporting the broad cardiometabolic and societal benefits of semaglutide – the molecule at the heart of our flagship GLP-1-based medicines Ozempic®, Wegovy® and Rybelsus® – and we are confident that our pipeline has the potential to add even more value. In obesity, we completed the first phase 3 trial of CagriSema, currently in development for the treatment of obesity or overweight and type 2 diabetes. After 68 weeks, if all people adhered to treatment, CagriSema demonstrated a statistically significant weight loss of 22.7% vs 2.3% with placebo alone. This is among the highest weight reductions yet seen in a phase 3a programme for a GLP-1 combination therapy. We intend to further explore the weight loss potential of CagriSema in an additional study. Earlier in our obesity pipeline, topline results from a phase 1b/2a trial of subcutaneous amycretin have demonstrated the weight lowering potential of the unimolecular GLP-1 and amylin receptor agonist, supporting previous data seen with the oral formulation. When evaluating the effects of treatment if all people adhered to treatment, those receiving a 20 mg dose of amycretin experienced an estimated average weight loss of 22.0% over 36 weeks compared to 2% weight gain with placebo. In diabetes, the first launches of Awiqli® – the world’s first once-weekly basal insulin – exemplify our enduring commitment to innovation in this space more than 100 years after we first started producing insulin. Moreover, our dedication to addressing unmet needs within rare disease is exemplified by the pending regulatory submission of Mim8 for the treatment of haemophilia A. The growth of our business has inevitably led to an increase in our environmental footprint, and we are stepping up efforts to mitigate this impact. We have introduced comprehensive, updated roadmaps targeting reductions in our emissions, plastic footprint and impact on nature and | biodiversity. Achieving these ambitions will be no small feat given the increasing global demand for our medicines, but we are rising to the challenge. Our roadmaps include measures to decouple our environmental impact from our continued growth by incorporating the use of low-carbon materials across our value chain, supporting our suppliers through a transition to renewable energy and facilitating a switch from disposable to reusable injection devices for our medicines wherever possible. Our operating environment is also becoming more complex, shaped by geopolitical tensions, global conflicts and technological advancements. Our unique ownership structure, underpinned by the Novo Nordisk Foundation as controlling shareholder, provides us with the stability we need to navigate these uncertainties. This model supports our sustainable growth by allowing us to take a long-term view on our investments and strategies; crucial in a volatile world where short-term market pressures can often lead to reactive decision-making. We are similarly mindful of the importance of sustainably scaling our organisation. We are now 77,349 colleagues worldwide – an increase of 20% compared to 2023 that reflects our commitment to scaling up in the face of growing demand. Our focus is on ensuring new hires receive the support and resources they need to fully integrate into our global workforce and connect with the Novo Nordisk Way – the core guiding principles that underpin everything we do. This approach also safeguards our focus on diversity and inclusion, fostering an environment where every employee feels valued and included. As we look forward to 2025 and beyond, we are optimistic about the opportunities that lie ahead as we strive to serve millions more people with serious chronic diseases. However, we are also mindful of the challenges inherent to our growth and the need to balance short-term costs with long-term societal value. Our purpose remains clear: driving change to defeat serious chronic diseases. By staying true to our purpose and values, we are confident in our ability to navigate the complexities of the ever-evolving global healthcare landscape and to continue making a meaningful difference in the lives of millions of people worldwide. We would like to extend our gratitude to all Novo Nordisk colleagues worldwide for their hard work and dedication at a time of unprecedented demand for our life-changing medicines, and to our shareholders for their continued support of our company.  Helge Lund Lars Fruergaard Jørgensen Chair of the Board of Directors President and CEO | |||||||||||||
| Annual review / Introducing Novo Nordisk / Key figures | | |||||||||
45.2 million people living with diabetes and obesity reached | ||||||||
5 countries with R&D facilities | 13 countries with production facilities | 80 countries with affiliates | ||||||
77,349 employees worldwide | ||||||||
| DKK million | 2020 | 2021 | 2022 | 2023 | 2024 | 2023-24 | |||||||||||||||||
| Financial performance | Change | ||||||||||||||||||||||
| Net sales | 126,946 | 140,800 | 176,954 | 232,261 | 290,403 | 25 | % | ||||||||||||||||
| Sales growth as reported | 4.0 | % | 10.9 | % | 25.7 | % | 31.3 | % | 25.0 | % | |||||||||||||
Sales growth in constant exchange rates1 | 6.7 | % | 13.8 | % | 16.4 | % | 35.6 | % | 25.7 | % | |||||||||||||
| Operating profit | 54,126 | 58,644 | 74,809 | 102,574 | 128,339 | 25 | % | ||||||||||||||||
| Operating profit growth as reported | 3.1 | % | 8.3 | % | 27.6 | % | 37.1 | % | 25.1 | % | |||||||||||||
Operating profit growth in constant exchange rates1 | 6.8 | % | 12.7 | % | 14.6 | % | 43.7 | % | 26.2 | % | |||||||||||||
| Depreciation, amortisation and impairment losses | 5,753 | 6,025 | 7,362 | 9,413 | 19,107 | 103 | % | ||||||||||||||||
EBITDA1,2 | 59,879 | 64,669 | 82,171 | 111,987 | 147,446 | 32 | % | ||||||||||||||||
| EBITDA growth as reported | 3.0 | % | 8.0 | % | 27.1 | % | 36.3 | % | 31.7 | % | |||||||||||||
| EBITDA growth in constant exchange rates | 6.7 | % | 12.0 | % | 14.9 | % | 42.4 | % | 32.7 | % | |||||||||||||
| Net financials | (996) | 436 | (5,747) | 2,100 | (1,148) | ||||||||||||||||||
| Profit before income taxes | 53,130 | 59,080 | 69,062 | 104,674 | 127,191 | 22 | % | ||||||||||||||||
Effective tax rate3 | 20.7 | % | 19.2 | % | 19.6 | % | 20.1 | % | 20.6 | % | |||||||||||||
| Net profit | 42,138 | 47,757 | 55,525 | 83,683 | 100,988 | 21 | % | ||||||||||||||||
Purchase of property, plant and equipment3 | 5,825 | 6,335 | 12,146 | 25,806 | 47,164 | 83 | % | ||||||||||||||||
Purchase of intangible assets3 | 16,256 | 1,050 | 2,607 | 13,090 | 4,145 | (68 | %) | ||||||||||||||||
| Cash used for acquisition of businesses | — | 18,283 | 7,075 | — | 82,163 | ||||||||||||||||||
Free cash flow1 | 28,565 | 29,319 | 57,362 | 68,326 | (14,707) | ||||||||||||||||||
| Total assets | 144,922 | 194,508 | 241,257 | 314,486 | 465,795 | 48 | % | ||||||||||||||||
| Equity | 63,325 | 70,746 | 83,486 | 106,561 | 143,486 | 35 | % | ||||||||||||||||
| DKK million | 2020 | 2021 | 2022 | 2023 | 2024 | 2023-24 | |||||||||||||||||
| Financial ratios | Change | ||||||||||||||||||||||
Gross margin3 | 83.5 | % | 83.2 | % | 83.9 | % | 84.6 | % | 84.7 | % | |||||||||||||
| Sales and distribution costs in percentage of sales | 25.9 | % | 26.3 | % | 26.1 | % | 24.4 | % | 21.4 | % | |||||||||||||
| Research and development costs in percentage of sales | 12.2 | % | 12.6 | % | 13.6 | % | 14.0 | % | 16.6 | % | |||||||||||||
Operating margin3 | 42.6 | % | 41.7 | % | 42.3 | % | 44.2 | % | 44.2 | % | |||||||||||||
Net profit margin3 | 33.2 | % | 33.9 | % | 31.4 | % | 36.0 | % | 34.8 | % | |||||||||||||
Cash to earnings1 | 67.8 | % | 61.4 | % | 103.3 | % | 81.6 | % | (14.6 | %) | |||||||||||||
Return on invested capital1 | 82.8 | % | 69.0 | % | 73.6 | % | 88.5 | % | 63.9 | % | |||||||||||||
| Share performance and capital allocation | |||||||||||||||||||||||
Basic earnings per share/ADR in DKK3 | 9.03 | 10.40 | 12.26 | 18.67 | 22.67 | 21 | % | ||||||||||||||||
Diluted earnings per share/ADR in DKK3 | 9.01 | 10.37 | 12.22 | 18.62 | 22.63 | 22 | % | ||||||||||||||||
| Total number of shares (million), end of year | 4,700 | 4,620 | 4,560 | 4,510 | 4,465 | (1 | %) | ||||||||||||||||
Dividend per share in DKK4 | 4.55 | 5.20 | 6.20 | 9.40 | 11.40 | 21 | % | ||||||||||||||||
Total dividend (DKK million)4 | 21,066 | 23,711 | 27,950 | 41,987 | 50,683 | 21 | % | ||||||||||||||||
Dividend payout ratio3 | 50.0 | % | 49.6 | % | 50.3 | % | 50.2 | % | 50.2 | % | |||||||||||||
| Share repurchases (DKK million) | 16,855 | 19,447 | 24,086 | 29,924 | 20,181 | (33 | %) | ||||||||||||||||
| Closing share price (DKK) | 214 | 368 | 469 | 698 | 624 | (11 | %) | ||||||||||||||||
| Annual review / Introducing Novo Nordisk / Purpose and strategy | | |||||||||
| Purpose and strategy | ||||||||||||||||||||
| At Novo Nordisk, our purpose is clear: driving change to defeat serious chronic diseases. Through our life-changing innovations, we are building a healthier future for generations to come. | ||||||||||||||||||||
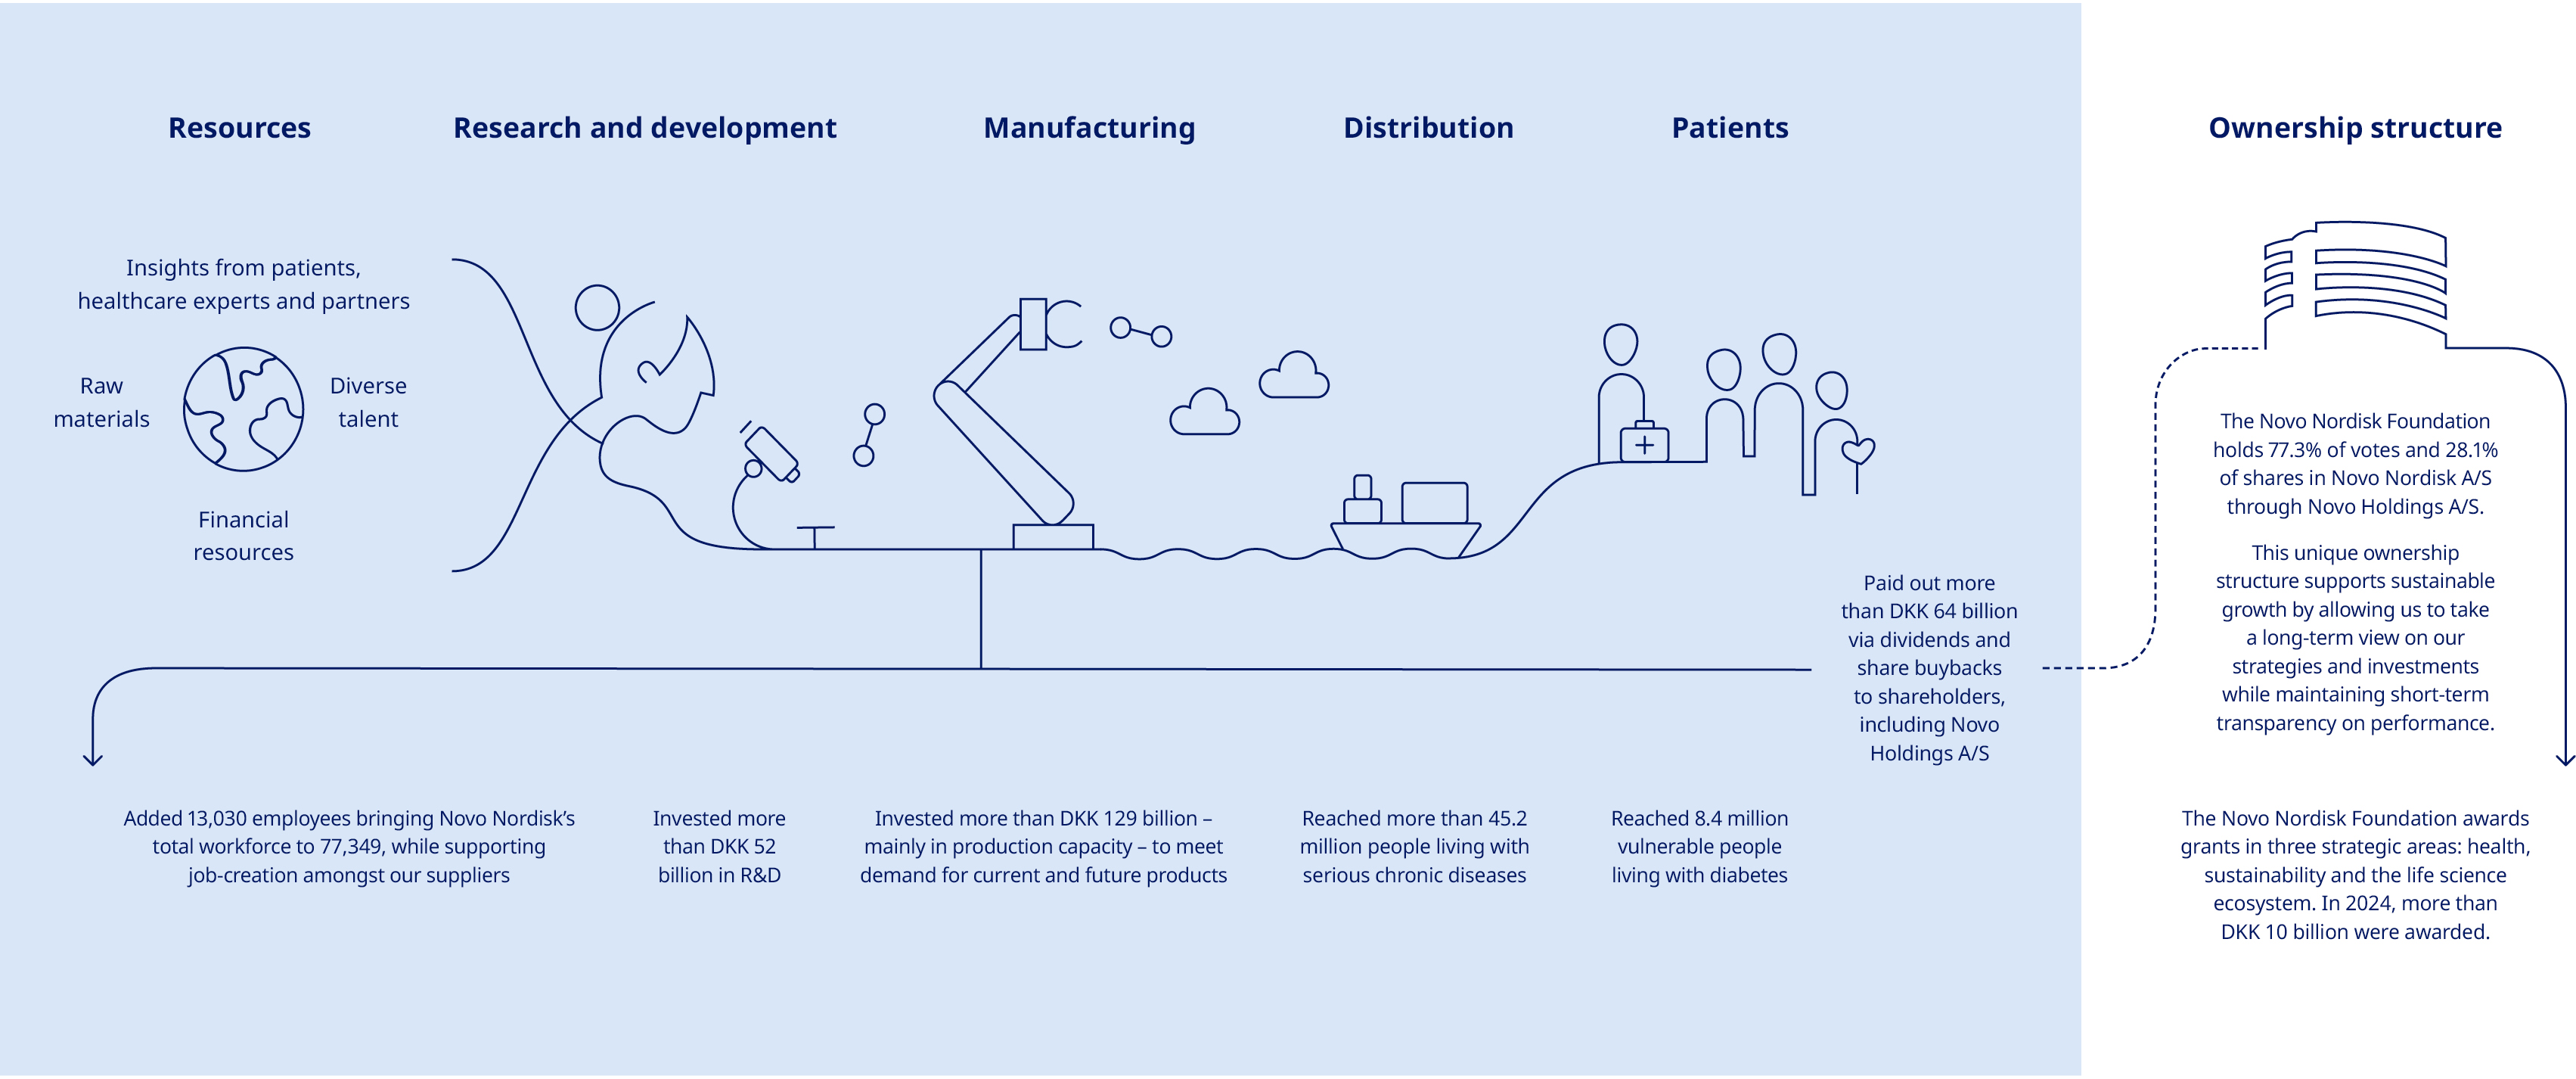
We are dedicated to reinforcing our leadership in diabetes and obesity, securing a leading position in rare diseases and establishing ourselves as a key player in cardiovascular disease. Additionally, we are actively building our presence in the treatment of metabolic dysfunction-associated steatohepatitis, chronic kidney disease and Alzheimer’s disease. We create value on multiple fronts. Through the Novo Nordisk Way, we ensure our employees thrive in a supportive and innovative environment. We operate as a responsible business, striving to address environmental and social impacts, to create value for society and fulfil our financial commitments to shareholders, ensuring sustainable growth and success. Our value chain is similarly comprehensive, encompassing every stage from the initial concept of a new treatment to its final delivery to people living with serious chronic diseases. This includes our own operations in R&D and manufacturing, as well as collaborations with suppliers to source materials and distribute our treatments effectively. |  | |||||||||||||||||||
| Annual review / Introducing Novo Nordisk / Value creation | | |||||||||
| Annual review / Introducing Novo Nordisk / Strategic Aspirations 2025 progress | | |||||||||
| Strategic Aspirations 2025 progress | ||||||||||||||||||||
| Strategic Aspirations 2025 | Progress | |||||||||||||||||||
| Purpose and sustainability | Progress towards zero environmental impact | •Overall CO2e emissions (scope 1, 2 and full scope 3) increased by 23% compared to 2023 | ||||||||||||||||||
| Being respected for adding value to society | •Medical treatment provided to 43.0 million people living with diabetes and 2.2 million people living with obesity •Reached more than 64,000 children in the Changing Diabetes® in Children programme | |||||||||||||||||||
| Being recognised as a sustainable employer | •Share of women in senior leadership positions has increased by 0.7 percentage point to 42% compared to 2023 | |||||||||||||||||||
| Sustainable supply chain | •Acquisition of Catalent by Novo Holdings and the related acquisition by Novo Nordisk of three manufacturing sites from Novo Holdings completed | |||||||||||||||||||
| Innovation and therapeutic focus | Further raise the innovation-bar for Diabetes treatment | •Awiqli® approved in the EU, Japan and China •Complete Response Letter received for insulin icodec in the US •Successful completion of phase 3a programme with IcoSema •US approval and positive EU opinion for an update of the Ozempic® label based on the FLOW kidney trial •Submission of the SOUL cardiovascular outcomes trial and STRIDE functional outcomes trial in the US and EU | ||||||||||||||||||
| Develop a leading portfolio of superior treatment solutions for Obesity | •Phase 2 trial initiated with once-weekly GIP/GLP-1 dual agonist •Phase 2a trial with monlunabant completed •CagriSema demonstrated superior weight loss in the REDEFINE 1 trial •Phase 3b trials, STEP UP and STEP UP T2D, with semaglutide 7.2 mg successfully completed •Phase 1b/2a trial with injectable amycretin successfully completed •Phase 1 trial with a tri-agonist (Triple) initiated | |||||||||||||||||||
| Strengthen and progress the Rare disease pipeline | •Phase 3a trial, FRONTIER 2, with Mim8 successfully completed in people with haemophilia A •Successful completion of the phase 2 part (interim) of the etavopivat HIBISCUS phase 2/3 trial •Alhemo® (Concizumab) approved in the US and EU for the treatment of haemophilia A and B with inhibitors •Alhemo® submitted in the EU for the treatment of haemophilia A and B without inhibitors | |||||||||||||||||||
| Establish presence in Cardiovascular & Emerging Therapy Areas focusing on CVD, MASH and CKD | •Agreement to acquire Cardior Pharmaceuticals and lead asset CDR132L in phase 2 development for treatment of heart failure •Phase 3 development initiated with ziltivekimab in HFpEF and AMI •Phase 3 trial CLARION-CKD trial stopped as ocedurenone failed to meet primary endpoint •Successful completion of part I of phase 3 trial ESSENCE with semaglutide 2.4 mg in MASH | |||||||||||||||||||
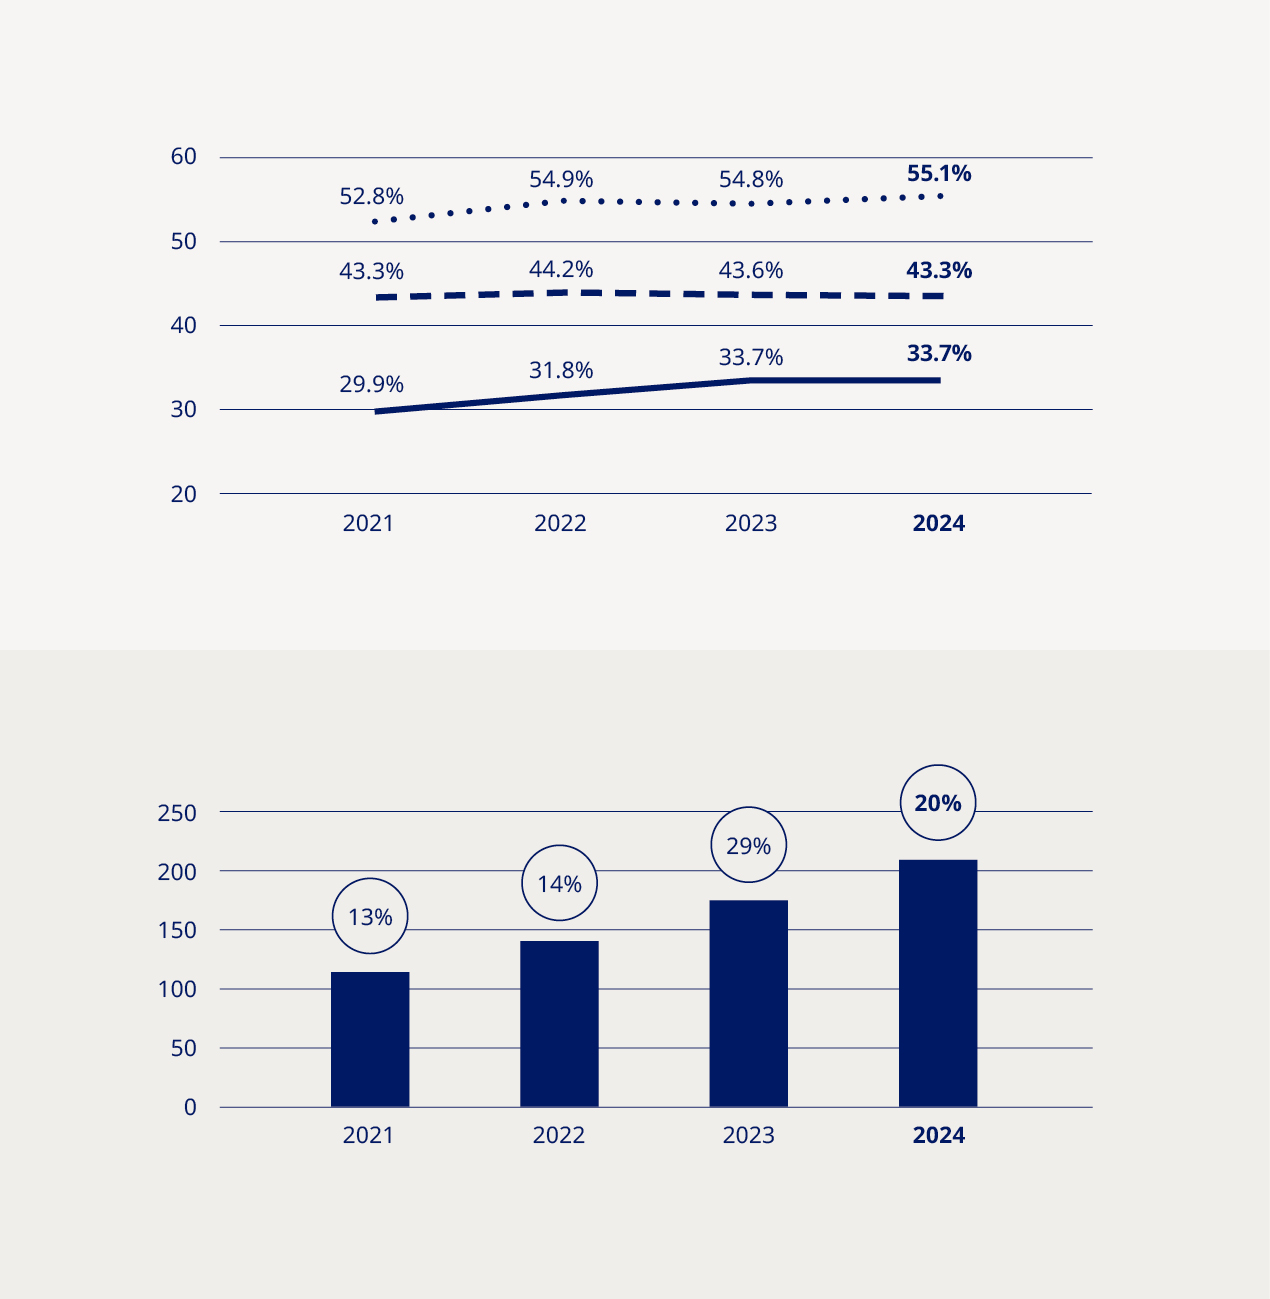
| Commercial execution | Strengthen Diabetes leadership – aim at global value market share of more than 1/3 | •Diabetes value market share remained unchanged at 33.7% (MAT) | ||||||||||||||||||
| More than DKK 25 billion in Obesity sales by 2025 | •Obesity care sales increased by 57% (CER) to DKK 65.1 billion | |||||||||||||||||||
| Secure a sustained growth outlook for Rare disease | •Rare disease sales increased by 9% (CER) to DKK 18.6 billion | |||||||||||||||||||
| Financials | Deliver solid sales and operating profit growth | •Sales growth of 26% (CER) •Operating profit growth of 26% (CER), negatively impacted by impairment losses related to intangible assets | ||||||||||||||||||
| Drive operational efficiencies across the value chain to enable investments in future growth assets | •Operational leverage reflecting sales growth, when excluding impairment losses | |||||||||||||||||||
| Deliver free cash flow to enable attractive capital allocation to shareholders | •Free cash flow of DKK (14.7) billion, negatively impacted by the Catalent transaction •DKK 64.3 billion returned to shareholders | |||||||||||||||||||

| Annual review / Introducing Novo Nordisk / Purpose and sustainability | | |||||||||
PURPOSE AND SUSTAINABILITY Driving change in human and planetary health | As the global prevalence of serious chronic diseases continues to increase, overburdened healthcare systems face growing pressure to deliver cost-effective, quality care, while millions of people lack access to essential treatments. In 2024, we reached more than 45.2 million people with our life-changing medicines – an increase of 3.6 million compared to 2023. As our business grows, so does our social responsibility to support vulnerable populations, and this year we were able to reach 8.4 million vulnerable people living with diabetes – a slight decrease compared to 2023. With the aim of addressing growing health inequities, we are broadening our access and affordability initiatives, including programmes like Changing Diabetes® in Children. Since its inception in 2009, this programme has provided care and support to more than 64,000 young people – keeping us on track to achieve our ambition of reaching a total of 100,000 children by 2030. Prevention is similarly critical to reducing the global health burden, and we are investing more in preventive health measures than ever before. Our GLP-1-based medicines hold the potential to deliver substantial long-term healthcare savings by improving patient outcomes and reducing the need for more intensive treatments. Meanwhile, the 2024 expansion of our pioneering urban health initiative, Cities for Better Health, showcases our growing ambition to drive change outside the clinic. Building upon a decade of insights, this expanded partnership programme now includes a Childhood Obesity Prevention Initiative (COPI) aiming to deliver measurable, community-driven interventions that promote healthy eating and physical activity among children living in underprivileged urban communities. Initially launching in six cities across five continents, COPI complements our existing work with UNICEF to prevent this escalating problem. We also prioritise environmental sustainability – including nature and biodiversity – across our value chain and have a clear focus on decoupling our environmental impact from our growth as we progress towards our net zero 2045 emissions target. This will be a significant challenge with emissions continuing to rise as our business expands to keep pace with demand, but we are determined to step up to the task. To this end, we have updated roadmaps targeting reductions in our emissions, plastic footprint and impact on nature and biodiversity, each laying out a clear path towards creating a more sustainable business. Key focus areas include supporting our suppliers through a transition to renewable energy, switching to reusable injection devices for our medicines wherever possible and exploring the use of low-impact glucose alternatives in our production processes. Despite the scale of the challenges ahead, our commitment to improving human and planetary health remains unwavering. We are determined to do more with less – reaching more vulnerable people with our life-saving medicines and doing more to curb the rising prevalence of serious chronic diseases, all while minimising our environmental impact. | ||||||||||||||||||||||
In an increasingly complex and unpredictable world, the intersection of climate change, health inequity and the rising prevalence of serious chronic diseases presents an unprecedented risk to both human and planetary health. Recognising the magnitude of these challenges, we are aiming to expand the reach and societal impact of our life-changing medicines and preventive health initiatives while striving to reduce our CO2e emissions, plastic footprint and impact on nature. | |||||||||||||||||||||||
| Strategic Aspirations 2025 |  | ||||||||||||||||||||||
   | Progress towards zero environmental impact Being respected for adding value to society Being recognised as a sustainable employer | ||||||||||||||||||||||
| Annual review / Introducing Novo Nordisk / Purpose and sustainability | | |||||||||
 | | ||||||||||||||||||||||||||||
| Driving change in chronic disease prevention | Tackling growing health disparities | ||||||||||||||||||||||||||||
We are taking determined action to prevent serious chronic diseases, focusing on improving urban health for vulnerable communities and preventing childhood overweight and obesity. These efforts are complemented by our Transformational Prevention Unit, which aims to develop scalable and accessible science-based solutions that can predict and pre-empt obesity and its consequences. Our pioneering urban health programme, Cities for Better Health (CBH), sits at the forefront of our prevention efforts. Now with a broadened scope that aligns with our expansion into new therapy areas, this public-private partnership drives action to prevent serious chronic diseases across a global network of 51 large cities. The Childhood Obesity Prevention Initiative (COPI) is the latest initiative to come out of CBH. Taking aim at childhood overweight and obesity, it seeks to deliver measurable, community-driven interventions promoting healthy eating and physical activity among children living in underprivileged urban communities. Guided by a global evidence-based framework, these measures will target children aged between six and 13, aiming to positively affect diet and physical activity, improve health-related quality of life and promote healthy weight. The initiative complements our ongoing collaboration with UNICEF to tackle childhood obesity, where we are focusing on building healthy environments that enable and empower children to eat well and be active. | 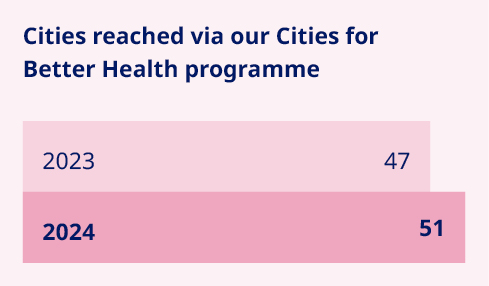 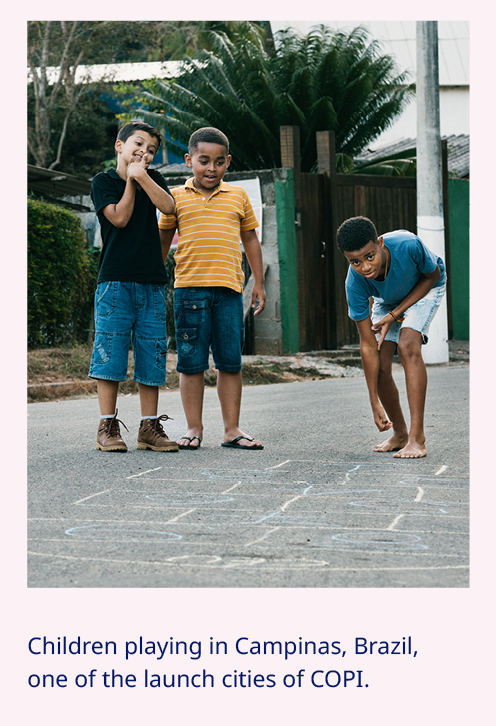 | Millions currently lack access to diabetes care due to high costs or unavailability, often with devastating consequences. In 2024, we reached 8.4 million vulnerable people with diabetes, a 5% decrease from last year, mainly due to reduced tender sales of human insulins. Despite this, our commitment to addressing health inequity remains unwavering. We are intensifying efforts to make care more affordable for vulnerable populations, improve supply chains and build capacity for diagnosis and disease management. Key initiatives include Changing Diabetes® in Children (CDiC), which has reached over 64,000 children with type 1 diabetes in low- and middle-income countries since 2009. Support can include free life-saving medicine, blood glucose monitoring equipment and medical supplies for young people under 25. In the past year, the programme integrated new digital elements to support access to care in vulnerable settings. This includes the ‘Diabetes Besties’ video series, which helps bridge the gap in patient education for children living with diabetes. Other initiatives include Partnering for Change, a collaboration with the Danish Red Cross to address health issues in humanitarian crises, and iCARE, an integrated business model aimed at breaking down barriers to diabetes care in Middle Africa and Indonesia. iCARE provides affordable insulin, trains healthcare providers and empowers people with diabetes to improve their health and quality of life. 1. The 2023 figure has been restated. Read more on page 75. |  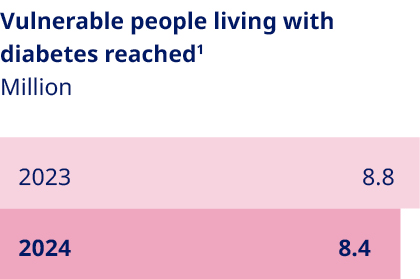 | ||||||||||||||||||||||||||
| Annual review / Strategic Aspirations / Purpose and sustainability | | |||||||||
 |  | ||||||||||||||||||||||||||||
| Decoupling environmental impact from our growth | Reducing our plastic footprint | ||||||||||||||||||||||||||||
Our commitment to delivering life-changing medicines to millions of people worldwide compels us to responsibly manage our use of water, energy and resources. We have made significant progress in reducing our scope 1 and 2 emissions since 2019. However, our scope 3 emissions, which comprise about 96% of our total emissions, continue to rise as we grow to meet increasing demand for our medicines. To achieve net zero emissions by 2045, we have a roadmap to reduce scope 3 emissions by 33% by 2033, using 2024 as the baseline. This target – which covers nearly 70% of our scope 3 emissions in accordance with Science Based Targets initiative (SBTi) provisions – is aligned with climate science and has been submitted to the SBTi for validation. Key decarbonisation measures include switching to low-carbon materials and feedstock across our production network, shifting our distribution model to low-emissions transportation and supporting our suppliers in transitioning to renewable energy. To date, more than 1,800 suppliers have already committed to make the switch. At the same time, we acknowledge that these measures will not be enough to meet our target, and will therefore investigate additional levers – including new technologies – to close this gap. Additionally, we have sharpened our focus on the impact of our operations on nature and biodiversity, setting an ambition to halt nature loss across our value chain by 2033 and achieving nature-positive status by 2045. | 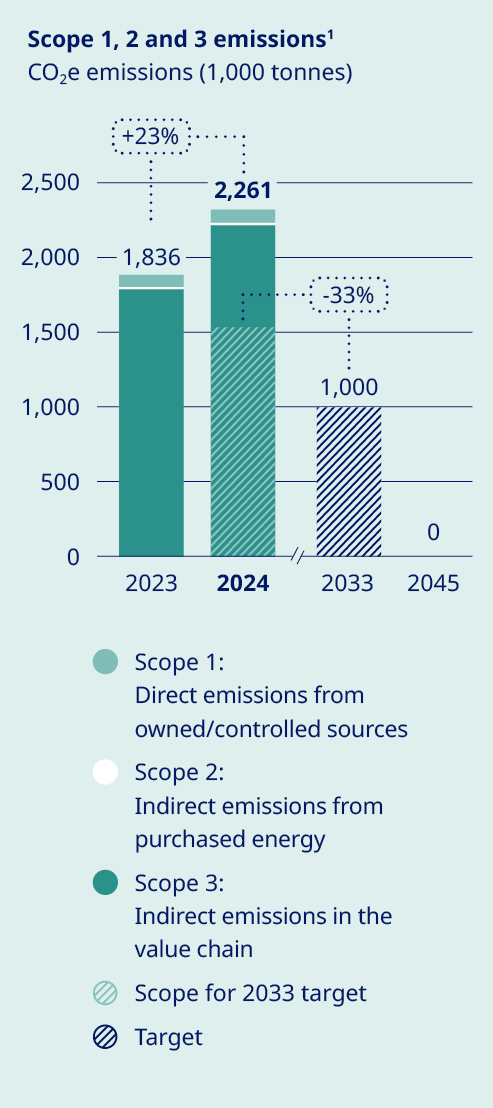 | Around the world, millions of people with serious chronic diseases depend on medical devices. Once used, many of these devices end up in landfills or are incinerated, wasting tonnes of valuable materials that could be recycled. As the number of people who rely on our medicines increases, so does our obligation to help address the related environmental issues – including plastic waste. To this end, we are targeting a 30% reduction in the amount of plastic used per patient by 2033, underpinned by the adoption of a reduce, change and avoid approach across our diabetes and obesity portfolio. We aim to achieve this by transitioning from disposable to reuseable devices and by developing new medicines designed to be administered less frequently. In addition, we are scaling up our ReMed™ device take-back scheme to avoid plastic waste ending up in landfills. ReMed™ is built on the success of our local take-back pilot programmes, enabling pen users to return their used devices to give the plastic a new life. Four years on, and more than four million returned pens since the launch of the first pilot, the scheme is now active in seven key markets – including Denmark, where we collaborate with other healthcare companies to offer a unique industry-wide solution. The same collaborative model will be piloted in the UK in 2025. | “We are targeting a 30% reduction in the amount of plastic used per patient by 2033” 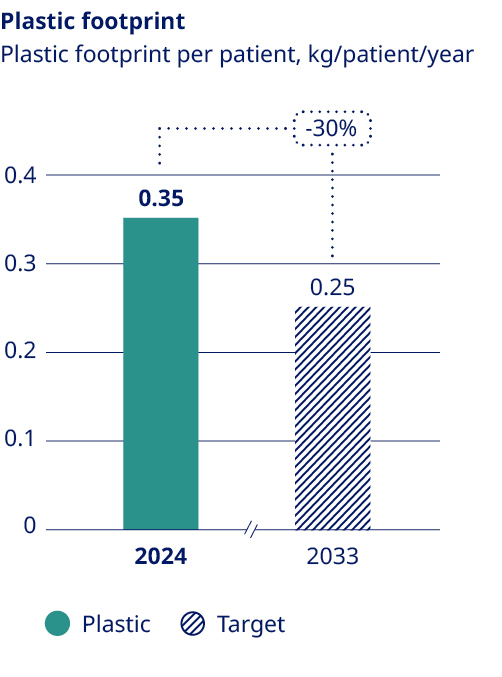 | ||||||||||||||||||||||||||
| 1. The 2023 figure has been restated; read more about this and our emissions targets on page 57. | |||||||||||||||||||||||||||||
| Annual review / Strategic Aspirations / Purpose and sustainability | | |||||||||
 | ||||||||||||||
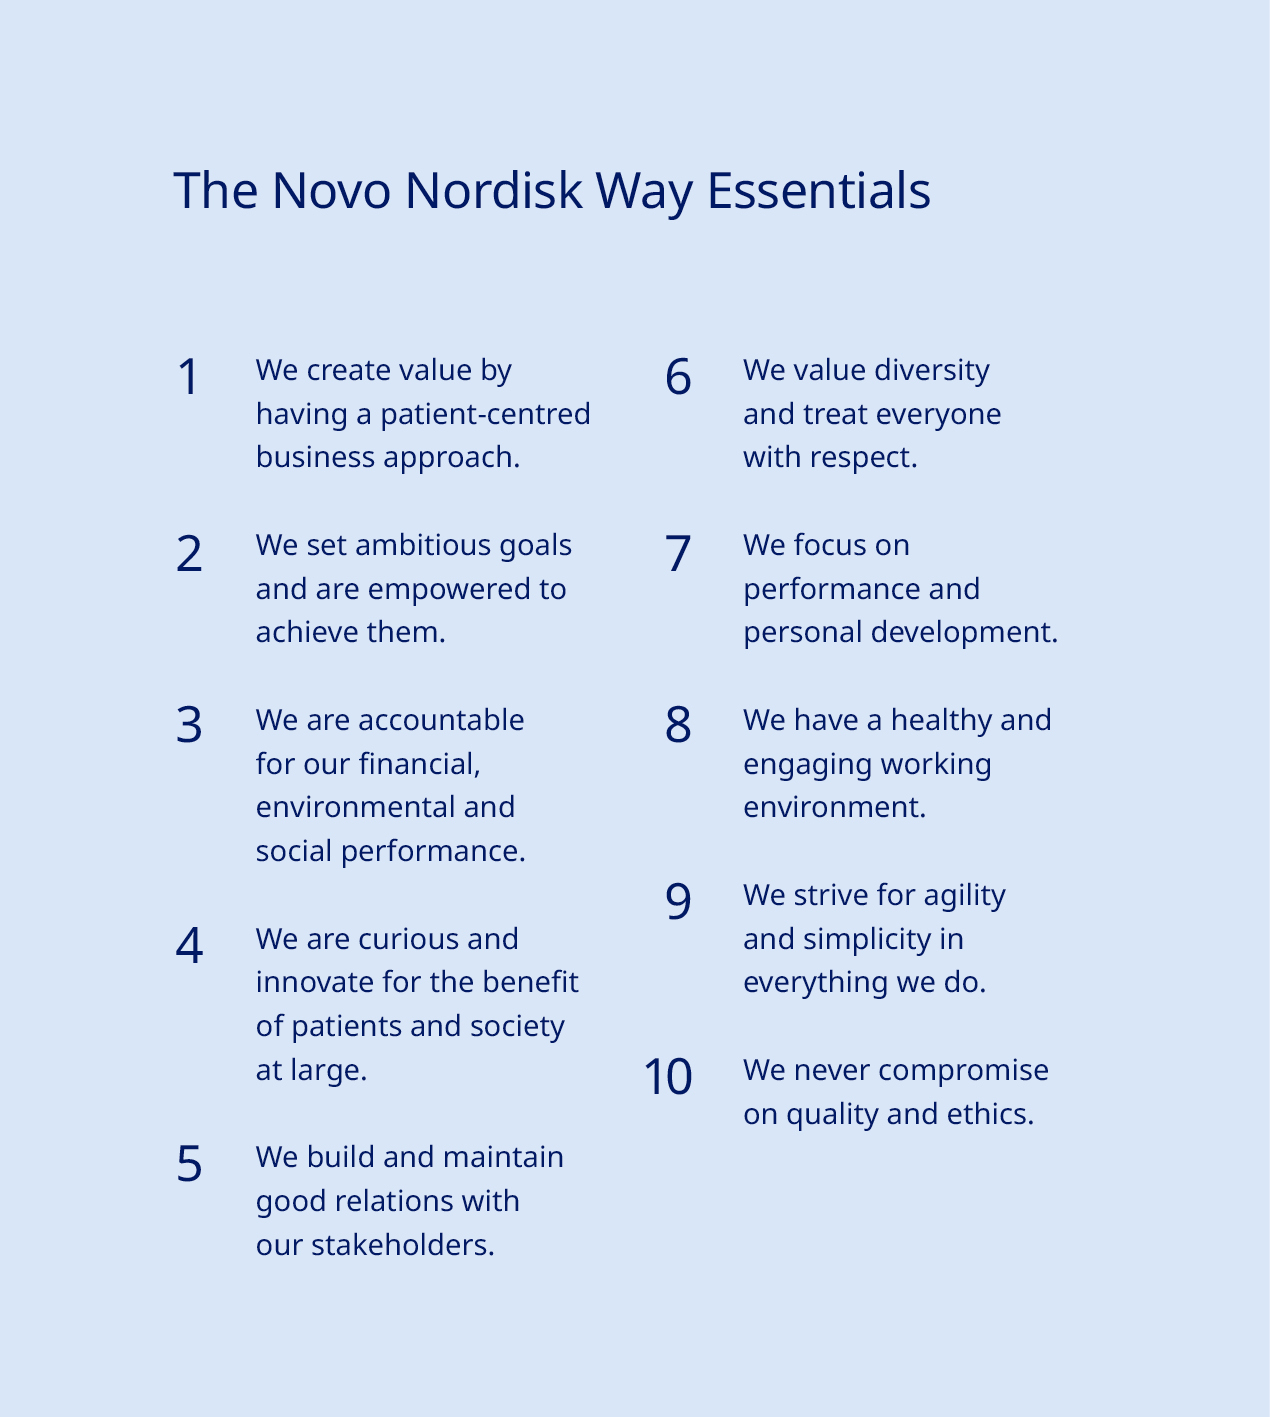
| Sustainably scaling our organisation | The extraordinary surge in demand for our life-changing medicines in recent years has led to a substantial increase in the number of new hires as we expand our workforce to keep pace. Last year alone, we added 13,030 employees across our global organisation, which now comprises 77,349 colleagues worldwide. “Our focus is on sustainably scaling our organisation; ensuring it is run efficiently, our priorities remain clear and our resources are used optimally” Our focus is on sustainably scaling our organisation; ensuring it is run efficiently, our priorities remain clear and our resources are used optimally. This approach helps safeguard the wellbeing of our expanding workforce and bolsters our reputation as a highly engaged and supportive place to work. Last year, we recorded an overall engagement score of 85% in our annual company survey, which saw a record 90% of all employees participate. To support the integration of our new colleagues, we aim to equip all new hires with the support and resources they need to onboard and connect with our strong company culture and purpose, which remain essential to our success. By dedicating additional time and resources to this integration process, we also help to foster an environment that values diverse perspectives and ensures every employee feels included. Moreover, it is crucial that we maintain a sustainable work-life balance for all our employees. As our business grows, we are carefully monitoring workplace stress levels, targeting a 10% annual reduction in the number of employees reporting symptoms of stress. Although we did not meet this target in 2024, when overall stress levels remained unchanged year-on-year at 13.8%, we will continue to implement new measures to address symptoms of stress at the earliest opportunity. The foundation of our commitment to supporting the wellbeing and development of our employees is the Novo Nordisk Way; a set of guiding principles constituting the core of our identity and operations. It bridges our company’s past, present and future, steering our strategy, decisions and behaviours. By familiarising new employees with the 10 Essentials that direct the decisions and actions of every Novo Nordisk colleague, we uphold our dedication to the company’s core values of openness, accountability and respect. We employ a distinctive, systematic approach known as facilitation – value audits – to ensure that all employees adhere to these Essentials. | |||||||||||||
 | ||||||||||||||
| Annual review / Strategic Aspirations / Purpose and sustainability | | |||||||||
 Corporate governance | ||||||||||||||
Governance structure The shareholders of Novo Nordisk exercise their rights at the Annual General Meeting, which is the supreme governing body of the company. The general meeting, inter alia, adopts the company’s Articles of Association, approves the Annual Report and elects the Board of Directors. Any shareholder has the right to raise questions at general meetings. Resolutions can generally be passed by a simple majority. However, resolutions to amend the Articles of Association require two-thirds of the votes cast and capital represented, unless other adoption requirements are imposed by the Danish Companies Act. Novo Nordisk has a two-tier management structure consisting of the Board of Directors and Executive Management. The governance structure and rules of Novo Nordisk are further described in our Articles of Association and our Corporate Governance Report, both available at: www.novonordisk.com/about/corporate-governance.html. Foundation ownership Novo Holdings A/S, a Danish company wholly owned by the Novo Nordisk Foundation, holds the majority of votes at Novo Nordisk A/S’ general meetings. The combination of foundation ownership and stock listing enables Novo Nordisk to embark on long-term sustainable strategies while maintaining short-term transparency on performance. Our foundation ownership supports the overarching imperative to be both commercially successful and responsive to the wider needs of society. The Novo Nordisk Foundation has two objectives: to provide a stable basis for the commercial and research activities of Novo Nordisk, Novonesis and additional companies in Novo Holdings’ investment portfolio; and to support scientific, humanitarian and social causes. Please refer to the section on value creation on page 9. For more information about the ownership structure of Novo Nordisk, see page 36. Corporate governance reporting Novo Nordisk reports in accordance with the Danish Corporate Governance Recommendations, which are implemented by Nasdaq Copenhagen in the Nordic Main Market Rulebook for Issuer of Shares, as well as the Corporate Governance Standards of the New York Stock Exchange applicable to foreign private issuers. | Novo Nordisk complies with the Danish Corporate Governance Recommendations as we account for which recommendations we comply with or deviate from and explain our chosen approach. You can find further information about our corporate governance practices and statement on our approach to each of the Danish Corporate Governance Recommendations as well as the Corporate Governance Standards of the New York Stock Exchange in our Corporate Governance Report, available at: www.novonordisk.com/about/corporate-governance.html. Remuneration Executive remuneration is linked to financial performance as well as non-financial performance (e.g. innovation and sustainability). Novo Nordisk has prepared a separate Remuneration Report describing the remuneration awarded or due during 2024 to the Board of Directors and Executive Management members registered with the Danish Business Authority. The Remuneration Report is submitted to the Annual General Meeting for an advisory vote. The Remuneration Policy and the Remuneration Report are available at: www.novonordisk.com/about/corporate-governance.html. Disclosure regarding change of control provisions It is disclosed that Novo Nordisk does not have any material contracts that take effect, alter or terminate upon a change of control of Novo Nordisk following implementation of a takeover bid. In the event of termination – whether by Novo Nordisk or by the individual – due to a merger, acquisition or takeover of Novo Nordisk, members of Executive Management registered with the Danish Business Authority are, in addition to the notice period, entitled to a severance payment of 24 months’ base salary plus pension contribution. Ethics and compliance In Novo Nordisk, we have an ethics and compliance programme which comprises of a code of conduct (OneCode), requirements (The Ethics Navigator), processes and awareness and capability building as stipulated in the seven elements of an effective compliance programme. Data privacy is a key component in our ethical principles, ensuring guardrails are in place to manage and mitigate risks, thus safeguarding our patients and society at large. We have also adopted a set of principles for data and artificial intelligence (AI) ethics to support ethical decision-making. We have initiated building our AI Ethics & Compliance framework, incorporating elements such as principles, requirements and risk assessments, as well as building AI literacy training and capabilities. You can read more about these principles, in accordance with the Danish Financial Statements Act Section 99d, at: www.novonordisk.com/data-privacy-and-user-rights/data-ethics.html. | |||||||||||||
| Annual review / Strategic Aspirations / Innovation and therapeutic focus | | |||||||||
INNOVATION AND THERAPEUTIC FOCUS Empowering patients with life-changing innovations | Our evolution from a diabetes-centric company to an organisation with a broader focus on metabolic and cardiovascular health requires even sharper prioritisation across our portfolio. To do this, we have established the role, purpose and ambition level for each therapy area based on future opportunities, while at the same time assessing our competitive strengths and the capabilities required to unlock these opportunities. The result is a clear set of priorities that guide our R&D and external business development activities across therapy areas. These include significant investments in novel technological platforms as well as strategic collaborations and acquisitions that expand our research horizons and ensure we remain at the forefront of therapeutic innovation. Our primary strategic focus remains on strengthening our leadership position in diabetes and obesity. The latter is an increasingly critical area of unmet medical need, impacting more than one billion people worldwide. Our robust pipeline underscores our ambition to develop transformative treatment solutions. Notable advancements include the phase 3 development of CagriSema, an innovative once-weekly combination of an amylin analogue (cagrilintide) and GLP-1 receptor agonist (semaglutide), and successfully completing the phase 1b/2a trial with subcutaneous amycretin, a unimolecular long-acting GLP-1 and amylin receptor agonist. Driven by a strong focus on strategic partnerships and external innovation, our modality portfolio has expanded significantly in recent years, and now incorporates diverse approaches including proteins and peptides, small interfering ribonucleic acid (siRNA), small molecules, cell therapy and gene editing. This diversification enables us to leverage multiple modalities for target biology, enhancing our ability to address complex diseases. Ongoing projects include collaborations with biotech firms including Heartseed (cell therapy) and Ventus Therapeutics (small molecules) to identify novel drug candidates for the treatment of heart failure and atherosclerotic cardiovascular disease, while the acquisition of the megaTAL technology platform from longstanding partner 2seventy bio has enhanced our in-house gene editing capabilities in haemophilia. Artificial intelligence (AI) and human data also play a pivotal role in our R&D activities. By leveraging real-world evidence and diverse data cohorts, we are able to enhance our early discovery processes, while our AI-driven data mining and analyses help us mitigate risks involved in translating findings from animal models to humans. This approach accelerates the discovery of new targets and increases the likelihood of clinical success. Our R&D hub in the greater Boston area, a world-leading life sciences cluster, exemplifies this forward-thinking approach, working with local partners to leverage the power of machine learning, big data and AI to enhance our R&D capabilities. | ||||||||||||||||||||||
| As healthcare innovation accelerates at an unprecedented rate, Novo Nordisk is driving transformative change across multiple therapy areas, with a particular focus on meeting unmet patient needs in diabetes, obesity, cardiovascular diseases and rare blood disorders. Through strategic investments in AI-driven drug discovery, clinical trial optimisation and new technological platforms, our ambition is to set new standards for innovation that deliver tangible, lasting improvements to the lives of the people we serve. | |||||||||||||||||||||||
| Strategic Aspirations 2025 |  | ||||||||||||||||||||||
 | Further raise the innovation-bar for Diabetes treatment Develop a leading portfolio of superior treatment solutions for Obesity Strengthen and progress the Rare disease pipeline Establish presence in Cardiovascular & Emerging Therapy Areas focusing on CVD, MASH and CKD1 | ||||||||||||||||||||||
| 1. Cardiovascular disease, metabolic dysfunction-associated steatohepatitis and chronic kidney disease. | |||||||||||||||||||||||
| Annual review / Strategic Aspirations / Innovation and therapeutic focus | | |||||||||
 | |||||||||||||||||
| Developing breakthrough innovations in obesity | Obesity is a public health crisis impacting more than one billion people worldwide. Meeting unmet needs in obesity is a critical focus area for Novo Nordisk, and our aim is to build a differentiated portfolio of superior treatment solutions that go beyond weight loss to deliver meaningful improvements in overall metabolic and cardiovascular health and physical function. Over the past year, we have strengthened our leadership position in this dynamic and rapidly-growing space. At the forefront of these advancements are two promising investigational therapies: CagriSema and amycretin. CagriSema, currently in phase 3 development for the treatment of obesity or overweight and type 2 diabetes, aims to combine the proven efficacy of semaglutide with the potential complementary benefits of cagrilintide, a novel amylin analogue. Topline results from the pivotal REDEFINE 1 phase 3a trial demonstrated 22.7% weight loss vs 2.3% with placebo alone after 68 weeks if all people adhered to treatment – among the highest reductions yet seen in a phase 3a programme for a GLP-1 combination therapy. CagriSema appeared to have a safe and well-tolerated profile in the study. The most common adverse events were gastrointestinal, and the vast majority were mild to moderate and diminished over time, consistent with the GLP-1 receptor agonist class. With the insights obtained from the REDEFINE 1 trial, we plan to further explore the weight loss potential of CagriSema in an additional study. Amycretin, a novel unimolecular GLP-1 and amylin receptor agonist, aims to combine the physiological effects of these two biologies, enhancing glucose-dependent insulin secretion, inhibiting glucagon release, slowing gastric emptying and promoting satiety. Findings from a phase 1b/2a study of subcutaneous amycretin demonstrated a safety profile consistent with incretin-based therapies. The most common adverse events were gastrointestinal and the vast majority were mild to moderate in severity. When evaluating the effects of treatment if all people adhered to treatment, amycretin demonstrated an estimated body weight loss of 9.7% on 1.25 mg (20 weeks), 16.2% on 5 mg (28 weeks) and 22.0% on 20 mg (36 weeks). People treated with placebo experienced an estimated 1.9%, 2.3% and 2.0% body weight gain, respectively. These results support the weight lowering potential of amycretin previously seen with the once-daily oral formulation, which demonstrated 13.1% weight loss after 12 weeks in a phase 1 study. In addition to these developments, we successfully completed two phase 3b obesity trials with semaglutide 7.2 mg. When evaluating the effects of treatment if all people adhered to treatment over 72 weeks, semaglutide 7.2 mg demonstrated 20.7% weight loss vs 2.4% with placebo in people with obesity in the STEP UP study, and 14.1% weight loss vs 3.6% with placebo in people with obesity and type 2 diabetes in the STEP UP T2D study. We are also continuing to unpack the full data sets from our landmark SELECT trial programme, which include samples from approximately 11,000 people collected over a five-year period. Enhanced by AI and digital capabilities, these data can help us identify new targets and biomarkers for future projects and predict disease progression and treatment response. | ||||||||||||||||
| Patricio Argüelles lives with obesity in Mexico. |  | ||||||||||||||||
| Annual review / Strategic Aspirations / Innovation and therapeutic focus | | |||||||||
 | |||||||||||||||||
| Pioneering transformational treatments for diabetes | The discovery of insulin more than 100 years ago transformed diabetes from a death sentence into a manageable disease. Today, we are still driving change in diabetes by improving quality of life through innovative new treatments and delivery devices. The past year has been no exception, characterised by advancements in our diabetes pipeline that demonstrate our commitment to raising the bar for innovation in this ever-evolving therapy area. CagriSema is a once-weekly combination of an amylin analogue (cagrilintide) and a GLP-1 receptor agonist (semaglutide). It is currently in phase 3 development for the treatment of type 2 diabetes in the REIMAGINE programme to assess its effects on blood glucose regulation, body weight and broader metabolic health parameters. A separate phase 3 programme – REDEFINE – is also investigating CagriSema for the treatment of obesity. We are also making progress in the development of a once-weekly GIP/GLP-1 receptor dual agonist, aiming to leverage the combined benefits of two powerful incretin hormones. By activating both GIP (gastric inhibitory polypeptide) and GLP-1 receptors, this investigational therapy aims to enhance blood sugar control, increase insulin secretion, reduce glucagon levels and promote weight loss. In type 1 diabetes, our early-stage pipeline has similarly transformative potential. Key projects include Pumpsulin, which aims to deliver a novel fast-acting insulin optimised for use in future insulin pump-based fully closed-loop CSII (Continuous Subcutaneous Insulin Infusion) systems, and our work on developing a glucose-sensitive insulin. Currently in phase 1 clinical development, this cutting-edge therapy is designed to automatically respond to the body’s glucose levels, offering a more dynamic and physiological approach to insulin treatment. “The therapy aims to preserve the body’s natural ability to produce insulin, potentially preventing or delaying the onset of type 1 diabetes” Another notable example is our DNA immunotherapy project. Targeted at individuals recently diagnosed and at risk of developing type 1 diabetes, this investigational therapy aims to transform the management of the disease by addressing the root cause of the immune system’s harmful response. Administered through regular injections, it seeks to ‘retrain’ the immune system to stop attacking insulin-producing cells in the pancreas. By doing so, the therapy aims to preserve the body’s natural ability to produce insulin, potentially preventing or delaying the onset of type 1 diabetes. | ||||||||||||||||
Novo Nordisk employee Jacob Sten Petersen and his daughter Vita at the Breakthrough T1D Walk in the US. Vita was diagnosed with type 1 diabetes at age three. | 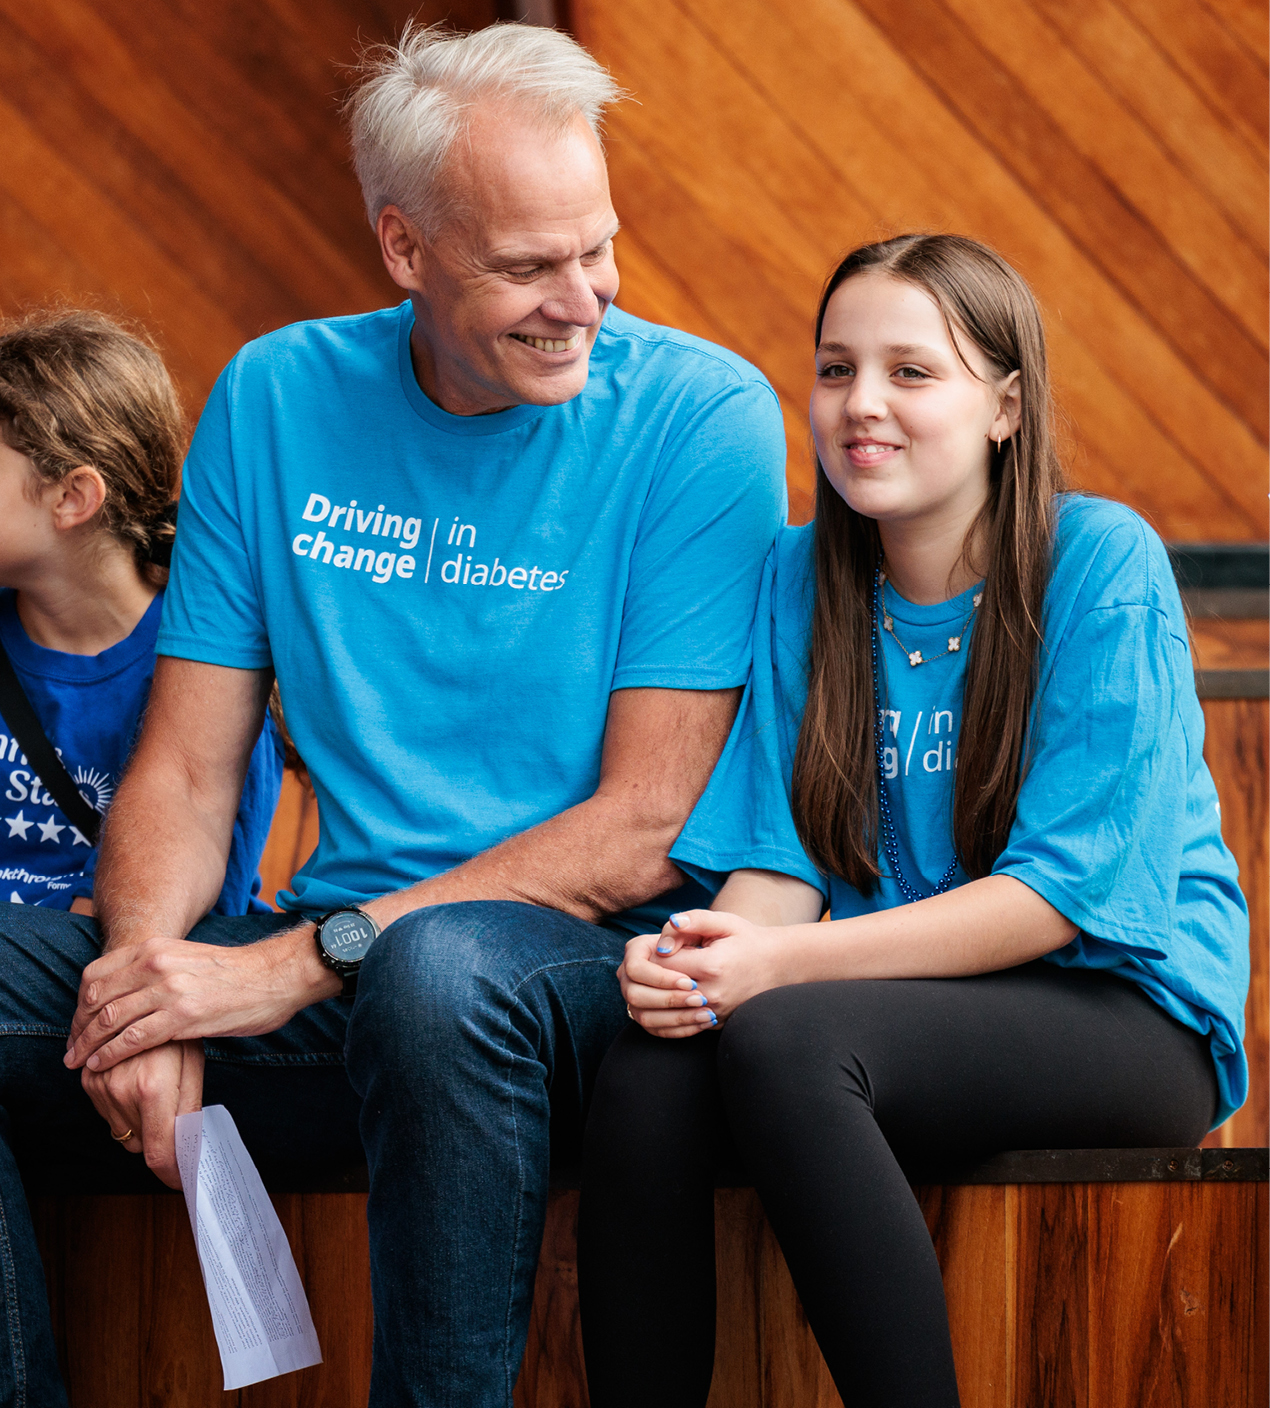 | ||||||||||||||||
| Annual review / Strategic Aspirations / Innovation and therapeutic focus | | |||||||||
 | |||||||||||||||||
| Cardiovascular disease, the world’s biggest killer | Cardiovascular diseases (CVD) are the leading cause of death globally, taking an estimated 17.9 million lives each year. The prevalence of CVD is on the rise, driven by factors such as ageing populations, lifestyle changes and increasing rates of obesity and diabetes. This growing burden underscores the urgent need for innovative treatments to manage and mitigate the impact of cardiovascular (CV) conditions. Although CVD is a crowded, highly competitive therapy area, significant unmet needs persist. Our GLP-1-based therapies Ozempic®, Wegovy® and Rybelsus® have all demonstrated a reduction in risk of major adverse CV events in separate cardiovascular outcomes trials, adding to the growing body of evidence supporting the robust cardiometabolic profile of semaglutide. Beyond our portfolio of GLP-1-based medicines, we are also developing a pipeline of CV assets targeting specific, underserved areas where we can leverage our expertise in metabolic diseases. Central to these efforts is ziltivekimab, our lead CV candidate currently in phase 3 development across multiple CV indications. Acquired as part of a business development deal to bring Boston-based biotech firm Corvidia Therapeutics in-house back in 2020, ziltivekimab is an investigational monoclonal antibody designed to target interleukin-6 (IL-6), a protein in the inflammation pathway linked to the development of different CV conditions. By targeting IL-6, ziltivekimab is under investigation to reduce inflammation and potentially improve outcomes across a spectrum of CV conditions – including atherosclerotic cardiovascular disease, heart failure with preserved ejection fraction, and acute myocardial infarction. “Phase 2 data demonstrated that ziltivekimab significantly lowers inflammation biomarkers linked to atherosclerosis in individuals with advanced chronic kidney disease” Phase 2 data demonstrated that ziltivekimab significantly lowers inflammation biomarkers linked to atherosclerosis in individuals with advanced chronic kidney disease. With phase 3 trials now in progress, our goal is to establish the first-in-class therapy as a foundational treatment for high-risk cardiovascular patients, aiming to improve cardiovascular outcomes by targeting systemic inflammation. With the potential to improve outcomes across several indications, ziltivekimab exemplifies our commitment to strengthening our position in the CVD space. | ||||||||||||||||
| Greg Patterson lives with cardiovascular disease in the US. |  | ||||||||||||||||
| Annual review / Strategic Aspirations / Innovation and therapeutic focus | | |||||||||
 |  | ||||||||||||||||||||||||||||
| Emerging therapies for MASH | Pioneering AI in research and development | ||||||||||||||||||||||||||||
| Semaglutide has already proven its effectiveness in enhancing glycaemic control, promoting weight loss and reducing cardiovascular risk. Now, it has demonstrated potential as a treatment for metabolic dysfunction-associated steatohepatitis (MASH), a progressive liver disease that affects more than 250 million people worldwide. MASH is characterised by liver inflammation and damage due to fat accumulation. If left untreated, this condition can progress to cirrhosis and liver failure, posing a significant health risk. Yet with only one pharmacological treatment approved specifically for MASH, there is significant unmet need in the space for effective therapeutic options. According to the headline results from part one of the ESSENCE trial, semaglutide 2.4 mg demonstrated a statistically significant and superior improvement in liver fibrosis with no worsening in steatohepatitis – as well as resolution of steatohepatitis with no worsening of liver fibrosis at 72 weeks. This initial phase of the study included 800 people with MASH and moderate to advanced liver fibrosis. Part two of the trial, designed to evaluate the long-term impact of semaglutide 2.4 mg on liver-related clinical events, is set to continue until 2029. Meanwhile, Novo Nordisk plans to file for regulatory approval in the US and EU in the first half of 2025. | “Semaglutide 2.4 mg demonstrated a statistically significant and superior improvement in liver fibrosis with no worsening in steatohepatitis” 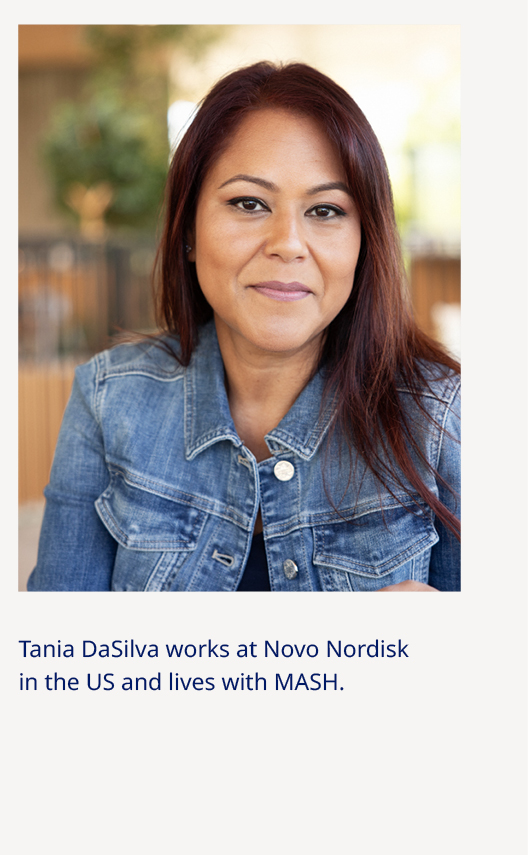 | We are revolutionising our R&D efforts through artificial intelligence (AI), particularly in drug discovery, molecular design and clinical trial optimisation. In drug discovery, AI is playing a pivotal role in identifying new compounds. By combining AI with high-throughput experimentation, we have assessed one billion virtual molecules via computer modelling and screened approximately 2,500 compounds in the lab. This led to the discovery of a highly selective amylin compound that closely mimics the natural hormone, requiring 50-75% fewer design rounds. Molecular design has also advanced through AI. By leveraging predictive pharmacology and knowledge mining, we are able to accelerate the design cycles of new molecules, expediting development and enhancing the precision of targeted therapies. AI is also optimising our clinical trials by identifying subpopulations, improving trial design and site selection and forecasting outcomes. For example, harmonising data from around 1,600 clinical trials, including SELECT and STEP, has provided best-in-class cardiometabolic data, leading to improved disease insights, patient stratification and drug target identification. We are also enhancing our AI capabilities through strategic partnerships. Our recently expanded collaboration with Valo Health is a prime example of our approach, seeking to accelerate the development of up to 20 novel drug programmes within the cardiometabolic space by leveraging cutting-edge AI technology and extensive human datasets. |  “By combining AI with high-throughput experimentation, we have assessed one billion virtual molecules via computer modelling and screened approximately 2,500 compounds in the lab” | ||||||||||||||||||||||||||
| Annual review / Strategic Aspirations / Innovation and therapeutic focus | | |||||||||
 | |||||||||||||||||
| Pioneering new treatments for rare blood disorders | Novo Nordisk has a long-standing legacy of pioneering advancements in the treatment of rare blood disorders, and our pipeline is primed to extend this tradition. In haemophilia A, our investigational treatment Mim8 represents an optimised therapeutic approach that could redefine the standard of care for patients worldwide, while a novel oral Factor VIIIa mimetic could be on the horizon with Inno8. Traditional treatments for haemophilia A often require intravenous infusions and cumbersome administration procedures, posing a significant burden for patients. Mim8 offers a promising alternative, administered subcutaneously in a weekly, bi-weekly or monthly dose. It mimics the function of missing clotting Factor VIII (FVIII) by bridging Factor IXa and Factor X to restore the body’s ability to form blood clots. Mim8 is currently pending submission for regulatory review. Inno8 holds the potential to become the first-ever oral treatment for haemophilia A. Inno8 is a small antibody fragment that – like Mim8 – mimics FVIIIa function, but the size of the molecule is small enough to enable oral absorption. The Inno8 development programme is focused on a fast-to-market approach with overlapping clinical trials, seeking to provide a convenient and efficacious alternative to regular infusions. We have also partnered with a pioneering biotech firm, 2seventy bio, to develop a groundbreaking gene editing treatment for haemophilia A. This collaboration – which was initiated in 2019, extended in 2022 and resulted in the acquisition of the megaTAL technology platform in 2024 – aims to correct the clotting factor deficiency in patients, potentially eliminating the need for regular treatments. Our efforts extend beyond haemophilia to haemoglobinopathies, a group of inherited genetic blood disorders affecting the structure or production of the haemoglobin molecule. Here, we are building a research portfolio to address the underlying disease pathophysiology. We are utilising our innovative technology platforms to restore red blood cell health and reduce inflammation and organ damage. Etavopivat, an investigational oral once-daily therapeutic developed to improve anaemia and red blood cell health in people with sickle cell disease (SCD), is at the forefront of our efforts in this area. Etavopivat was acquired as part of the deal that brought Forma Therapeutics in-house back in 2022, and is currently in a phase 3 clinical trial in adolescents and adults with SCD, and a phase 2 trial for people with transfusion-dependent SCD and thalassemia, another hereditary haemoglobinopathy disorder. Results from the phase 2 part of the HIBISCUS trial programme were presented at the Annual Meeting of the American Society of Hematology in 2024, and indicate that etavopivat has the potential to improve haemoglobin levels and reduce the incidence of vaso-occlusive crises compared to placebo – severe pain caused when blood vessels are blocked and deprive tissues of oxygen – in people with SCD. | ||||||||||||||||
| Ebrar Oruc lives with haemophilia A in Turkey. |  | ||||||||||||||||
| Annual review / Strategic Aspirations / Innovation and therapeutic focus | | |||||||||
| Pipeline overview | |||||||||||
 | |||||||||||
| Project | Indication | Description | Phase | ||||||||
| IcoSema NN1535 | T2D1 | A combination of GLP-12 receptor agonist semaglutide and insulin icodec intended for once-weekly subcutaneous treatment. |  | ||||||||
| Icodec NN1436 | T1D3 and T2D | A long-acting basal insulin analogue intended for once-weekly subcutaneous treatment. |  | ||||||||
| CagriSema NN9388 | T2D | A combination of amylin analogue cagrilintide and GLP-1 receptor agonist semaglutide intended for once-weekly subcutaneous treatment. |  | ||||||||
OW GIP4/GLP-1 NN9541 | T2D | A dual GLP-1/GIP receptor agonist intended for once-weekly subcutaneous treatment. |  | ||||||||
| GELA NN9506 | T2D | A collaboration with GE Healthcare, using ultrasound for once-monthly treatment. |  | ||||||||
| Amycretin NN9490 | T2D | A unimolecular long-acting GLP-1 and amylin receptor agonist intended for once-daily oral treatment and once-weekly subcutaneous treatment. | | ||||||||
| Pumpsulin NN1471 | T1D | A novel insulin analogue for use in closed loop pump systems. |  | ||||||||
| DNA immunotherapy NN9041 | T1D | A novel plasmid encoding pre-proinsulin, TGF5-beta1, IL6-10 and IL-2 intended for subcutaneous treatment. | | ||||||||
| OW Oral Semaglutide NN9904 | T2D | An oral version of the GLP-1 receptor agonist intended for once-weekly treatment. | | ||||||||
GSI7 NN1644 | T1D | An injectable glucose sensitive insulin intended for once daily treatment. |  | ||||||||
 | ||
| 1. T2D: Type 2 diabetes. 2. GLP-1: Glucagon-like peptide-1. 3. T1D: Type 1 diabetes. 4. GIP: Gastric inhibitory polypeptide. 5. TGF: Transforming growth factor. 6. IL: Interleukin. 7. GSI: Glucose-sensitive insulin. 8. CB-1: Cannabinoid receptor-1. 9. PKR: Pyruvate kinase-R. 10. RNAi: Ribonucleic acid interference. 11. CKD: Chronic kidney disease. 12. ASCVD: Atherosclerotic cardiovascular disease. 13. AMI: Acute miocardial infarction. 14. HFpEF: Heart failure with preserved ejection fraction. 15. CVD: Cardiovascular disease. 16. ANGPTL3: Angiopoietin-like 3. 17. MASH: Metabolic dysfunction-associated steatohepatitis. 18. FGF21: Fibroblast growth factor 21. 19. RNA: Ribonucleic acid. 20. LXRa: Liver X receptor alpha. 21. siRNA: Small interfering RNA. 22. MARC1: Mitochondrial amidoxime-reducing component 1. 23. NLRP3i: NOD-like receptor protein 3 inhibitor. 24. PD-L1: Programmed death ligand 1. | ||
 | ||||||||||||||
| Project | Indication | Description | Phase | |||||||||||
| Oral Semaglutide NN9932 | Obesity | A long-acting GLP-1 receptor agonist, 25 mg and 50 mg, intended for once-daily oral treatment. | | |||||||||||
| Semaglutide 7.2 mg NN9536 | Obesity | A long-acting GLP-1 receptor agonist, 7.2 mg, intended for once-weekly subcutaneous treatment. | | |||||||||||
| CagriSema NN9838 | Obesity | A combination of amylin analogue cagrilintide and GLP-1 receptor agonist semaglutide intended for once-weekly subcutaneous treatment. | | |||||||||||
| GELA NN9505 | Obesity | A collaboration with GE Healthcare, using ultrasound for once-monthly treatment. | | |||||||||||
| Monlunabant NN9440 | Obesity | CB-18 receptor inverse agonist intended for once-daily oral treatment. | | |||||||||||
| Cagrilintide NN9833 | Obesity | An amylin analogue intended for once-weekly subcutaneous treatment. |  | |||||||||||
| Amycretin NN9487 | Obesity | A unimolecular long-acting GLP-1 and amylin receptor agonist intended for once-daily oral treatment and once-weekly subcutaneous treatment. | | |||||||||||
| INV-347 NN9441 | Obesity | CB-1 receptor inverse agonist intended for once-daily oral treatment. | | |||||||||||
| OW GIP/GLP-1 NN9542 | Obesity | A dual GLP-1/GIP receptor agonist intended for once-weekly subcutaneous treatment. | | |||||||||||
| Triple NN9662 | Obesity | Tri-agonist. | | |||||||||||
| Amylin 355 NN9638 | Obesity | Amylin analogue developed for once-weekly subcutaneous treatment. | | |||||||||||
 | |||||||||||
| Project | Indication | Description | Phase | ||||||||
| Mim8 NN7769 | Haemophilia A w/wo inhibitors | A next generation FVIIIa mimetic bispecific antibody intended for subcutaneous prophylaxis for haemophilia A. | | ||||||||
| Etavopivat NN7535 | Sickle cell disease | A second-generation small molecule PKR9-activator intended for once-daily oral treatment. |  | ||||||||
| Etavopivat NN7536 | Thalassemia | A second-generation small molecule PKR-activator intended for once-daily oral treatment. | | ||||||||
| NDec NN7533 | Sickle cell disease | An oral combination of decitabine and tetrahydrouridine. The project is developed in collaboration with EpiDestiny. | | ||||||||
TMPRSS2 RNAi10 | Hereditary haemo- chromatosis | Small interfering RNA intended for once every 1 to 3 months subcutaneous treatment. | | ||||||||
| Inno8 NN7441 | Haemophilia A w/wo inhibitors | An antibody intended for oral administration. | | ||||||||
 | |||||||||||
| Project | Indication | Description | Phase | ||||||||
| Ziltivekimab NN6018 | CKD11 ASCVD12 AMI13 HFpEF14 | A once-monthly monoclonal antibody intended for inhibition of IL-6 activity. | | ||||||||
| Coramitug NN6019 | CVD15 | An anti-amyloid immunotherapy intended for intravenous treatment. | | ||||||||
| CM4HF NN9003 | CVD | An investigational cell therapy intended for restoring heart function in people with chronic heart failure. | | ||||||||
| Anti-ANGPTL3 mAb NN6491 | CVD | An ANGPTL316 neutralising sweeping antibody intended for once-monthly subcutaneous treatment. | | ||||||||
| Semaglutide NN6535 | Alzheimer’s | A long-acting GLP-1 receptor agonist intended for once-daily oral or once-weekly subcutaneous treatment. | | ||||||||
| Semaglutide NN9931 | MASH17 | A long-acting GLP-1 receptor agonist intended for once-weekly subcutaneous treatment. | | ||||||||
| CagriSema NN9588 | MASH | A combination of amylin analogue cagrilintide and GLP-1 analogue semaglutide intended for once-weekly subcutaneous treatment. | | ||||||||
| Zalfermin NN9500 | MASH | A long-acting FGF2118 analogue intended for once-weekly subcutaneous treatment. | | ||||||||
| CDR132L NN6706 | Heart failure | An RNA19-based oligonucleotide inhibitor developed for once-monthly intravenous treatment. | | ||||||||
LXRa20 NN6582 | MASH | A siRNA21 targeting LXRa intended for once-monthly subcutaneous treatment. | | ||||||||
MARC122 NN6581 | MASH | A siRNA molecule targeting MARC1 intended for once-monthly subcutaneous treatment. | | ||||||||
| SC4PD NN9001 | Parkinson’s | Cryopreserved cell therapy developed for disease modifying treatment. | | ||||||||
| DCR-XDH NN4004 | Gout | An RNA-based oligonucleotide intended for subcutaneous treatment. | | ||||||||
Ventus NLRP3i23 NN6022 | CVD | Small molecule NLRP3 inhibitor intended for once-daily oral treatment. | | ||||||||
| CNP HF NN6537 | Heart failure | C-type natriuretic peptide intended for once-weekly subcutaneous treatment. | | ||||||||
PD-L124 NN4003 | Oncology | A PD-L1 GalXC™-derived lipid conjugate intended for once-monthly subcutaneous treatment. | | ||||||||
| STAT3 NN4002 | Oncology | A GalXC™-derived lipid conjugate one-time subcutaneous treatment. | | ||||||||
| Annual review / Strategic Aspirations / Innovation and therapeutic focus | | |||||||||
| Annual review / Strategic Aspirations / Innovation and therapeutic focus | | |||||||||
1. This overview does not include products whose sales represent less than 0.5% of Novo Nordisk’s total sales. 2. Patent status varies from country to country. The figures in the table are based on Germany. 3. For Ozempic® in Canada, regulatory data protection applies until 2026. 4. Modern insulins are NovoRapid® (NovoLog®), NovoMix® 30 (NovoLog® Mix 70/30) and Levemir®. 5. Formulation patent; active ingredient patent has expired. | ||
| Product | US | China | Japan | Europe2 | ||||||||||
Ozempic®3 | 2032 | 2026 | 2031 | 2031 | ||||||||||
Human insulin and Modern insulins4 | Expired | Expired | Expired | Expired | ||||||||||
Rybelsus® | 2032 | 2026 | 2031 | 2031 | ||||||||||
Tresiba® | 2029 | Expired | 2027 | 2028 | ||||||||||
Victoza® | Expired | Expired | Expired | Expired | ||||||||||
Ryzodeg® | 2029 | Expired | Expired | 2028 | ||||||||||
Xultophy® | 2029 | Expired | Expired | 2028 | ||||||||||
Fiasp® | 20305 | 20305 | 20305 | 20305 | ||||||||||
| Product | US | China | Japan | Europe2 | ||||||||||
Wegovy® | 2032 | 2026 | 2031 | 2031 | ||||||||||
Saxenda® | Expired | Expired | Expired | Expired | ||||||||||
| Product | US | China | Japan | Europe2 | ||||||||||
NovoSeven® | Expired | Expired | Expired | Expired | ||||||||||
Norditropin® (SimpleXx®) | Expired | Expired | Expired | Expired | ||||||||||
Esperoct® | 2032 | 2029 | 2034 | 2034 | ||||||||||
| Annual review / Strategic Aspirations / Commercial execution | | |||||||||
COMMERCIAL EXECUTION Safeguarding supply and improving access across expanding markets | Balancing the growing needs of our patients with effective management of our resources is key to how we operate. As global demand increases we have refined our portfolio strategy to maximise the reach and impact of our treatments. This includes efforts to optimise our diabetes portfolio by gradually phasing out some of our older insulin products to free up manufacturing capacity and resources across our supply chain. By doing so, we can dedicate more space in our manufacturing network to innovative, scalable solutions – and ultimately expand the reach of our life-changing innovations to millions more patients over the next decade. At the same time, we are striving to provide those who are impacted by the changes to our portfolio with access to alternative treatment options, either from Novo Nordisk or other companies. We are working closely with local health authorities and the medical community in affected markets to develop new access initiatives for at-risk individuals. Furthermore, our extensive range of partnership programmes – including iCARE and our Access to Insulin Commitment – continue to provide access to affordable care for vulnerable populations living in low- and middle-income countries. We are also increasing our production capacity through site expansions and acquisitions. A significant milestone in 2024 was the acquisition of three fill-finish sites previously run by the global contract manufacturing and development organisation Catalent Inc. This move will enable us to expand our manufacturing capacity and provide future optionality and flexibility for our existing supply network, while complementing our significant ongoing internal supply chain expansions. The unprecedented scale of our capital expenditure, which includes record investments in the expansion of existing production sites, underscores our commitment to meeting the growing demand for our medicines. In 2024, work continued on major expansions of our production sites in Denmark, France, Brazil, China and the US – investments that will ultimately enable us to reach millions more people worldwide with our innovations. Ensuring uninterrupted access to treatment options for people already using Novo Nordisk medicines also remains a top priority. By adopting clear prioritisation principles, we are focusing on the responsible and equitable launch and distribution of new and existing products across geographies and patient groups. This includes allocating a proportion of Wegovy® volumes in every new launch market for people with a high medical need and low socioeconomic status. | ||||||||||||||||||||||
 | Amid escalating diabetes and obesity crises, Novo Nordisk is experiencing unprecedented global demand for our life-changing medicines. With mounting evidence of the broad systemic impact and societal value of our GLP-1-based treatments, we have developed innovative commercial strategies to safeguard patient access and strengthen supply chain resilience worldwide. | ||||||||||||||||||||||
| Strategic Aspirations 2025 |  | ||||||||||||||||||||||
| Strengthen Diabetes leadership – aim at global value market share of more than 1/3 More than DKK 25 billion in Obesity sales by 2025 Secure a sustained growth outlook for Rare disease | ||||||||||||||||||||||
| Annual review / Strategic Aspirations / Commercial execution | | |||||||||
| ||||||||||||||||||||
Ozempic® sales uptake further strengthens our leadership in diabetes care | Demand for Novo Nordisk’s GLP-1-based medicines, particularly Ozempic®, continued to soar throughout 2024, reflecting the growing global prevalence of diabetes. Administered as a once-weekly injection for the treatment of type 2 diabetes, Ozempic® maintains its position as the world’s biggest-selling diabetes medicine, backed by its proven efficacy in controlling blood sugar and reducing body weight, as well as a growing body of evidence demonstrating broader cardiometabolic benefits. Over the past year alone, the clinical profile of Ozempic® has been further boosted by data demonstrating a reduction in the risk of kidney disease progression in people with type 2 diabetes and chronic kidney disease, as well as functional improvements in people with type 2 diabetes and symptomatic peripheral artery disease vs placebo. “Demand has been fuelled by a broader acceptance and understanding of the importance of GLP-1-based therapies” Now available in more than 70 markets, Ozempic® sales have been central to the continued growth in sales of our diabetes products. Our strategic aspiration to secure a value market share of at least one-third by 2025 has already been achieved, and the continued uptake of Ozempic® across launch markets has enabled us to maintain a value market share of 33.7% in 2024. This demand has been fuelled by a broader acceptance and understanding of the importance of GLP-1-based therapies among healthcare professionals, patients and payers as a cornerstone of effective diabetes care and management. Novo Nordisk is not the only healthcare company investing in the growth and development of the GLP-1 segment, and competition has increased significantly over the past year. Nevertheless, we remain the market leader in the diabetes GLP-1 space with a value share of 55.1%, a slight increase compared to 2023 when our value share stood at 54.8%. Despite the sales penetration of Ozempic®, high demand has also posed challenges, necessitating strategic decisions to prioritise distribution to regions and patient groups with the most pressing needs. We have also continued to invest heavily in expanding production capacity, seeking to stabilise supply and ensure that Ozempic® remains accessible to the growing number of patients who have already initiated treatment. Through our industry-leading portfolio, relentless focus on innovation and robust pipeline of next-generation treatments, we remain well-positioned to maintain and enhance our leadership position in diabetes care. | |||||||||||||||||||
 |  | |||||||||||||||||||
 | ||||||||||||||||||||
| Annual review / Strategic Aspirations / Commercial execution | | |||||||||
| ||||||||||||||||||||
Awiqli® approval underscores our continuing commitment to insulin | Our company is built upon a century-long legacy of innovation in diabetes care, and we are still pushing boundaries as we search for new breakthroughs in this ever-evolving space. These efforts are exemplified by the launch of Awiqli® – the world’s first once-weekly basal insulin – in China, Germany and Canada. “Awiqli® represents a critical and innovative addition to our diabetes portfolio and a key milestone for patients seeking to reduce some of the challenges of diabetes management” Awiqli® represents a critical and innovative addition to our diabetes portfolio and a key milestone for patients seeking to reduce some of the challenges of diabetes management – particularly the burden of multiple injections. Its approval in the EU was based on phase 3a clinical trial results demonstrating superior blood sugar reduction and superior time in range (time spent within the recommended blood sugar range), compared with daily basal insulin in people living with type 2 diabetes not previously treated with insulin. Trial data also showed low rates of clinically significant or severe hypoglycaemia – less than one event per patient-year of exposure – with no statistically significant difference compared to daily basal insulin in insulin naïve people living with type 2 diabetes. However, the therapy’s journey to market in the US has been more challenging, with the US Food and Drug Administration (FDA) issuing a Complete Response Letter (CRL) in July 2024. This followed a meeting of the FDA Endocrinologic and Metabolic Drugs Advisory Committee in May 2024, where a panel of independent scientific experts discussed the benefit-risk of once-weekly insulin icodec in type 1 diabetes. The panel determined that the data available were not sufficient to conclude on a positive benefit-risk in type 1 diabetes. In the CRL, the FDA requests more information relating to the manufacturing process and the type 1 diabetes indication before the review of the application can be completed. The CRL did not mention the use of once-weekly insulin icodec in type 2 diabetes. Novo Nordisk is evaluating the content of the CRL and will work closely with the FDA to fulfil the requests. Despite this setback in the US, the rollout of Awiqli® in other major markets underscores our continuing commitment to insulin innovation more than 100 years after our founders first commercialised production of this life-saving medicine. | |||||||||||||||||||
| Kyle Sam lives with type 2 diabetes and is part of the DUDES Club, a brotherhood to support men’s health and wellbeing in British Columbia, Canada. |  | |||||||||||||||||||
| Annual review / Strategic Aspirations / Commercial execution | | |||||||||
| ||||||||||||||||||||
Wegovy® maintains market-leading position in increasingly dynamic sector | The past year has been transformative for the burgeoning obesity market, marked by increasing competition and soaring demand for GLP-1 receptor agonists and other incretin-based therapies. Wegovy®, our flagship obesity therapy, has been at the forefront of this competitive landscape, maintaining its market-leading position despite new entrants to the segment. Following its initial launch in the US, Wegovy® is now available in more than 15 markets worldwide. As the obesity market continues to grow worldwide, so does the demand for Wegovy®. This is driven by the rising global prevalence of obesity – which has more than tripled over the past 50 years – and a broader shift in the perception of treatment. Once considered a lifestyle issue, obesity is now widely recognised as a serious chronic disease that requires medical intervention. We have responded by investing heavily in scaling up our production capacity and carefully prioritising launches and distribution. Our expanding global production network is operating around the clock to ensure a stable and consistent supply of Wegovy® and a proportion of Wegovy® volumes is being allocated in every launch market for people with a high medical need and low socioeconomic status. The continued success of Wegovy® is underpinned by its clinical profile as the world’s first weight management therapy also approved to reduce the risk of major adverse cardiovascular events – a key differentiator in an increasingly competitive segment. This has enabled us to capture much of the growth to date in a rapidly-expanding and dynamic market, helping us to build on our position of strength and reputation as first-movers in the space following the success of our first-generation GLP-1-based therapy, Saxenda®. Despite advancements in treatment and growing acceptance of obesity as a serious chronic disease, significant unmet needs remain. Many people living with obesity still lack access to effective therapies, and there is a clear need for continued innovation to develop treatments that can deliver greater efficacy and additional benefits. Moreover, there is a need for more holistic, preventive approaches that can address the multifaceted nature of obesity – including behavioural, psychological and environmental factors. Novo Nordisk is dedicated to addressing these unmet needs through a steadfast commitment to innovation. Our obesity pipeline includes numerous promising candidates aiming to further reduce the burden of obesity and related conditions on patients and healthcare systems alike. By leveraging our expertise in GLP-1-based therapies and exploring new therapeutic avenues, we are well-placed to continue leading the way in obesity treatment. | |||||||||||||||||||
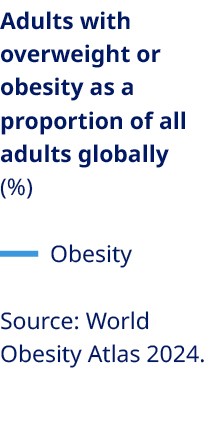 | 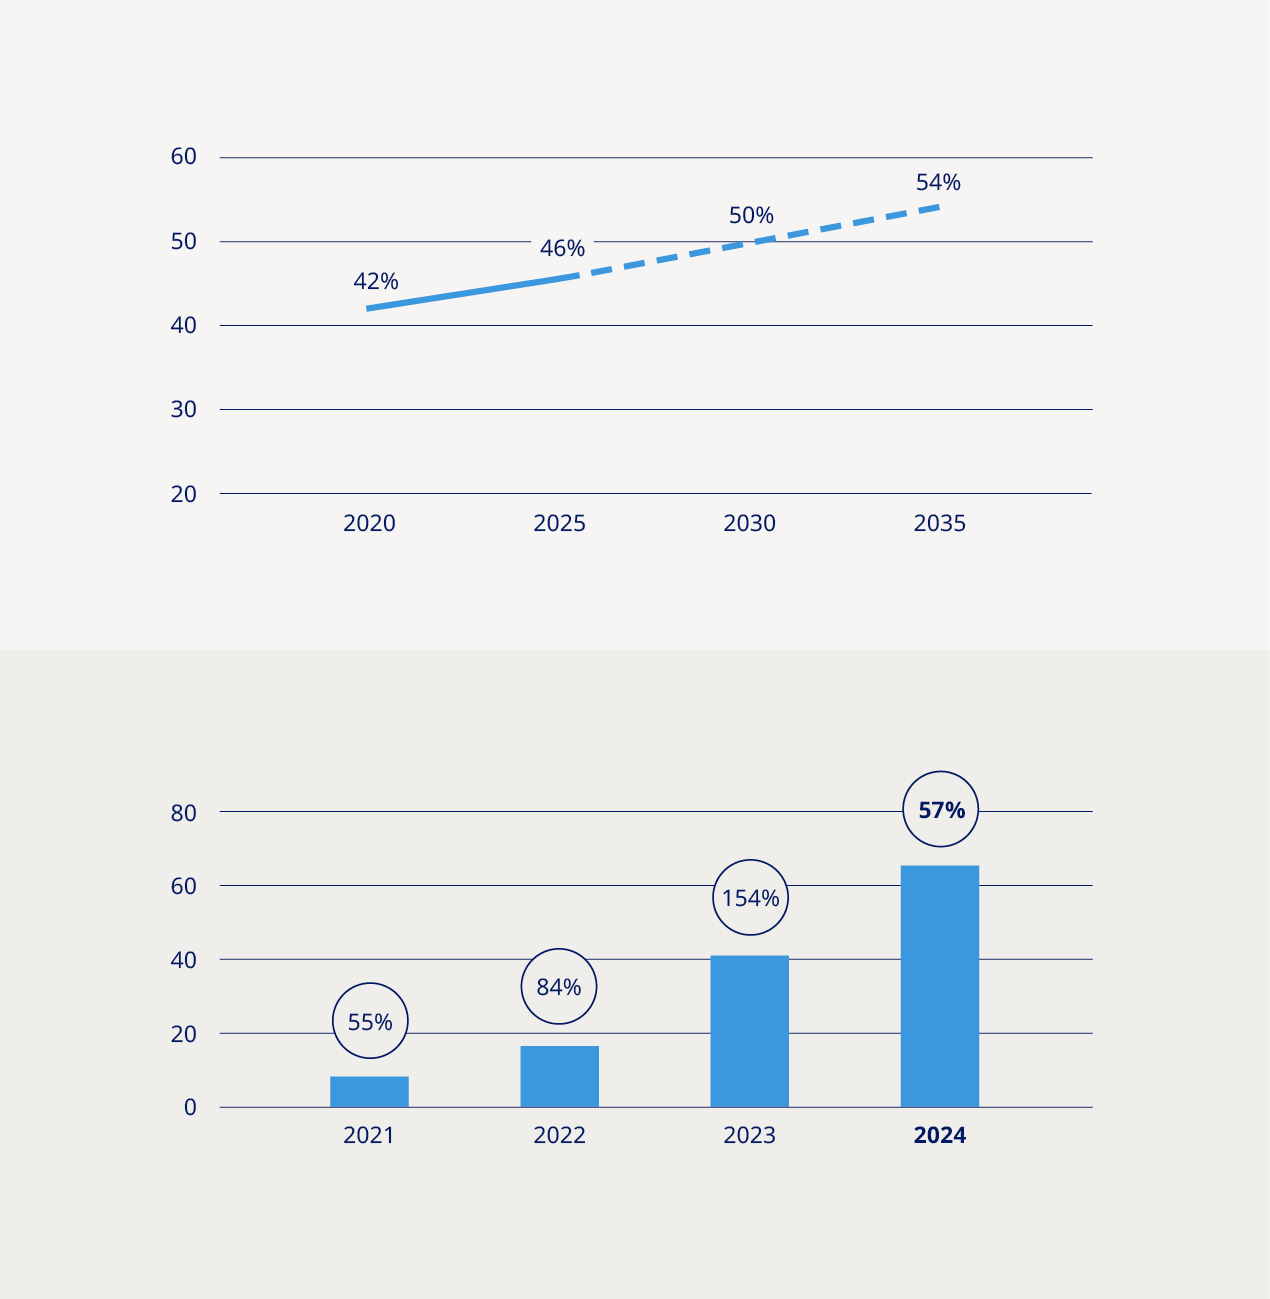 | |||||||||||||||||||
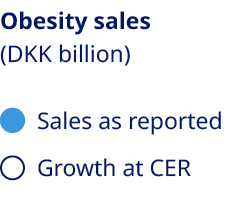 | ||||||||||||||||||||
| Annual review / Strategic Aspirations / Commercial execution | | |||||||||
| | |||||||||||||||||||||||||
Wegovy® label expansions underscore broader cardiometabolic benefits | Gearing up for new launches in our rare disease portfolio | |||||||||||||||||||||||||
The robust clinical profile of our market-leading weight loss therapy, Wegovy®, has been further validated after regulatory bodies approved label expansions acknowledging its efficacy in mitigating cardiovascular risks. These updates highlight the extensive cardiometabolic benefits of our market-leading GLP-1-based therapy, extending beyond weight reduction. The new indications are based on robust clinical evidence from key trial programmes SELECT and STEP HFpEF. Data from SELECT demonstrated that Wegovy® reduced the risk of major adverse cardiovascular events in people with overweight or obesity and established cardiovascular disease, on top of cardiovascular standard of care treatments vs placebo. Findings from the STEP HFpEF trials, meanwhile, showed that Wegovy® reduced symptoms of heart failure and physical limitations in people with obesity and heart failure with preserved ejection fraction (HFpEF) vs placebo. These data add to a growing body of evidence showcasing semaglutide’s potential to address critical unmet needs in cardiovascular health. By broadening the approved uses of Wegovy® and helping to differentiate the treatment in an increasingly competitive market, we are aspiring to both strengthen our leadership position in obesity and enhance our impact on broader public health. | “These data add to a growing body of evidence showcasing semaglutide’s potential to address critical unmet needs in cardiovascular health” | 2024 has been a year of significant progress in our rare disease portfolio, building on our strong legacy of innovation in rare blood and endocrine disorders. With the pending submission of Mim8, first launches of Alhemo® and continued rollout of Sogroya®, we are building on a return to growth for our Rare Disease franchise following a positive year in which overall sales increased 9% at constant exchange rates (CER). Sales of our rare endocrine disorder products increased by 31% at CER over the course of the year, mainly driven by the rollout of Sogroya® – the world’s first once-weekly treatment for both children and adults with growth hormone deficiency. Sogroya® is now available in seven countries, including the US. In rare blood disorders, phase 3 clinical trials have demonstrated the transformative potential of Mim8 in reducing bleeds. The investigational therapy is designed to mimic the activity of Factor VIIIa, the clotting protein missing or defective in people with haemophilia A. Alhemo® addresses significant unmet needs in haemophilia A and B with inhibitors – the latter being an area with very limited treatment options. Administered once-daily by subcutaneous injection, the therapy offers routine treatment to prevent bleeding in a prefilled pen device. Alhemo® is now approved in several markets worldwide, including the US and EU. | 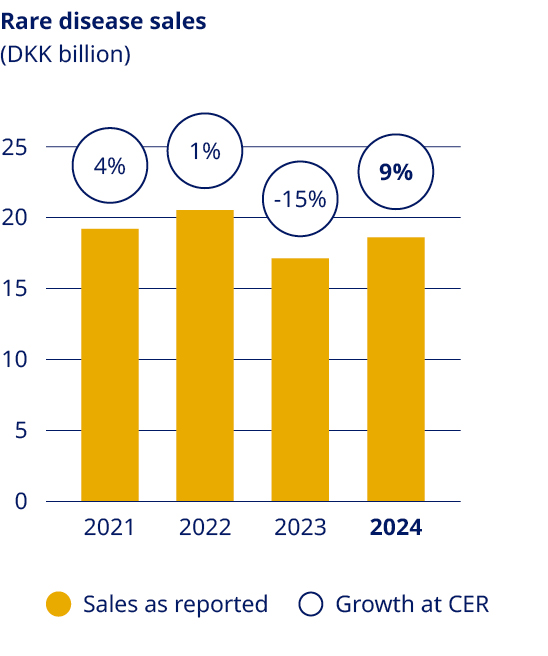 | |||||||||||||||||||||||
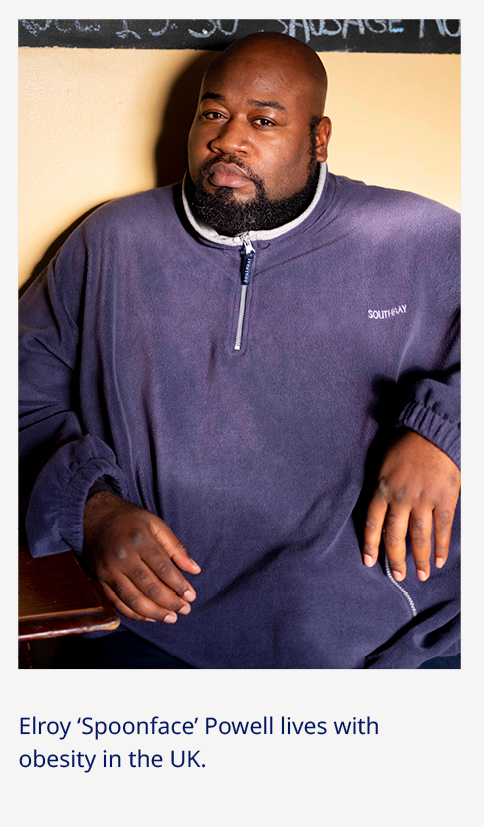 | ||||||||||||||||||||||||||
“Alhemo® addresses significant unmet needs in haemophilia A and B with inhibitors – the latter being an area with very limited treatment options” | ||||||||||||||||||||||||||
| Annual review / Strategic Aspirations / Commercial execution | | |||||||||
 | ||||||||||||||||||||
| Unprecedented investment in production lays foundation for continued growth | Over the past four years, we have more than quadrupled the global reach of our GLP-1-based medicines, increasing our volume market share in the GLP-1 segment to 63% over the same period. With demand still growing, we continued to expand our production network throughout 2024, making significant investments in capital expenditure (CapEx) and acquisitions totalling more than DKK 129 billion. Through the targeted acquisitions of brownfield sites, the strategic expansion of existing facilities, the establishment of new sites and the upscaling of our global production workforce, we are equipping ourselves to support the launch of multiple next-generation therapies and meet the needs of millions more people worldwide. The scope of these investments is measured not only in financial terms, but also by the increased volume of active pharmaceutical ingredients (API) and the number of devices we can produce. By investing in state-of-the-art, multi-product facilities designed to accommodate current and future products, we are laying a foundation for sustainable long-term growth. “We are investing more than DKK 80 billion into expanding our API production capacity, including the construction of a new 170,000 square metre, multi-product API facility in Kalundborg, Denmark” The ongoing expansions of our production sites across the globe exemplify our approach to scaling up. We are investing more than DKK 80 billion into expanding our API production capacity, including the construction of a new 170,000 square metre, multi-product API facility in Kalundborg, Denmark. Alongside additional expansions of sites in Denmark, France, Brazil, China and the US, these efforts will significantly enhance our ability to meet future demand across our portfolio. Our acquisition of three new fill-finish sites at the turn of the year complements the ongoing expansion of our internal supply chain, enabling us to expand our manufacturing capacity and provide future optionality and flexibility for our existing supply network. The three former Catalent sites were acquired as part of a transaction that saw Novo Holdings – the holding and investment company responsible for managing the wealth and assets of the Novo Nordisk Foundation – acquire the US-based contract manufacturing and development organisation. Approximately 3,200 highly skilled Catalent employees became part of Novo Nordisk under the terms of the agreement, which will ensure that existing obligations towards other customers currently being served by the three sites will be honoured. Removing bottlenecks in our existing supply chain also remains a top priority as we seek to keep pace with demand. The consolidation of our insulin portfolio will free up vital capacity and resources for production of our next-generation innovations, while our transition towards reusable devices and once-weekly rather than once-daily formulations continues. | |||||||||||||||||||
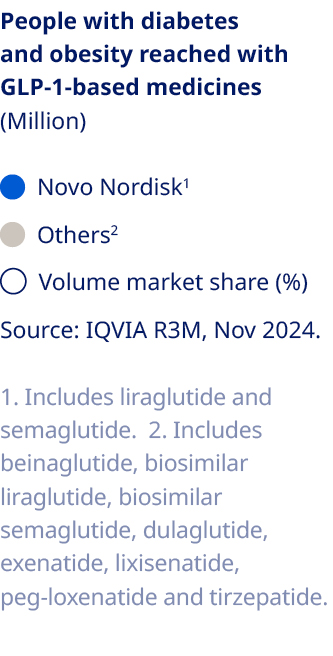 | 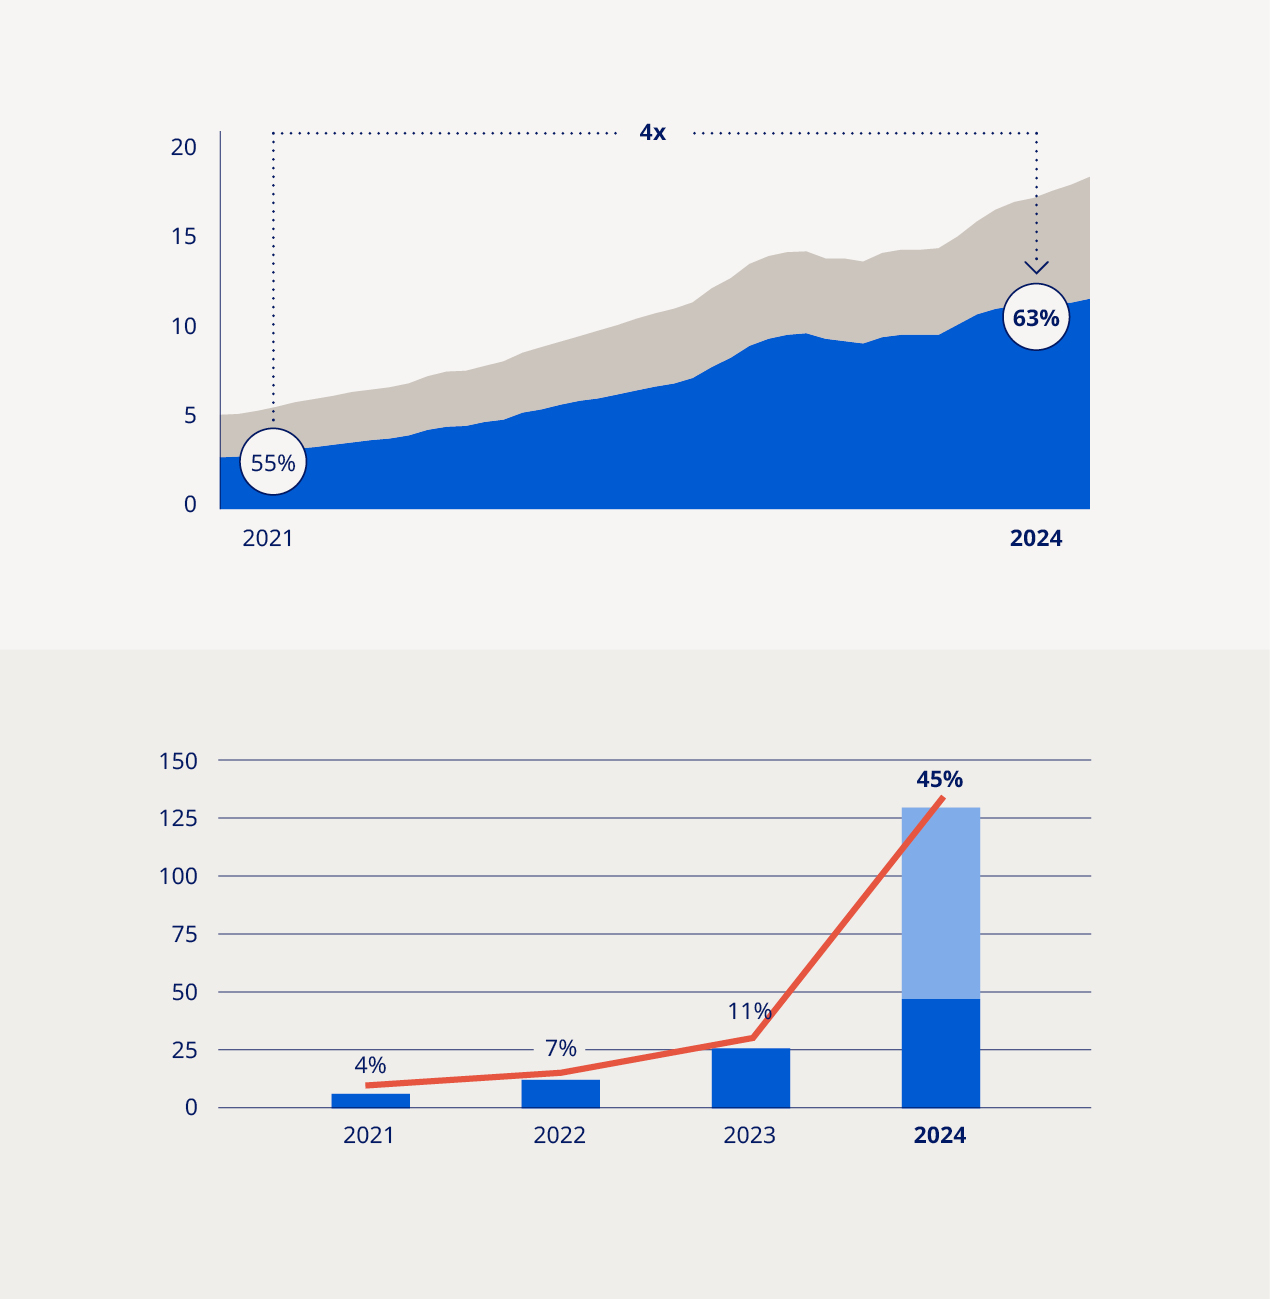 | |||||||||||||||||||
 | ||||||||||||||||||||
| Annual review / Strategic Aspirations / Financials | | |||||||||
Financial performance Sales increased by 25% measured in Danish kroner and by 26% at CER to DKK 290,403 million in 2024. Novo Nordisk's 2024 sales and operating profit performance measured at CER were within the ranges provided in November 2024. The effective tax rate, capital expenditure as well as depreciation, amortisation and impairment losses were all in line with the guidance. The free cash flow in 2024 was realised at DKK -14.7 billion, mainly impacted by the USD 11.7 billion acquisition price related to the three Catalent manufacturing sites. Geographic sales development Sales in North America Operations increased by 30% in both Danish kroner and at CER. Sales in International Operations increased by 17% measured in Danish kroner and by 19% at CER. Sales in EMEA increased by 19% in both Danish kroner and at CER. Sales in Region China increased by 11% measured in Danish kroner and by 13% at CER. Sales in Rest of World increased by 19% measured in Danish kroner and by 23% at CER. Sales development across therapeutic areas Sales in Diabetes care increased by 19% measured in Danish kroner and by 20% at CER. Sales of Obesity care products, Wegovy® and Saxenda®, increased by 56% measured in Danish kroner and by 57% at CER. Sales of Rare disease products increased by 9% in both Danish kroner and at CER. In the following sections, unless otherwise noted, market data are based on moving annual total (MAT) from November 2023 and November 2024 provided by the independent data provider IQVIA. 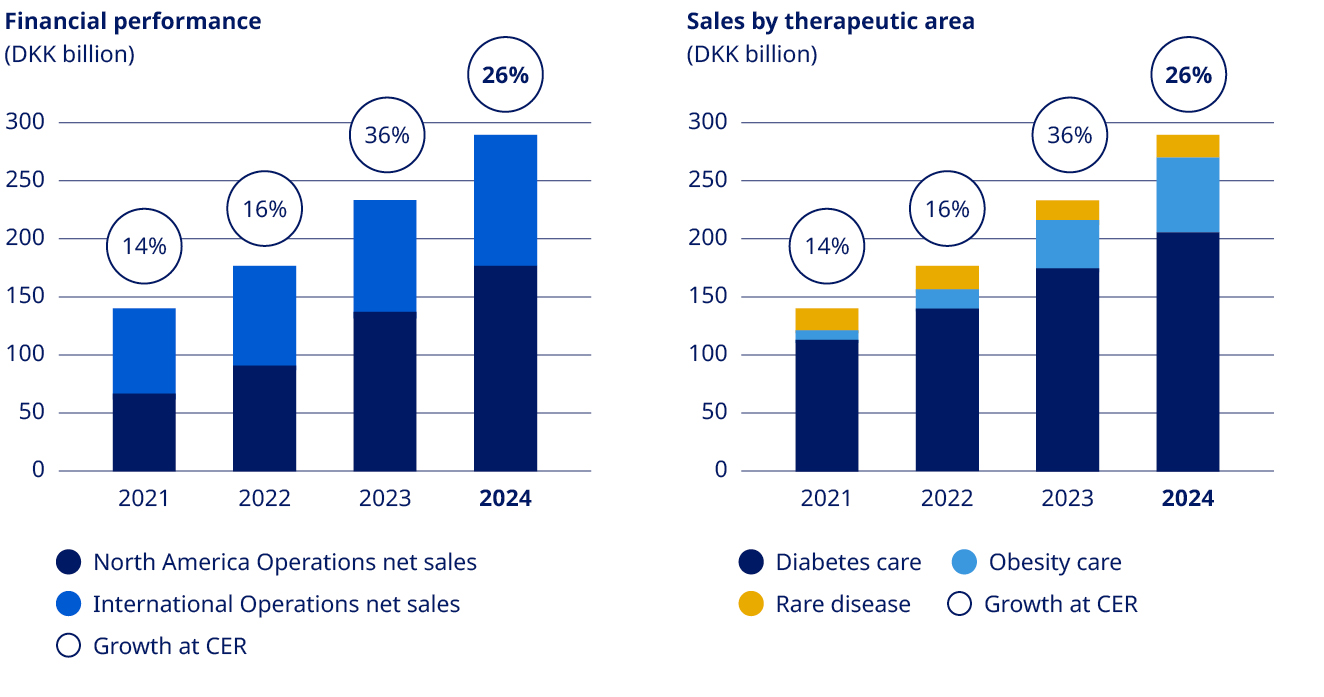 | |||||||||||||||||||||||
FINANCIALS 2024 performance and 2025 outlook | |||||||||||||||||||||||
 | |||||||||||||||||||||||
| Strategic Aspirations 2025 | |||||||||||||||||||||||
| Deliver solid sales and operating profit growth Drive operational efficiencies across the value chain to enable investments in future growth assets Deliver free cash flow to enable attractive capital allocation to shareholders | ||||||||||||||||||||||
| Annual review / Strategic Aspirations / Financials | | |||||||||
Diabetes care Sales in Diabetes care increased by 19% measured in Danish kroner and by 20% at CER to DKK 206,618 million driven by growth of GLP-1-based products and insulins. Novo Nordisk's global diabetes value market share remains unchanged over the last 12 months at 33.7%. The market share was driven by market share gains in North America Operations, offset by a market share decline in International Operations. GLP-1-based therapy for type 2 diabetes Sales of GLP-1-based products for type 2 diabetes (Rybelsus®, Ozempic® and Victoza®) increased by 21% measured in Danish kroner and by 22% at CER to DKK 149,125 million. The estimated global GLP-1 share of total diabetes prescriptions has increased to 6.7% compared with 6.0% 12 months ago. Novo Nordisk is the global market leader in the GLP-1 segment with a 55.1% value market share. Ozempic® sales increased by 26% in both Danish kroner and at CER to DKK 120,342 million. Sales growth was driven by both North America Operations and International Operations. Sales growth has resulted in periodic supply constraints and related drug shortage notifications across geographies. Rybelsus® sales increased by 24% measured in Danish kroner and by 26% at CER to DKK 23,301 million. Sales growth was driven by EMEA and Rest of World. Victoza® sales decreased by 37% measured in Danish kroner and by 36% at CER to DKK 5,482 million. The decline was driven by the GLP-1 diabetes market moving towards once-weekly treatments in both North America Operations and International Operations. Insulin sales Sales of insulin increased by 15% measured in Danish kroner and by 17% at CER to DKK 55,373 million. Obesity care Sales of Obesity care products, Wegovy® and Saxenda®, increased by 56% measured in Danish kroner and by 57% at CER to DKK 65,146 million. Sales growth was driven by both North America Operations and International Operations. The volume growth of the global branded obesity market was 119%. Novo Nordisk is the global market leader with a volume market share of 70.4%. Rare disease Rare disease sales increased by 9% in both Danish kroner and at CER to DKK 18,639 million. | Rare endocrine disorders Sales of Rare endocrine disorder products increased by 30% measured in Danish kroner and by 31% at CER to DKK 4,993 million. Novo Nordisk is working on gradually re-establishing supply of rare endocrine disorder products following a reduction of manufacturing output. Sogroya® has been launched in six countries, and the initial feedback from patients and physicians is encouraging. Rare blood disorders Sales of Rare blood disorder products increased by 3% in both Danish kroner and at CER to DKK 12,138 million mainly driven by increased haemophilia B sales. Development in costs and operating profit The cost of goods sold increased by 24% measured in Danish kroner and by 25% at CER to DKK 44,522 million, resulting in a gross margin of 84.7% measured in Danish kroner, compared with 84.6% 2023. The increase in gross margin mainly reflects a positive product mix driven by increased sales of GLP-1-based treatments and a positive price impact due to gross-to-net sales adjustments in the US. This is partially countered by costs related to ongoing capacity expansions. Sales and distribution costs increased by 9% measured in Danish kroner and by 10% at CER to DKK 62,101 million. The increase in costs is driven by both North America Operations and International Operations. In North America Operations, the cost increase is mainly driven by promotional activities related to Wegovy®. In International Operations, the increase is mainly related to Obesity care market development activities and Wegovy® launch activities as well as promotional activities for GLP-1 diabetes products. The increase in sales and distribution costs is negatively impacted by adjustments to legal provisions in 2023. Sales and distribution costs amounted to 21.4% as a percentage of sales. | ||||||||||||||||||||||
Research and development costs increased by 48% in both Danish kroner and at CER to DKK 48,062 million compared to 2023, mainly reflecting increased late-stage clinical trial activity, increased early research activities as well as impairment losses related to intangible assets. Research and development costs amounted to 16.6% as a percentage of sales. | 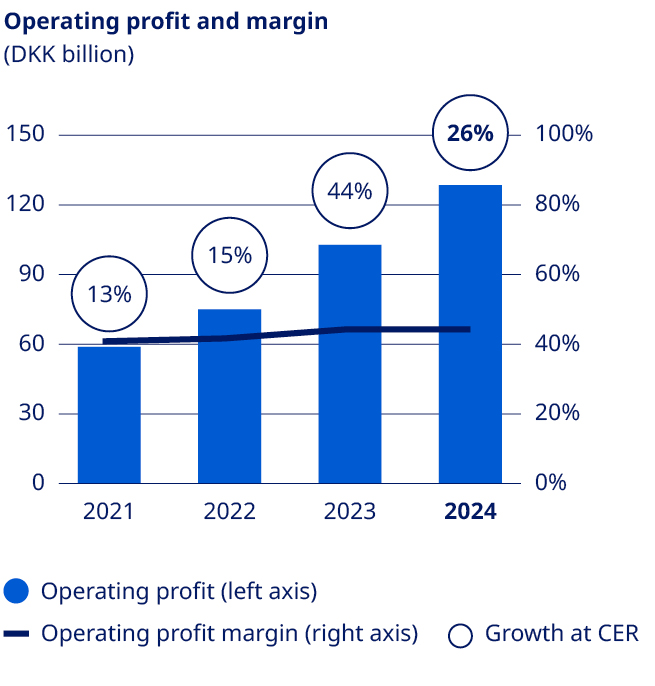 | ||||||||||||||||||||||
| Annual review / Strategic Aspirations / Financials | | |||||||||
Administration costs increased by 9% in both Danish kroner and at CER to DKK 5,276 million. Other operating income and expenses (net) showed a loss of DKK 2,103 million compared to an income of DKK 119 million in 2023. The loss is mainly reflecting impairments related to a partnership agreement of a company previously acquired by Novo Nordisk and transaction costs related to the Catalent transaction. Operating profit increased by 25% measured in Danish kroner and by 26% at CER to DKK 128,339 million, reflecting the sales growth and impairments related to intangible assets. EBITDA increased by 32% measured in Danish kroner and by 33% at CER. Financial items (net) and tax Financial items (net) showed a net loss of DKK 1,148 million compared with a net gain of DKK 2,100 million in 2023. This primarily reflects losses on non-hedged currencies. In line with Novo Nordisk’s treasury policy, the most significant foreign exchange risks for Novo Nordisk have been hedged, primarily through foreign exchange forward contracts. The foreign exchange result was a net loss of DKK 1,023 million compared with a net gain of DKK 1,652 million in 2023. As per the end of December 2024, a negative market value of financial contracts of approximately DKK 5.8 billion has been deferred for recognition in 2025. The effective tax rate was 20.6% in 2024 compared with an effective tax rate of 20.1% in 2023. Net profit increased by 21% to DKK 100,988 million and diluted earnings per share increased by 22% to DKK 22.63. Net profit and diluted earnings per share are impacted by impairments related to intangible assets. | 2025 outlook Sales growth is expected to be 16% to 24% at CER. Given the current exchange rates versus the Danish krone, sales growth reported in DKK is expected to be 3 percentage points higher than at CER. The guidance reflects expectations for sales growth in both North America Operations and International Operations, mainly driven by volume growth of GLP-1-based treatments for Obesity and Diabetes care. Intensifying competition and continued pricing pressure within Diabetes and Obesity care is included in the guidance. Following higher-than-expected volume growth in recent years, including GLP-1-based products such as Ozempic® and Wegovy®, combined with the expectation of continued volume growth and capacity limitations at some manufacturing sites, the outlook also reflects expected continued periodic supply constraints and related drug shortage notifications across a number of products and geographies. Novo Nordisk is investing in internal and external capacity to increase supply both short and long-term. Operating profit growth is expected to be 19% to 27% at CER. Given the current exchange rates versus the Danish krone, growth reported in DKK is expected to be 5 percentage points higher than at CER. The expectation for operating profit growth primarily reflects the sales growth outlook and continued investments in future and current growth drivers within Research, Development, Commercial and Manufacturing. Within R&D, investments are related to the continued expansion and progression of the early and late-stage pipeline. Commercial investments are mainly related to Obesity care market development and activities as well as investments within GLP-1 diabetes care. Within Manufacturing, investments are mainly related to ongoing scaling of capacity efforts, and a negative mid-single-digit operating profit growth impact related to the acquisition of the three Catalent manufacturing sites is also included in the guidance. Novo Nordisk expects financial items (net) for 2025 to amount to a loss of around DKK 9 billion. This is driven by expected losses on hedged currencies, primarily the US dollar due to the increased USD/DKK rate, and increased interest expenses related to funding of the Catalent transaction, as the acquisition is mainly debt-financed. The effective tax rate for 2025 is expected to be in the range of 21-23%. The increase compared to 2024 is mainly driven by country and therapy sales mix. Capital expenditure is expected to be around 65 billion DKK in 2025, reflecting expansion of the global supply chain. The investments will create additional capacity across the supply chain, including manufacturing of active pharmaceutical ingredients (API), additional aseptic production and finished production processes as well as packaging capacity. In the coming years, the capital expenditure to sales ratio is still expected to be low double-digit. Depreciation, amortisation and impairment losses are expected to be around DKK 17 billion, and include depreciations and amortisations related to the Catalent transaction. | ||||||||||||||||||||||
1. Expectations for 2025. | Cash flow and capital allocation Free cash flow in 2024 was realised at DKK -14.7 billion compared to DKK 68.3 billion in 2023. The lower free cash flow in 2024 is mainly impacted by the USD 11.7 billion acquisition price related to the three Catalent manufacturing sites. Free cash flow is also impacted by increasing capital expenditure, partially countered by net cash generated from operating activities. Capital expenditure for property, plant and equipment was DKK 47.2 billion compared with DKK 25.8 billion in 2023, primarily reflecting investments in additional capacity for active pharmaceutical ingredient (API) production and fill-finish capacity for both current and future injectable and oral products. Capital expenditure related to intangible assets was DKK 4.1 billion in 2024 compared with DKK 13.1 billion in 2023 reflecting business development activities. Income under the 340B Program has been partially recognised. | 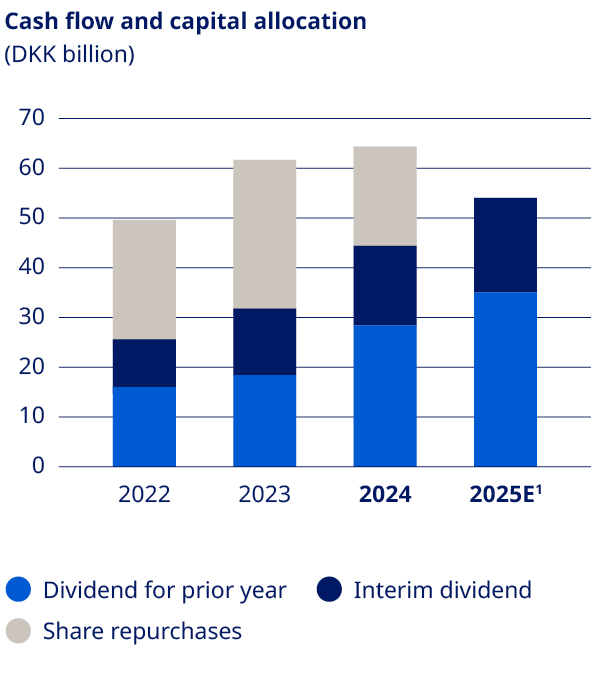 | |||||||||||||||||||||
| Annual review / Strategic Aspirations / Financials | | |||||||||
The free cash flow is expected to be DKK 75-85 billion reflecting the sales growth, a favourable impact from rebates in the US, countered by increased investments in capital expenditure. All of the above expectations are based on assumptions that the global or regional macroeconomic and political environment will not significantly change business conditions for Novo Nordisk during 2025, including energy and supply chain disruptions, the potential implications from major healthcare reforms and legislative changes, taxation changes, including changes in tariffs and duties, as well as outcome of legal cases including litigations related to the 340B Drug Pricing Program in the US, and that the currency exchange rates, especially the US dollar, will remain at the current level versus the Danish krone. The guidance is also based on assumptions in relation to the estimation of gross-to-net developments in the US gross sales. Finally, the guidance does not include the financial implications of any new significant business development transactions and significant impairments of intangible assets during 2025. Novo Nordisk has hedged expected net cash flows in a number of invoicing currencies, and, all other things being equal, movements in key invoicing currencies will impact Novo Nordisk’s operating profit as outlined in note 4.4 on Financial risks. | Forward-looking statements Novo Nordisk’s statutory Annual Report 2024, Form 20-F, any quarterly financial reports, and written information released, shown, or oral statements made, to the public in the future by or on behalf of Novo Nordisk, may contain certain forward-looking statements relating to the operating, financial and sustainability performance and results of Novo Nordisk and/or the industry in which it operates. Forward-looking statements can be identified by the fact that they do not relate to historical or current facts and include guidance. Words such as ‘believe’, ‘expect’, ‘may’, ‘will’, ‘plan’, ‘strategy’, ‘transition plan’, ‘prospect’, ‘foresee’, ‘estimate’, ‘project’, ‘anticipate’, ‘can’, ‘intend’, ‘target’ and other words and terms of similar meaning in connection with any discussion of future operating, financial or sustainability performance identify forward-looking statements. Examples of such forward-looking statements include, but are not limited to: •Statements of targets, future guidance, (transition) plans, objectives or goals for future operations, including those related to operating, financial and sustainability matters, Novo Nordisk’s products, product research, product development, product introductions and product approvals as well as cooperation in relation thereto; •Statements containing projections of or targets for revenues, costs, income (or loss), earnings per share, capital expenditures, dividends, capital structure, net financials and other financial measures; •Statements regarding future economic performance, future actions and outcome of contingencies, such as legal proceedings; and •Statements regarding the assumptions underlying or relating to such statements. | ||||||||||||||||||||||
| Expectations are as reported, if not otherwise stated | Expectations 5 February 2025 | These statements are based on current plans, estimates, opinions, views and projections. Although Novo Nordisk believes that the expectation reflected in such forward-looking statements are reasonable, there can be no assurance that such expectation will prove to be correct. By their very nature, forward-looking statements involve risks, uncertainties and assumptions, both general and specific, and actual results may differ materially from those contemplated, expressed or implied by any forward-looking statement. Factors that may affect future results include, but are not limited to, global as well as local political, economic and environmental conditions, such as interest rate and currency exchange rate fluctuations or climate change, delay or failure of projects related to research and/or development, unplanned loss of patents, interruptions of supplies and production, including as a result of interruptions or delays affecting supply chains on which Novo Nordisk relies, shortages of supplies, including energy supplies, product recalls, unexpected contract breaches or terminations, government-mandated or market-driven price decreases for Novo Nordisk’s products, introduction of competing products, reliance on information technology including the risk of cybersecurity breaches, Novo Nordisk’s ability to successfully market current and new products, exposure to product liability and legal proceedings and investigations, changes in | |||||||||||||||
| Sales growth | |||||||||||||||||
| at CER | 16% to 24% | ||||||||||||||||
| as reported | Around 3 percentage points higher than at CER | ||||||||||||||||
| Operating profit growth | |||||||||||||||||
| at CER | 19% and 27% | ||||||||||||||||
| as reported | Around 5 percentage points higher than at CER | ||||||||||||||||
| Financial items (net) | Loss of around 9 bDKK | ||||||||||||||||
| Effective tax rate | 21% to 23% | ||||||||||||||||
| Capital expenditure (PP&E) | Around 65 bDKK | ||||||||||||||||
| Depreciation, amortisation and impairment losses | Around DKK 17 billion | ||||||||||||||||
| Free cash flow (excluding impact from business development) | Between 75 and 85 bDKK | ||||||||||||||||
| Annual review / Strategic Aspirations / Financials | | |||||||||
governmental laws and related interpretation thereof, including on reimbursement, intellectual property protection and regulatory controls on testing, approval, manufacturing and marketing, and taxation changes, including changes in tariffs and duties, perceived or actual failure to adhere to ethical marketing practices, investments in and divestitures of domestic and foreign companies, unexpected growth in costs and expenses, strikes and other labour market disputes, failure to recruit and retain the right employees, failure to maintain a culture of compliance, epidemics, pandemics or other public health crises, effects of domestic or international crises, civil unrest, war or other conflict and factors related to the foregoing matters and other factors not specifically identified herein. For an overview of some, but not all, of the risks that could adversely affect Novo Nordisk’s results or the accuracy of forward-looking statements in this Annual Report 2024, reference is made to the overview of risk factors in ‘Risks’ of this Annual Report 2024. | None of Novo Nordisk or its subsidiaries or any such person’s officers, or employees accept any responsibility for the future accuracy of the opinions and forward-looking statements expressed in the Annual Report 2024, Form 20-F, any quarterly financial reports, and written information released, shown, or oral statements made, to the public in the future by or on behalf of Novo Nordisk or the actual occurrence of the forecasted developments. Unless required by law, Novo Nordisk has no duty and undertakes no obligation to update or revise any forward-looking statement, whether as a result of new information, future events, or otherwise. Shares and capital structure Through open and proactive communication, Novo Nordisk aims to provide the basis for fair and efficient pricing of our shares. Share capital and ownership Novo Nordisk’s share capital of DKK 446.5 million is divided into A and B share capital. The A and B shares are calculated in units of DKK 0.10, amounting to 4.5 billion shares. The A share capital, consisting of 1,075 million shares, has a nominal value of DKK 107,487,200 and the B share capital, consisting of 3,390 million shares, has a nominal value of DKK 339,012,800. Each A share carries 100 votes and each B share carries 10 votes. Novo Nordisk’s B shares are listed on Nasdaq Copenhagen and on the New York Stock Exchange (NYSE) as American Depository Receipts (ADRs). The general meeting has authorised the Board of Directors to distribute extraordinary dividends, issue new shares in accordance with the Articles of Association and repurchase shares in accordance with authorisations granted. | ||||||||||||||||||||||
Ownership structure2 2. Treasury shares are included; however, voting rights of treasury shares cannot be exercised. 3. Novo Holdings A/S’s registered address is Tuborg Havnevej 19, DK-2900 Hellerup, Denmark. | 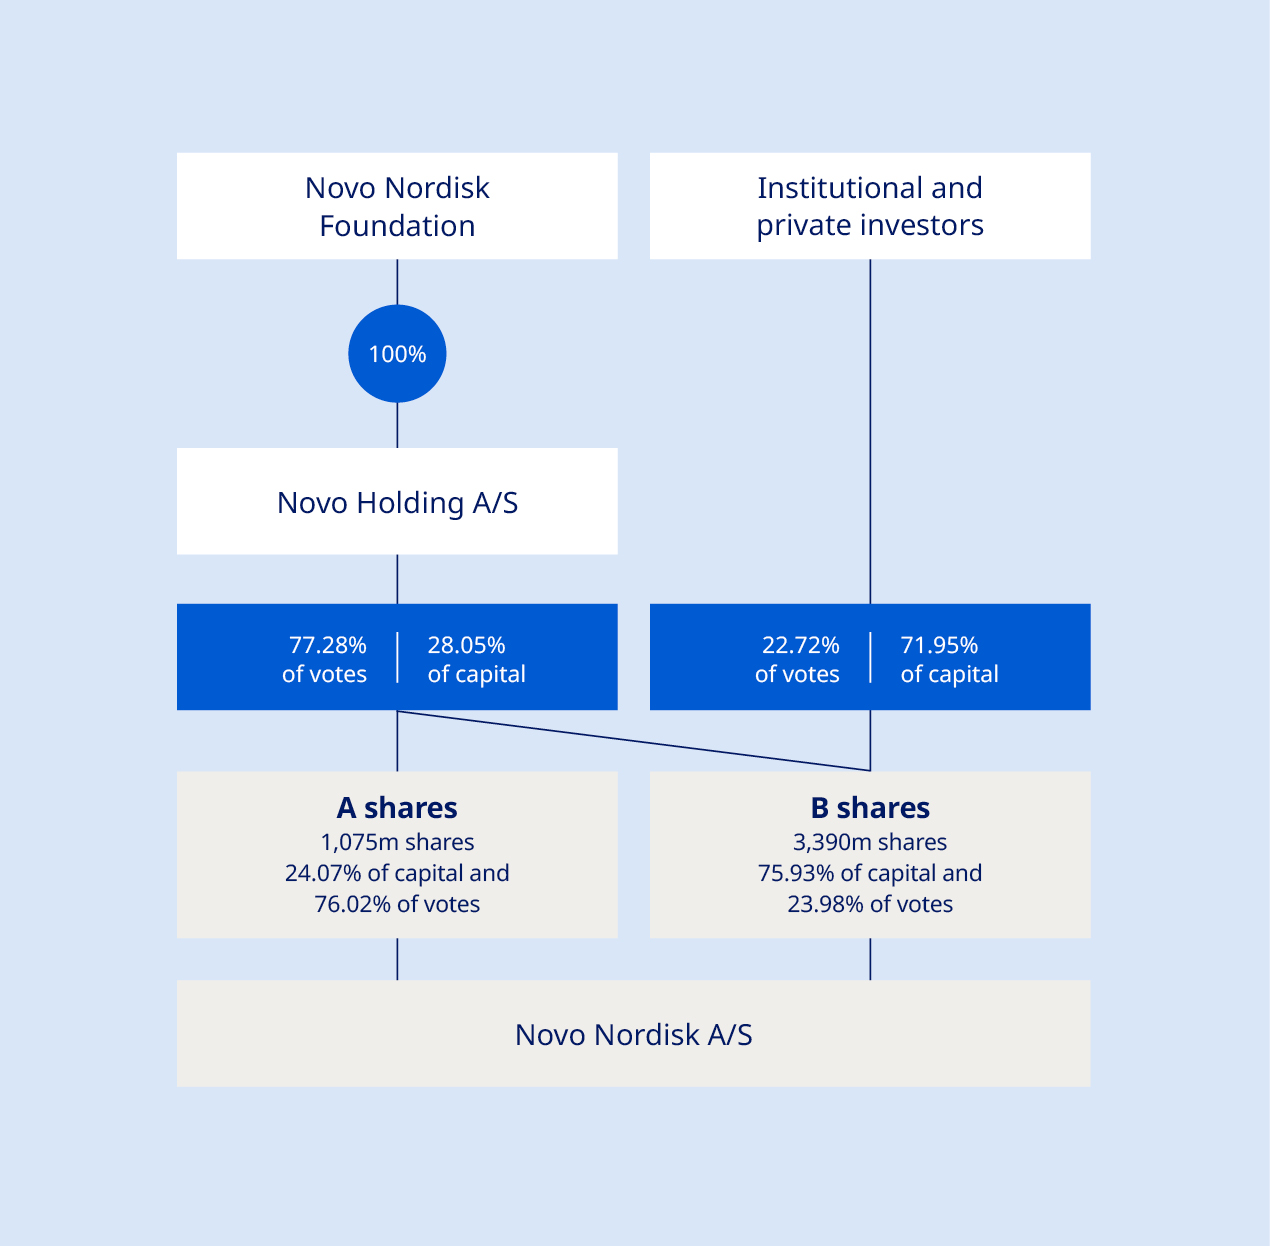 | ||||||||||||||||||||||
The company’s A shares are not listed and are held by Novo Holdings A/S3, a Danish public limited liability company wholly owned by the Novo Nordisk Foundation. According to the Articles of Association of the Foundation, the A shares cannot be divested. Special rights attached to A shares include pre-emptive subscription rights in the event of an increase in the A share capital and pre-emptive purchase rights in the event of a sale of A shares, while B shares take priority for liquidation proceedings. A shares take priority for dividends below 0.5%, and B shares take priority for dividends between 0.5 and 5%. However, in practice, A and B shares receive the same amount of dividend per share. | 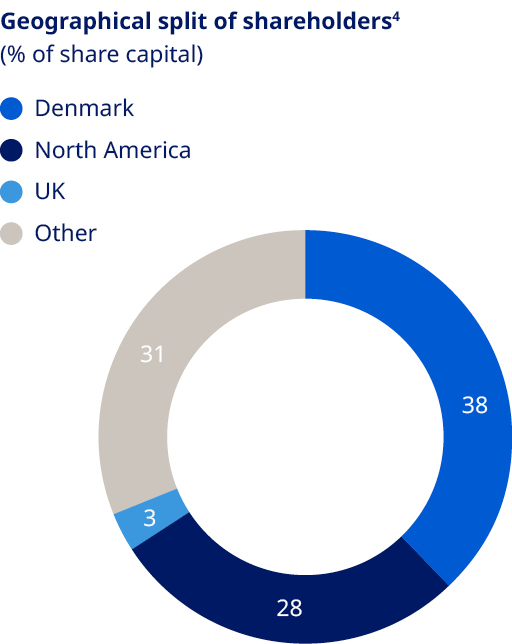 | 4. Split of shareholders is denoted according to the location of legal deposit-owners. | |||||||||||||||||||||
| Annual review / Strategic Aspirations / Financials | | |||||||||
As of 31 December 2024, Novo Holdings A/S held a B share capital of nominally DKK 17,756,050. Together with the A shares, Novo Holdings A/S’s total ownership amounted to nominally DKK 125,243,250. Novo Holdings A/S ownership is reflected in the ‘Ownership structure’ chart. There is no complete record of all shareholders; however, based on available sources of information, as of 31 December 2024 it is estimated that shares were geographically distributed as shown in the ‘Geographical split of shareholders’ chart. As of 31 December 2024, the free float of listed B shares was 94.06% (of which approximately 13.82% are listed as ADRs), excluding Novo Holdings A/S and Novo Nordisk’s holding of shares. As of 31 December 2024, Novo Holdings A/S and Novo Nordisk’s holding of B shares equalled 201,220,032 shares and had a nominal value of DKK 20,122,003. For details about the share capital, see note 4.3 to the Consolidated financial statements. Capital structure Novo Nordisk’s Board of Directors and Executive Management consider that the current capital and share structure of Novo Nordisk serve the interests of the shareholders and the company well. Novo Nordisk’s capital structure strategy offers a balance between long-term shareholder value creation and competitive shareholder return in the short term. In 2024, Novo Nordisk issued Eurobonds totaling EUR 4.65 billion. The total outstanding Eurobonds as of the end of 2024 amounted to 6.8 billion. Dividend policy The company’s dividend policy applies a pharmaceutical industry benchmark to ensure a competitive payout ratio for dividend payments, may be complemented by share repurchase programmes. The final dividend for 2023 paid in March 2024 was equal to DKK 6.40 per A and B share of DKK 0.10 as well as for ADRs. The total dividend for 2023 was DKK 9.40 per A and B share of DKK 0.10, corresponding to a payout ratio of 50.2%. The 2023 pharma peer group average was 53.0%. In August 2024, an interim dividend was paid equalling DKK 3.50 per A and B share of DKK 0.10 as well as for ADRs. For 2024, the Board of Directors will propose a final dividend of DKK 7.90 to be paid in March 2025, equivalent to a total dividend for 2024 of DKK 11.40 and a payout ratio of 50.2%. The company expects to distribute an interim dividend in August 2025. Further information regarding this interim dividend will be announced in connection with the financial report for the first six months of 2025. Dividends are paid from distributable reserves. Novo Nordisk does not pay a dividend on its holding of treasury shares. | Share repurchase programme for 2024/2025 During the twelve-month period beginning 6 February 2024, Novo Nordisk repurchased shares worth DKK 20 billion. The share repurchase programme has primarily been conducted in accordance with the safe harbour rules in the EU Market Abuse Regulation (MAR). Novo Nordisk’s capital allocation priorities focus on internal growth investments, including supply chain expansions, dividends as well as external growth opportunities, including acquiring the three Catalent manufacturing sites. Consequently, Novo Nordisk is not expecting to initiate a share buyback programme in 2025. Share price development Since end of December 2023 until end of December 2024, Novo Nordisk’s share price decreased from DKK 698 to DKK 624, a decrease of 10.6%. The total market value of Novo Nordisk’s B shares, excluding treasury shares and Novo Holdings A/S shares, was DKK 1,990,516,353,626 as of 30 December 2024. | ||||||||||||||||||||||
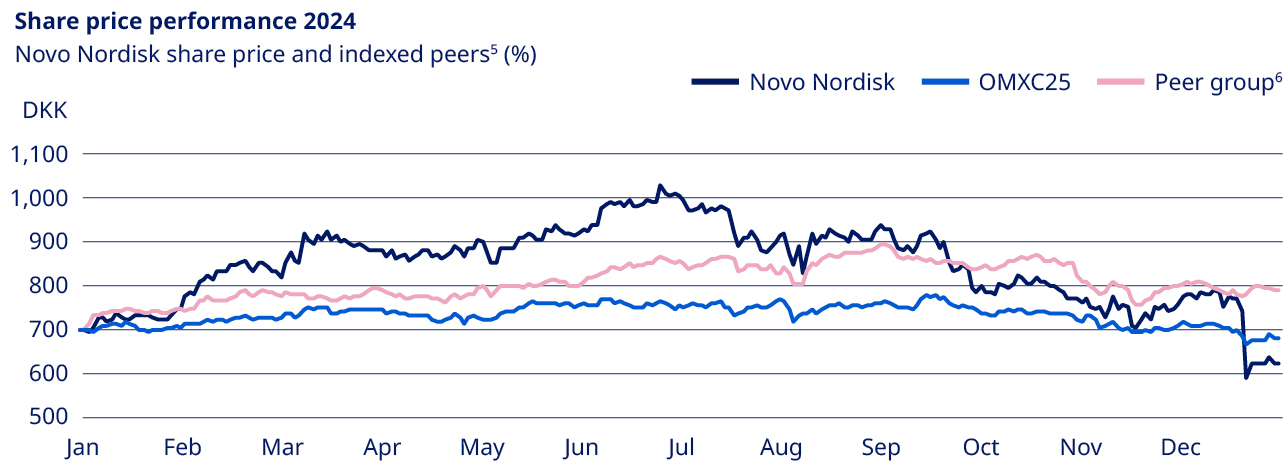 | |||||||||||||||||||||||
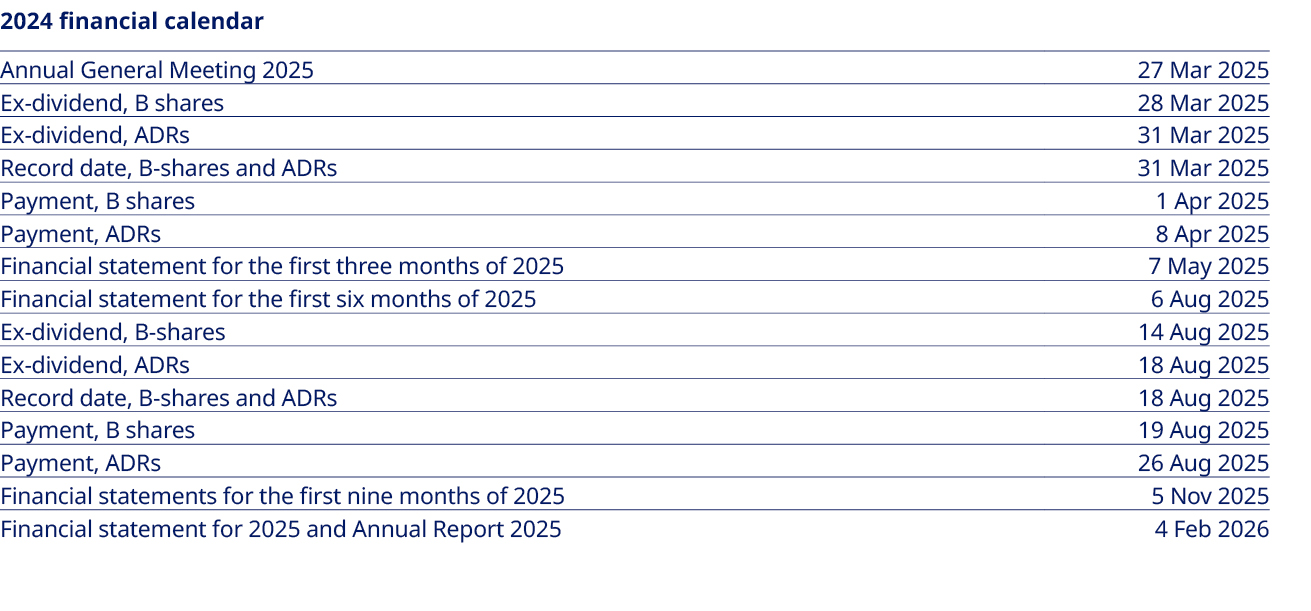 | 5. OMXC25 and pharmaceutical industry development have been rebased to Novo Nordisk share price in January 2024. 6. AstraZeneca, Bristol-Meyers, Eli Lilly, GlaxoSmithKline, Lundbeck, Merck, Novartis, Pfizer, Roche and Sanofi. | ||||||||||||||||||||||

| Annual review / Strategic Aspirations / Risk management | | |||||||||
Risk management Rigorous and systematic risk management is essential. The current risk landscape is impacted by elevated geopolitical uncertainties and market dynamics in the segments in which we operate. We apply a dual-lensed approach to risk management. This means that we aim to identify and mitigate both operational risks that pose a threat to our short- to medium-term plans, and strategic risks that could reduce our ability to realise our corporate strategy over the long term. Addressing risks in our strategic planning Scenario and risk-thinking exercises are part of our strategic planning. These exercises involve analysing market trends and considering the effects of socioeconomic, environmental, geopolitical and political changes that could pose risks to, or create opportunities for, our business. Annually, Executive Management and the Board of Directors review and discuss a strategic risk profile. Further, strategic risks and the conclusions from our double materiality assessment in the Sustainability statement are compared to better integrate sustainability risks in our risk outlooks and strategic direction. The main strategic risks are: Innovation and competition Novo Nordisk faces a concentration risk with multiple brands being dependent on the semaglutide compound as the active pharmaceutical ingredient. To remain competitive in the long term and thereby mitigate the innovation risk, we invest in internal and external pipeline opportunities as well as effectively attracting talent to continue providing patients with innovative treatments. Production capacity and supply chain risks Demand fluctuations, resource shortages, geopolitical instability, trade disputes and local manufacturing requirements are all factors that can pressure global supply chains. Furthermore, expanding production capacity is complex and associated with a long lead times. Therefore, planning and management of our production capacity and supply chain are key to mitigate this risk. Access and affordability Access to affordable care is a global issue as healthcare systems struggle to provide quality care at a sustainable cost, while the burden of chronic diseases keeps rising. Ensuring access and affordability is a risk and responsibility Novo Nordisk shares with all stakeholders involved in healthcare. We continue to scale our capacity to meet patient demand and thereby broaden access to medicines and to meet our social responsibilities. Healthcare reform Some governments are adopting changes to their pharmaceutical frameworks that introduce further complexity in healthcare systems and uncertainties in the regulatory environment. This may lead to additional price pressure, potentially impacting our profitability. We continuously educate healthcare providers about the value and benefits of our products as well as engage in a dialogue with policymakers and stakeholders, communicating potential consequences of healthcare reform to the innovative life science environment. | Digital disruption New digital technologies could provide an opportunity to deliver more value to our stakeholders and help patients live a life with fewer limitations. We recognise that there is also a risk of digital disruption leading to increased competition through accelerated and enhanced drug discovery and development. To ensure we remain competitive, we continuously innovate and integrate these technologies into our processes. Environmental impact Novo Nordisk's current expansion efforts, including scaling of production capacity, significantly increases our current and projected greenhouse gas emissions. We are addressing this challenge through our Circular for Zero strategy. This includes an increased focus on our global emissions, also encompassing scope 3 emissions, as well as assessing, monitoring and mitigating environmental risks across the value chain. Geopolitical uncertainty Ongoing conflicts, geopolitical tensions and social unrest represent a volatile landscape which has led to governments introducing trade restrictions and tariffs. If escalating tensions persist, there is a risk that further tariffs may be imposed. Most notably, the new US administration considers to impose a range of trade actions on all articles imported into the US. We navigate this elevated degree of geopolitical uncertainty by monitoring geopolitical developments, actively engaging in policy making and diversifying our supply chain. Ethics and compliance Our commitment to ethics and compliance remains at the forefront of all our operations. Any inability to uphold our ethical standards could lead to reputational implications, with potential effects on market access and pricing negotiations. Our values, encapsulated in the Novo Nordisk Way, guide every decision we make. OneCode, our code of conduct, further empowers us to conduct our operations responsibly. These guidelines help us to maintain integrity, thereby enabling us to fulfil our purpose effectively. Operational risk management process In the short- to medium-term, we are exposed to risks throughout our value chain. Some risks are inherent in the pharmaceutical industry, such as delays or failures of potential late-stage medicines in the R&D pipeline. Other risks, such as geopolitical instability, supply disruptions and competition, are common amongst manufacturing companies with global production. We will not compromise on product quality, patient safety and business ethics: these are front and centre of our enterprise-wide risk management set-up. We assess risks with regard to their corresponding likelihood of financial loss or reputational damage. Executive Management, the Board of Directors and the Audit Committee review a risk grid of our biggest operational risks every three months. This grid is based on insights from management teams across the organisation and includes all types of risks that could cause significant disruptions to the business over a three-year horizon, including potential environmental, social and governance risks. An overview of our key operational risks, along with detailed descriptions, is provided on the next page. For more information, see our Corporate Governance Report available at: www.novonordisk.com/about/corporate-governance.html. | |||||||||||||
| Annual review / Strategic Aspirations / Key operational risks | | |||||||||
| Risk area | Description | Impact | Mitigating actions | 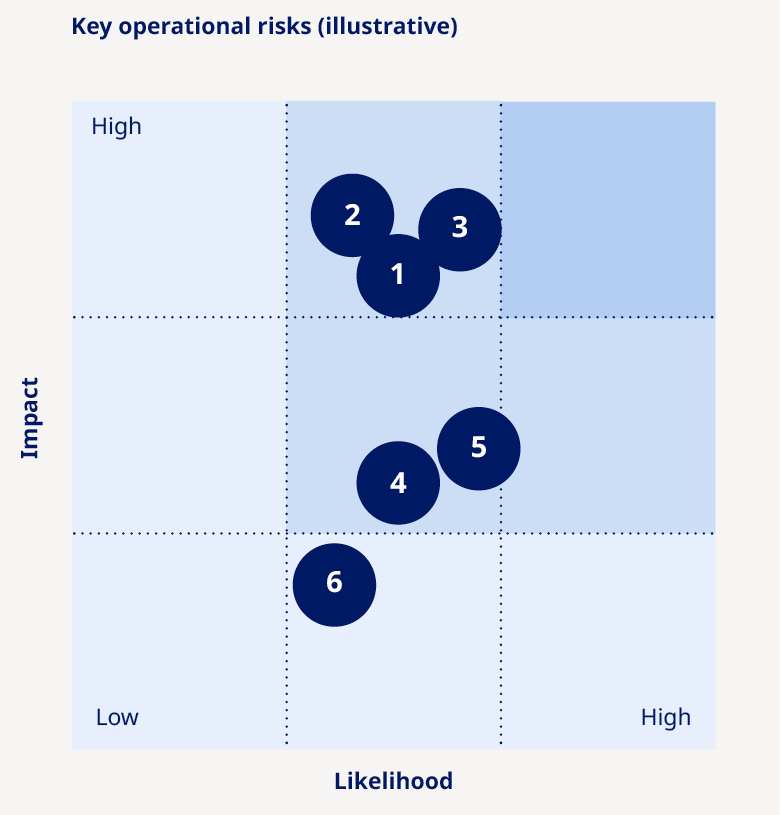 | |||||||||||||||||||
 Research and clinical pipeline risks1 | Findings in clinical activities, regulatory processes or misjudging of commercial potential, leading to delays or failure of products in the pipeline. | •Patients would not be provided with innovative treatment options. • Could have an adverse impact on sales, profits and market position. | •Pre-clinical and clinical activities to demonstrate safety and efficacy. • Consultations with regulators to review pre-clinical and clinical findings and obtain guidance on development path. | ||||||||||||||||||||
 Product supply, quality and safety risks | Higher-than-expected demand or disruption of product supply due to, e.g. geopolitical instability or quality issues, may compromise product availability, ultimately impacting patients and representing a lost commercial opportunity. In addition, there could be risks related to safety and product liability. | •Product shortages could have potential implications for patients. • Could jeopardise reputation and license to operate if regulatory compliance is not ensured. • Compromised patient safety and exposure to product liability legal proceedings. • Could diminish trust in Novo Nordisk, impacting our reputation. • Could have an adverse impact on sales, profits and market position. | •Significantly expanding global production with multiple facilities and safety stock to reduce supply risk. • Planning and management of supply chain. • Regular quality audits of internal units and suppliers to document Good Manufacturing Practice (GMP) compliance. • Identification and correction of root causes when issues are identified. If necessary, products are recalled. | ||||||||||||||||||||
 Commercialisation risks1 | Competitive pressures, as well as market dynamics and geopolitical, macroeconomic or healthcare crises (e.g. pandemics) leading to reduced payer ability and willingness to pay. | •Market dynamics could impact price levels and patient access. • Could have an adverse impact on sales, profits and market position. | •Innovation of novel products, clinical trial data and real-world evidence demonstrate added value of new products. • Payer negotiations to ensure improved patient access. • Increased and new access and affordability initiatives. | ||||||||||||||||||||
 IT security risks | Disruption to IT systems, such as cyber-attacks or infrastructure failure, resulting in business disruption or breach of data confidentiality. | •Could limit our ability to produce and safeguard product quality. • Could compromise patients’ or other individuals’ privacy. • Could limit our ability to maintain operations or limit future business opportunities if proprietary information is lost. • Could have an adverse impact on sales, profits and market position. | •Proactive company-wide information security awareness initiatives. • Continuity plans for non-availability of IT systems. • Company-wide internal audit of IT security controls. • Detection and protection mechanisms in IT systems and business processes. | ||||||||||||||||||||
 Financial risks | Exchange rate fluctuations (mainly in USD, CNY, JPY, CAD and BRL), geopolitical risks (e.g. tariffs), disputes with tax authorities and changes to tax legislation and interpretation. | •Could lead to tax adjustments, fines and higher-than-expected tax level. • Could have an adverse impact on sales and profits. • Geopolitical actions could lead to an increase in corporate taxes and duties. | •Hedging for selected currencies. • Integrated treasury management. • Applicable taxes paid in jurisdictions where business activity generates profits and multi-year Advance Pricing Agreements with tax authorities. | ||||||||||||||||||||
 Legal, patents and compliance risks1 | Breach of legislation, industry codes or company policies. Competitors asserting patents against Novo Nordisk or challenging patents critical for protection of commercial product and pipeline candidates. | •Potential exposure to investigations, criminal and civil sanctions and other penalties. • Could compromise our reputation and the rights and integrity of individuals involved. • Could lead to unexpected loss of exclusivity for, or injunctions against, existing and pipeline products. • Could have an adverse impact on sales, profits and market position. | •Code of Conduct integrated in our business. • Compliance Hotline in place. • Legal review of key activities and internal audit of compliance with business ethics standards. • Internal controls to minimise vulnerability to patent infringement and invalidity actions. | ||||||||||||||||||||
| 1. Risk is also captured as part of the double materiality assessment conclusions in the Sustainability statement; read more on page 52. | |||||||||||||||||||||||
| Annual review / Strategic Aspirations / Financials | | |||||||||
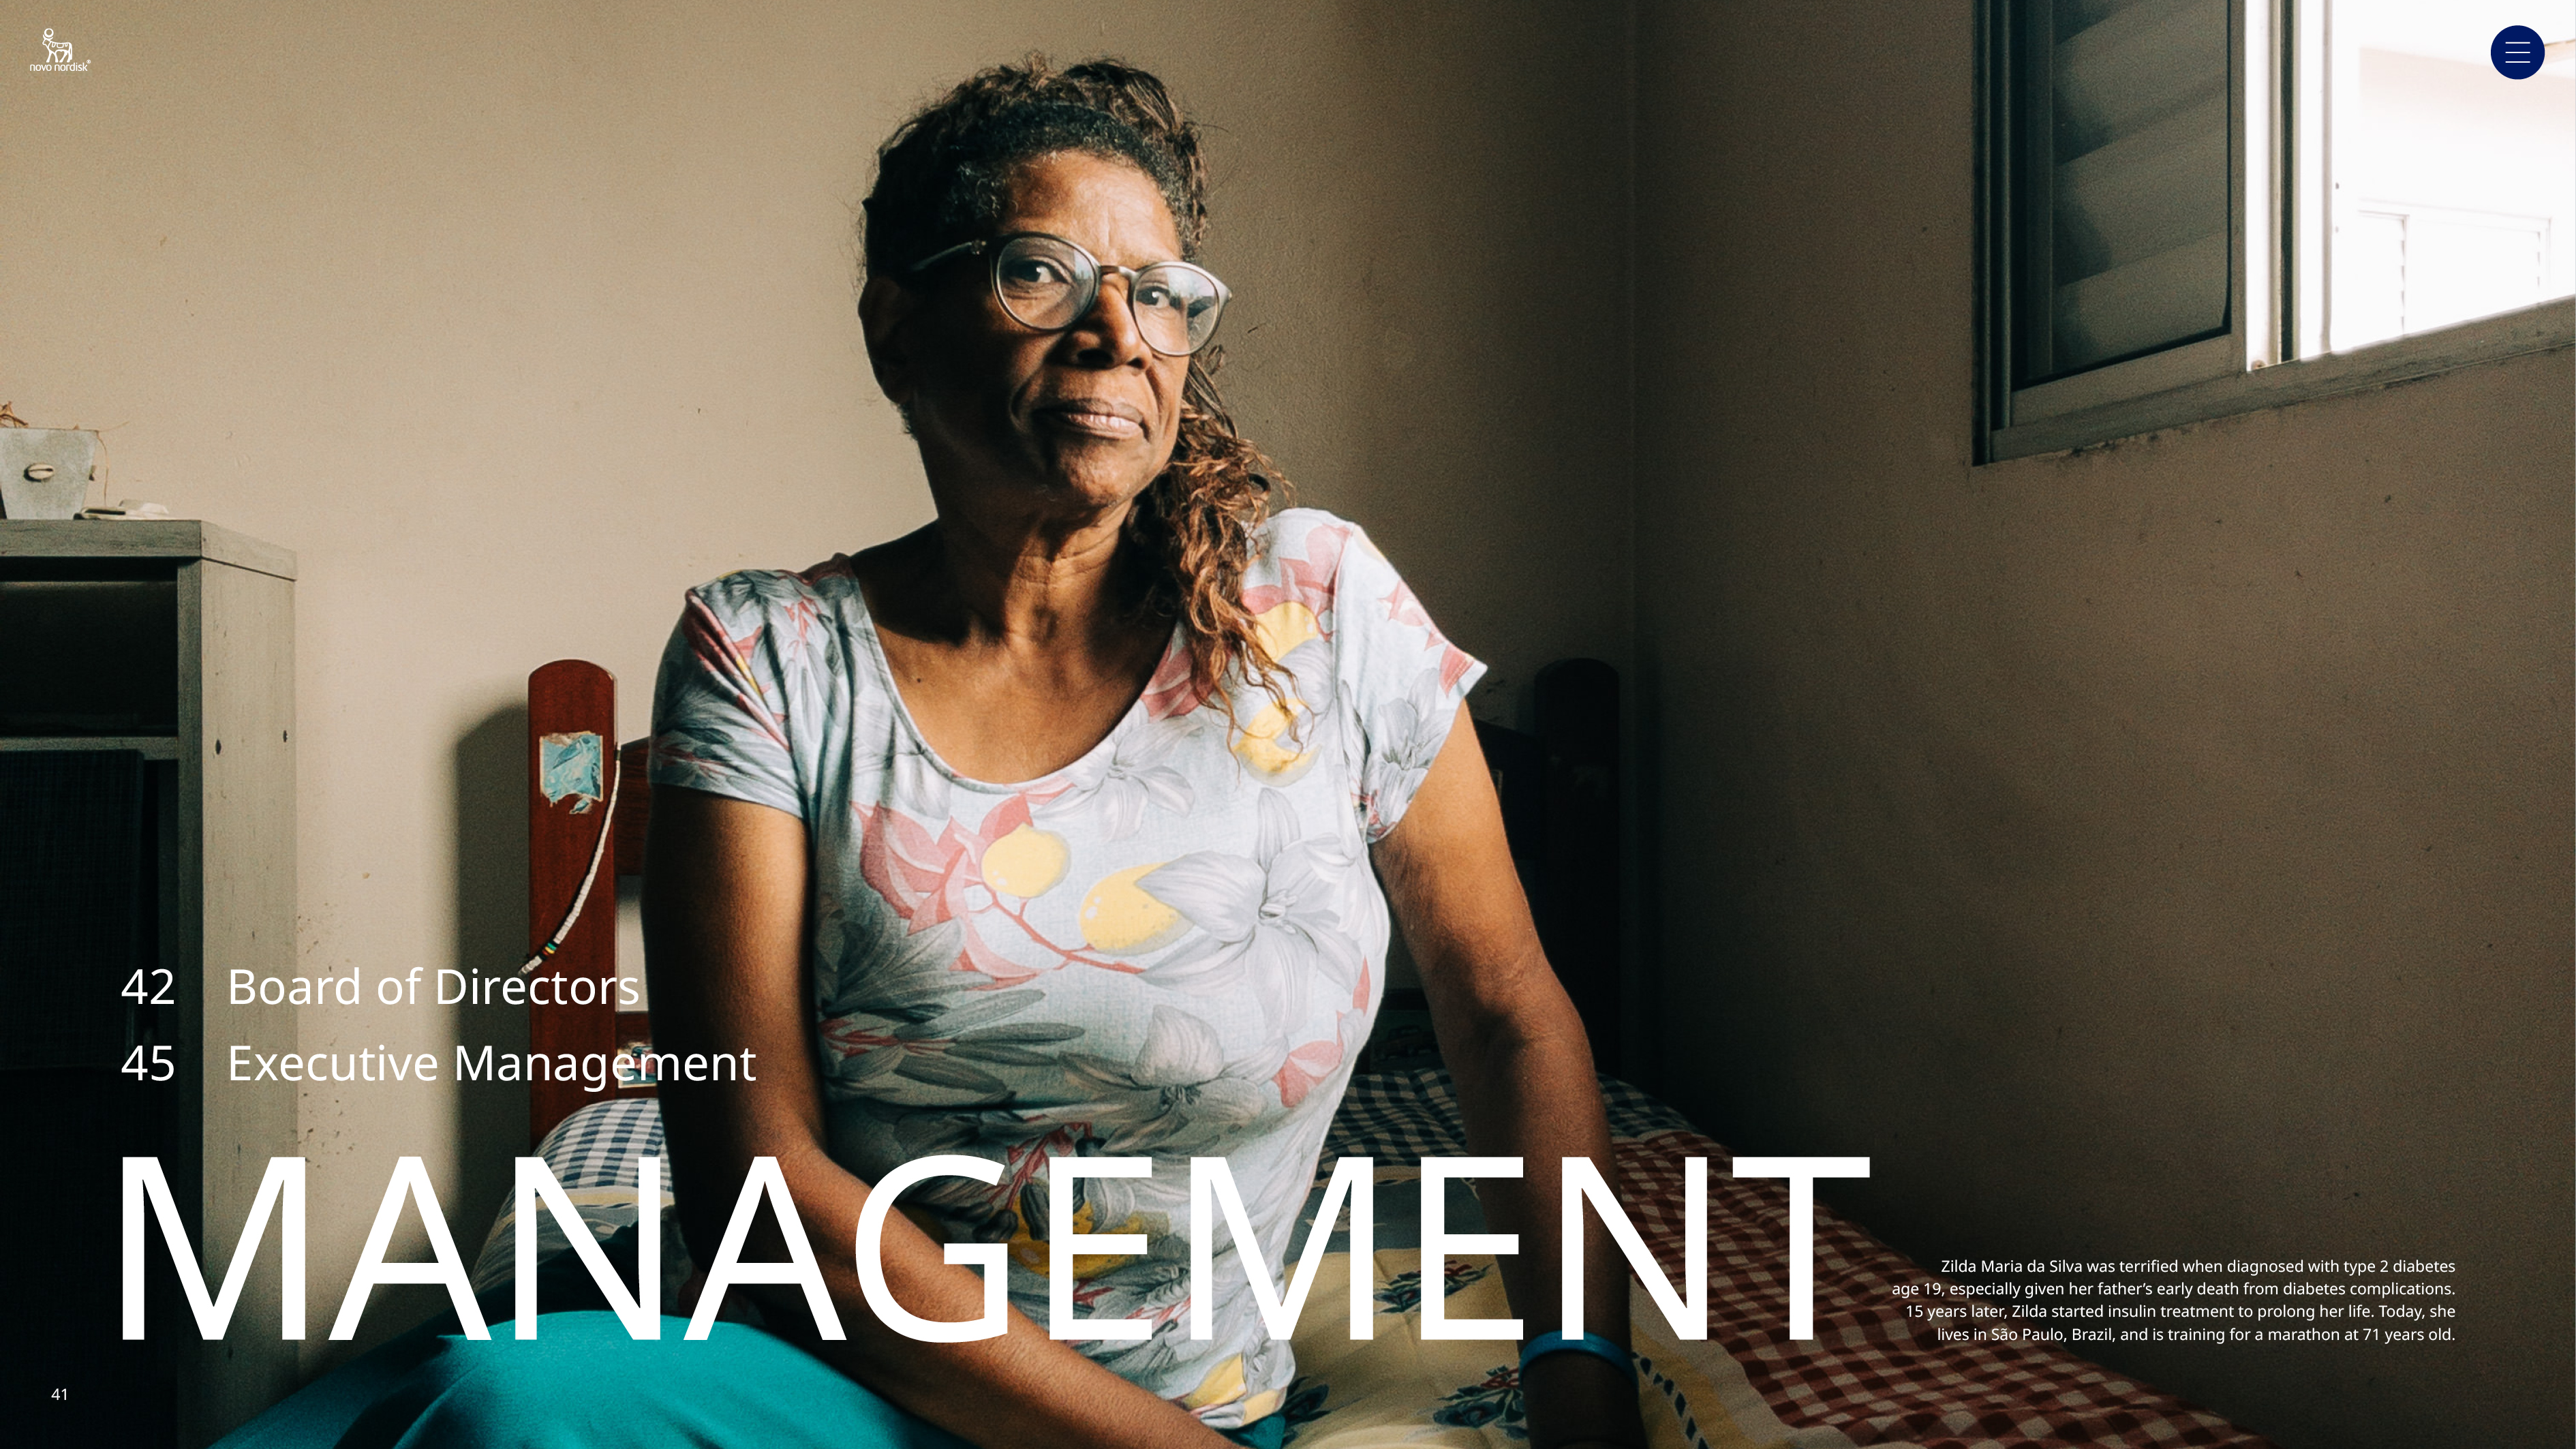
| Annual review / Management / Board of Directors | | |||||||||
| Board of Directors | ||||||||||||||||||||||||||||||||||||||||||||||||||||||||
 | Helge Lund Chair | 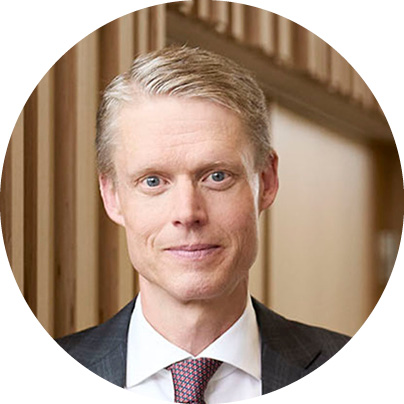 | Henrik Poulsen Vice chair |  | Elisabeth Dahl Christensen |  | Laurence Debroux |  | Andreas Fibig |  | Sylvie Grégoire | |||||||||||||||||||||||||||||||||||||||||||||
Norwegian. Born October 1962. Male. Member since 20171. Term 2025. Chair of the People and Governance Committee and the Chair Committee. Positions and management duties Chair of the board of directors and chair of the people, culture and governance committee of BP p.l.c. Chair of the board of directors of Inkerman AS. Chair of the board of directors of Stiftelsen Værekraft. Member of the board of directors and member of the remuneration committee of Belron SA. Member of the board of directors of P/F Tjaldur. Member of the board of trustees of the International Crisis Group. Operating advisor to Clayton Dubilier & Rice. Competences Global corporate leadership; healthcare and pharma industry; finance and accounting; business development, M&A and external innovation sourcing; human capital management; environmental, social and governance (ESG). | Danish. Born September 1967. Male. Member since 2021. Term 2025. Chair of the Remuneration Committee and member of the Audit Committee and the Chair Committee. Positions and management duties Chair of the supervisory board, chair of the people & culture committee and member of the remuneration committee of Carlsberg A/S. Chair of the board of directors and chair of the nomination & remuneration committee of Faerch A/S. Member of the board of directors of Novo Holdings A/S. Member of the supervisory board of Bertelsmann SE & Co. KGaA. Senior advisor to A.P. Møller Holding A/S. Competences Global corporate leadership; finance and accounting; business development, M&A and external innovation sourcing; human capital management; environmental, social and governance (ESG). | Danish. Born November 1965. Female. Member since 2022. Term 2026. Employee representative. Member of the Remuneration Committee. Positions and management duties Full-time union representative at Novo Nordisk A/S. Competences Not mapped for employee representatives. | French. Born July 1969. Female. Member since 2019. Term 2025. Chair of the Audit Committee and member of the Remuneration Committee. Positions and management duties Member of the board of directors, chair of the audit committee and member of the ESG committee of Exor N.V. Member of the supervisory board and chair of the audit committee of Randstad N.V. Member of the board of directors of Institut Mérieux, HEC Paris Business School and Kite Insights Limited (the Climate School). Competences Global corporate leadership; healthcare and pharma industry; finance and accounting; business development, M&A and external innovation sourcing; human capital management; environmental, social and governance (ESG). | German. Born February 1962. Male. Member since 2018. Term 2025. Member of the Research & Development Committee. Positions and management duties Member of the board of directors of Indigo Agriculture Inc., Evodiabio ApS and ExlService Holdings, Inc. Honorary director of the German American Chamber of Commerce. Competences Global corporate leadership; healthcare and pharma industry; technology, data and digital; finance and accounting; business development, M&A and external innovation sourcing; human capital management; environmental, social and governance (ESG). | Canadian and American. Born November 1961. Female. Member since 2015. Term 2025. Member of the Audit Committee, the Research & Development Committee and the People and Governance Committee. Positions and management duties Co-founder and member of the board of directors of CervoMed, Inc. Chair of the board of directors of Abivax SA. Member of the board of directors of F2G Ltd. Advisor to the Soffinova Telethon Fund. Competences Global corporate leadership; healthcare and pharma industry; medicine and science; finance and accounting; business development, M&A and external innovation sourcing; human capital management. | |||||||||||||||||||||||||||||||||||||||||||||||||||
| 1. Helge Lund was also a member of the Board of Directors for one one-year term from 2014-2015. | ||||||||||||||||||||||||||||||||||||||||||||||||||||||||
| Annual review / Management / Board of Directors | | |||||||||
| Board of Directors (continued) | ||||||||||||||||||||||||||||||||||||||||||||||||||||||||
 | Liselotte Hyveled |  | Mette Bøjer Jensen |  | Kasim Kutay |  | Christina Law |  | Martin Mackay |  | Thomas Rantzau | |||||||||||||||||||||||||||||||||||||||||||||
Danish. Born January 1966. Female. Member since 20222. Term 2026. Employee representative. Member of the Research & Development Committee. Positions and management duties Chief patient officer and principal vice president of Patient Voice Strategy & Alliances, Novo Nordisk A/S. Member of the board of directors of TriSalus Life Sciences. Competences Not mapped for employee representatives. | Danish. Born December 1975. Female. Member since 2018. Term 2026. Employee representative. Member of the Audit Committee. Positions and management duties Wash & Sterilisation specialist in Product Supply, Novo Nordisk A/S. Competences Not mapped for employee representatives. | British. Born May 1965. Male. Member since 2017. Term 2025. Member of the People and Governance Committee and the Research & Development Committee. Positions and management duties CEO of Novo Holdings A/S. Member of the board of directors and member of the nomination and remuneration committee of Novonesis A/S. Competences Global corporate leadership; healthcare and pharma industry; finance and accounting; business development, M&A and external innovation sourcing; human capital management. | Chinese. Born January 1967. Female. Member since 2022. Term 2025. Member of the Audit Committee. Positions and management duties Group CEO of Raintree Group of Companies. Member of the board of directors of Raintree Group Limited, Raintree Investment Pte Ltd. and Air Liquide S.A. Member of the board of directors of La Fondation des Champions. Member of the board of directors and chair of the development committee of National Gallery Singapore. Competences Global corporate leadership; technology, data and digital; business development, M&A and external innovation sourcing; human capital management. | American and British. Born April 1956. Male. Member since 2018. Term 2025. Chair of the Research & Development Committee and member of the Remuneration Committee. Positions and management duties Co-founder and non-executive chair of the board of directors of Rallybio LLC. Member of the board of directors and member of the science and technology committee and the responsible animal use committee of Charles River Laboratories International, Inc. Member of the board of directors and member of the compensation committee and research and development committee of SpringWorks Therapeutics, Inc. Scientific advisor at Pivotal BioVenture Partners. Member of the external advisory board of Boston Children’s Hospital. Competences Global corporate leadership; healthcare and pharma industry; medicine and science; technology, data and digital; business development, M&A and external innovation sourcing; human capital management. | Danish. Born March 1972. Male. Member since 2018. Term 2026. Employee representative. Member of the People and Governance Committee. Positions and management duties Lead auditor, Internal Audits, Novo Nordisk A/S. Competences Not mapped for employee representatives. | |||||||||||||||||||||||||||||||||||||||||||||||||||
| 2. Liselotte Hyveled was also an employee-elected member of the Board of Directors for one four-year term from 2014-2018. | ||||||||||||||||||||||||||||||||||||||||||||||||||||||||
| Annual review / Management / Board of Directors | | |||||||||
| Independence and meeting attendance overview | |||||||||||||||||||||||||||||
Meeting attendance in 20243 | |||||||||||||||||||||||||||||
| Name | Independence4 | Board of Directors | Chair Committee | Audit Committee10 | People and Governance Committee | Remuneration Committee | R&D Committee | ||||||||||||||||||||||
| Helge Lund | Independent | 9/9 | 8/8 | 3/3 | |||||||||||||||||||||||||
| Henrik Poulsen | Not independent5, 6, 7, 8 | 9/9 | 8/8 | 5/5 | 6/6 | ||||||||||||||||||||||||
| Elisabeth Dahl Christensen | Not independent9 | 9/9 | 5/6 | ||||||||||||||||||||||||||
| Laurence Debroux | Independent6, 7, 8 | 9/9 | 5/5 | 6/6 | |||||||||||||||||||||||||
| Andreas Fibig | Independent | 8/9 | 5/6 | ||||||||||||||||||||||||||
| Sylvie Grégoire | Independent6 | 9/9 | 5/5 | 3/3 | 6/6 | ||||||||||||||||||||||||
| Liselotte Hyveled | Not independent9 | 8/9 | 6/6 | ||||||||||||||||||||||||||
| Mette Bøjer Jensen | Not independent6, 9 | 9/9 | 5/5 | ||||||||||||||||||||||||||
| Kasim Kutay | Not independent5 | 8/911 | 3/3 | 5/6 | |||||||||||||||||||||||||
| Christina Law | Independent6 | 9/9 | 5/5 | ||||||||||||||||||||||||||
| Martin Mackay | Independent | 9/9 | 6/6 | 6/6 | |||||||||||||||||||||||||
| Thomas Rantzau | Not independent9 | 9/9 | 3/3 | ||||||||||||||||||||||||||
| 3. Number of meetings attended by each Board member out of the total number of meetings within the member’s term. 4. In accordance with recommendation 3.2.1 of the Danish Corporate Governance Recommendations. 5. Member of the board of directors or executive management of Novo Holdings A/S. 6. Pursuant to the US Securities Exchange Act, Laurence Debroux, Sylvie Grégoire and Christina Law qualify as independent Audit Committee members, while Mette Bøjer Jensen and Henrik Poulsen rely on an exemption from the independence requirements. 7. Laurence Debroux and Henrik Poulsen possess the qualifications within accounting and auditing required under part 8 of the Danish Act on Approved Auditors and Audit Firms. 8. Designated as financial experts as defined by the US Securities and Exchange Commission (SEC). 9. Elected by employees of Novo Nordisk. 10. Collectively, the members have relevant industry expertise. 11. Kasim Kutay was recused from an extraordinary meeting of the Board of Directors due to a conflict of interest. | |||||||||||||||||||||||||||||
| Annual review / Management / Executive Management | | |||||||||
| Executive Management | |||||||||||||||||||||||||||||||||||||||||||||||
 | Lars Fruergaard Jørgensen1 |  | Maziar Mike Doustdar |  | Ludovic Helfgott |  | Karsten Munk Knudsen1 |  | Martin Holst Lange | ||||||||||||||||||||||||||||||||||||||
President and Chief Executive Officer (CEO). Born November 1966. Male. Other positions and management duties President of the European Federation of Pharmaceutical Industries and Associations (EFPIA). Member of the board of directors at Danmarks Nationalbank (the Danish central bank). | Executive Vice President. International Operations. Born August 1970. Male. Other positions and management duties Member of the board of directors and the personnel and remuneration committee of Orion Corporation. | Executive Vice President. Rare Disease. Born July 1974. Male. Other positions and management duties President of the Novo Nordisk Haemophilia Foundation Council. | Executive Vice President. Chief Financial Officer (CFO). Born December 1971. Male. Other positions and management duties Member of the board of directors and chair of the audit committee of Hempel A/S. Member of the board of directors, chair of the audit & ESG committee of 3Shape Holding A/S. | Executive Vice President. Development. Born October 1970. Male. Other positions and management duties Member of the board of directors of Pharmacosmos A/S. | |||||||||||||||||||||||||||||||||||||||||||
 | David Moore |  | Tania Sabroe |  | Marcus Schindler |  | Camilla Sylvest |  | Henrik Wulff | ||||||||||||||||||||||||||||||||||||||
Executive Vice President. US Operations & Business Development. Born January 1974. Male. Other positions and management duties Member of the board of directors of Novasenta Inc. | Executive Vice President. Global People & Organisation. Born July 1977. Female. Other positions and management duties No other management positions. | Executive Vice President. Research & Early Development and Chief Scientific Officer (CSO). Born September 1966. Male. Other positions and management duties Adjunct Professor of Pharmacology at the University of Gothenburg. | Executive Vice President. Commercial Strategy & Corporate Affairs. Born November 1972. Female. Other positions and management duties Member of the board of directors of Danish Crown A/S and Argenx SE. | Executive Vice President. Product Supply, Quality & IT. Born November 1970. Male. Other positions and management duties Member of the board of directors of Grundfos Holding A/S. | |||||||||||||||||||||||||||||||||||||||||||
| 1. Lars Fruergaard Jørgensen and Karsten Munk Knudsen are registered as executives with the Danish Business Authority. The other members of Executive Management are not registered as executives with the Danish Business Authority. | |||||||||||||||||||||||||||||||||||||||||||||||
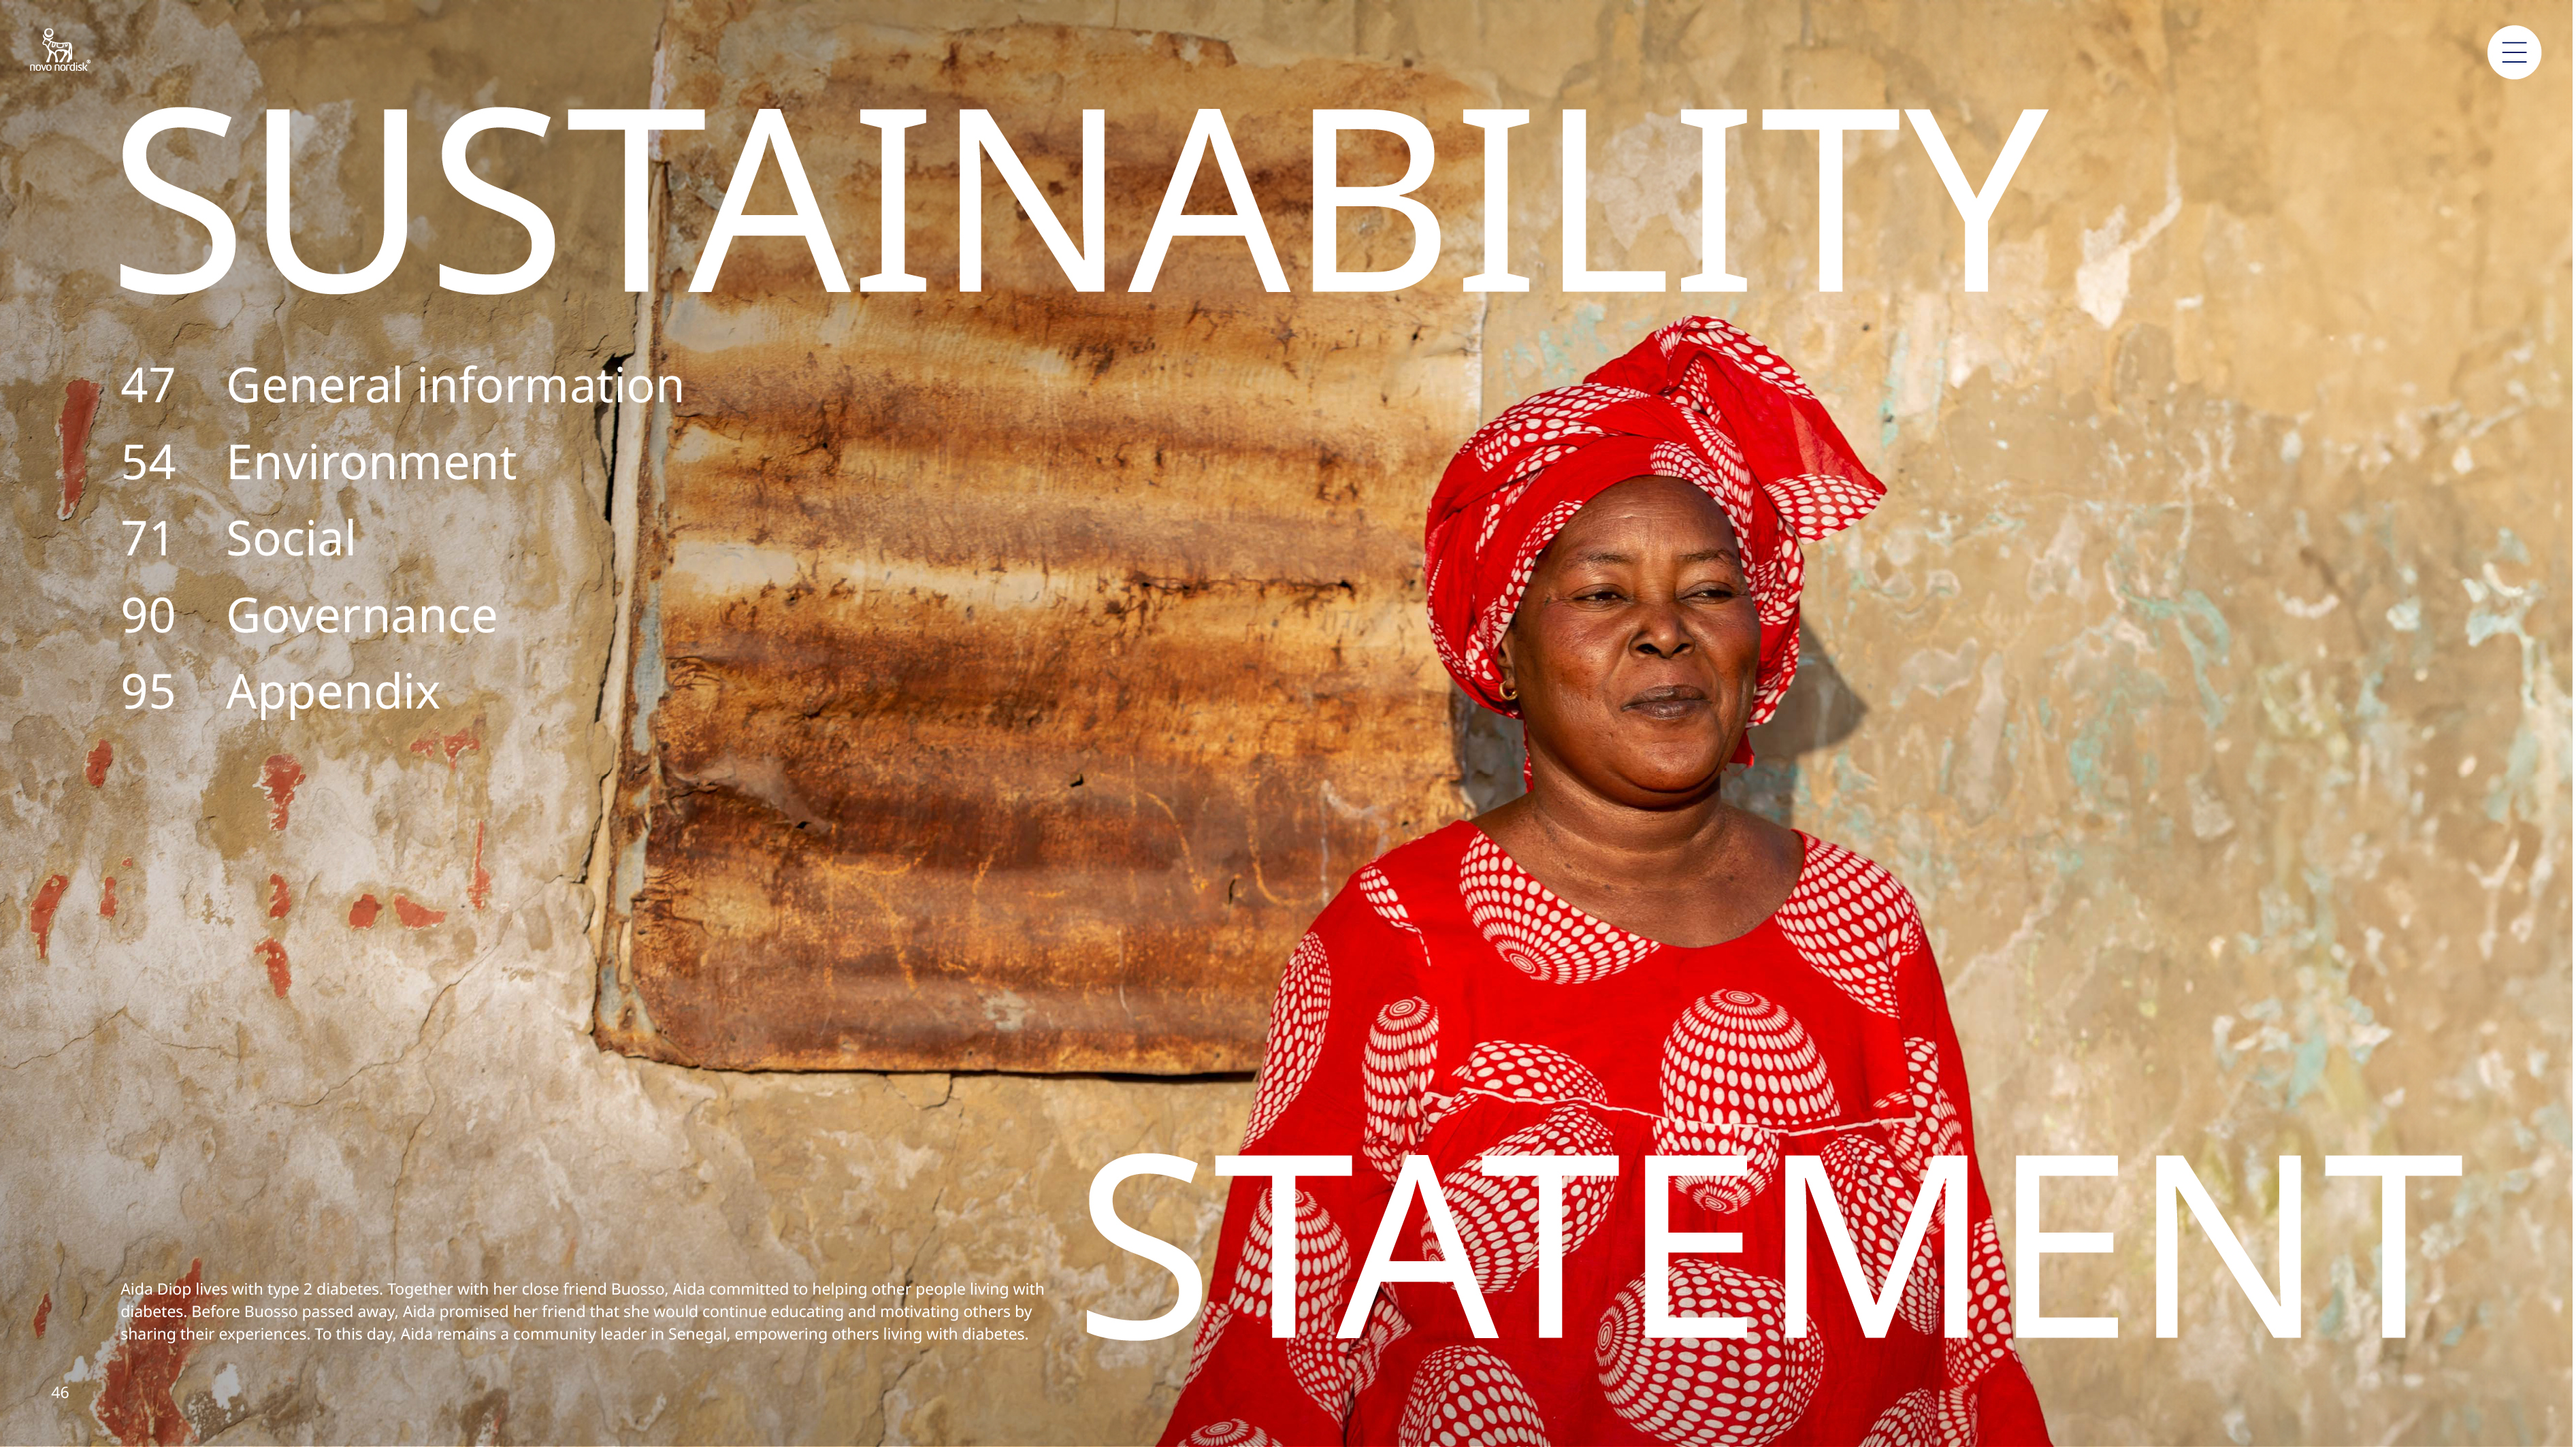
| Sustainability statement / General information / 1.1 ESG performance | | |||||||||
| Strategic aspiration | ESG metric | Unit | Target | Base year | Target year | ||||||||||||
Being respected for adding value to society | Children reached via Changing Diabetes® in Children | Number | 100,000 | 2009 | 2030 | ||||||||||||
Progress towards zero environmental impact | Scope 1 and 2 (market-based) GHG emissions | 1,000 tonnes CO2e | 0 | – | 2030 | ||||||||||||
Scope 3 GHG emissions | % | (33%) | 2024 | 2033 | |||||||||||||
Total GHG emissions (net zero) | 1,000 tonnes CO2e | 0 | – | 2045 | |||||||||||||
Plastic footprint per patient | % | (30%) | 2024 | 2033 | |||||||||||||
Being respected as a sustainable employer | Gender in senior leadership positions | % men:women | min. 45% | – | 2025 | ||||||||||||
| Sustainability statement / General information / 1.1 ESG performance | | |||||||||
Essential sustainability topics | Unit | Table | 2024 | 2023 | 2022 | Important sustainability topics | Unit | Table | 2024 | 2023 | 2022 | |||||||||||||||||||||||||||||||||||||||
 Patient protection and quality of life Patient protection and quality of life |  Business conduct Business conduct | |||||||||||||||||||||||||||||||||||||||||||||||||
Patients reached with Diabetes and Obesity care products | Number in millions | 3.1.1 | 45.2 | 41.6 | 36.9 | Substantiated cases reported within accounting issues, fraud | Number | 4.1.4 | 242 | 221 | 227 | |||||||||||||||||||||||||||||||||||||||
Vulnerable patients reached with Diabetes care products2 | Number in millions | 3.1.1 | 8.4 | 8.8 | - | and business ethics matters via the Compliance Hotline6 | ||||||||||||||||||||||||||||||||||||||||||||
Children reached through the Changing Diabetes® in Children programme (cumulative) | Number | 3.1.2 | 64,743 | 52,249 | 41,033 | Animals purchased for research | Number | 4.1..8 | 49,284 | 56,508 | 79,750 | |||||||||||||||||||||||||||||||||||||||
 Water Water | ||||||||||||||||||||||||||||||||||||||||||||||||||
Product recalls | Number | 3.1.4 | 3 | 2 | 3 | Total water consumption | 1,000 m3 | 2.4.1 | 630 | - | - | |||||||||||||||||||||||||||||||||||||||
| Failed inspections | Number | 3.1.4 | 0 | 0 | 0 |  Pollution Pollution | ||||||||||||||||||||||||||||||||||||||||||||
 Climate change Climate change | Total amount of substances of very high concern that leave facilities | Tonnes | 2.3.1 | 1 | - | - | ||||||||||||||||||||||||||||||||||||||||||||
Scope 1 GHG emissions | 1,000 tonnes CO2e | 2.1.1 | 85 | 78 | 76 | Total amount of substances of concern that leave facilities | Tonnes | 2.3.1 | 10 | - | - | |||||||||||||||||||||||||||||||||||||||
Scope 2 GHG emissions (market-based) | 1,000 tonnes CO2e | 2.1.1 | 16 | 15 | 16 | 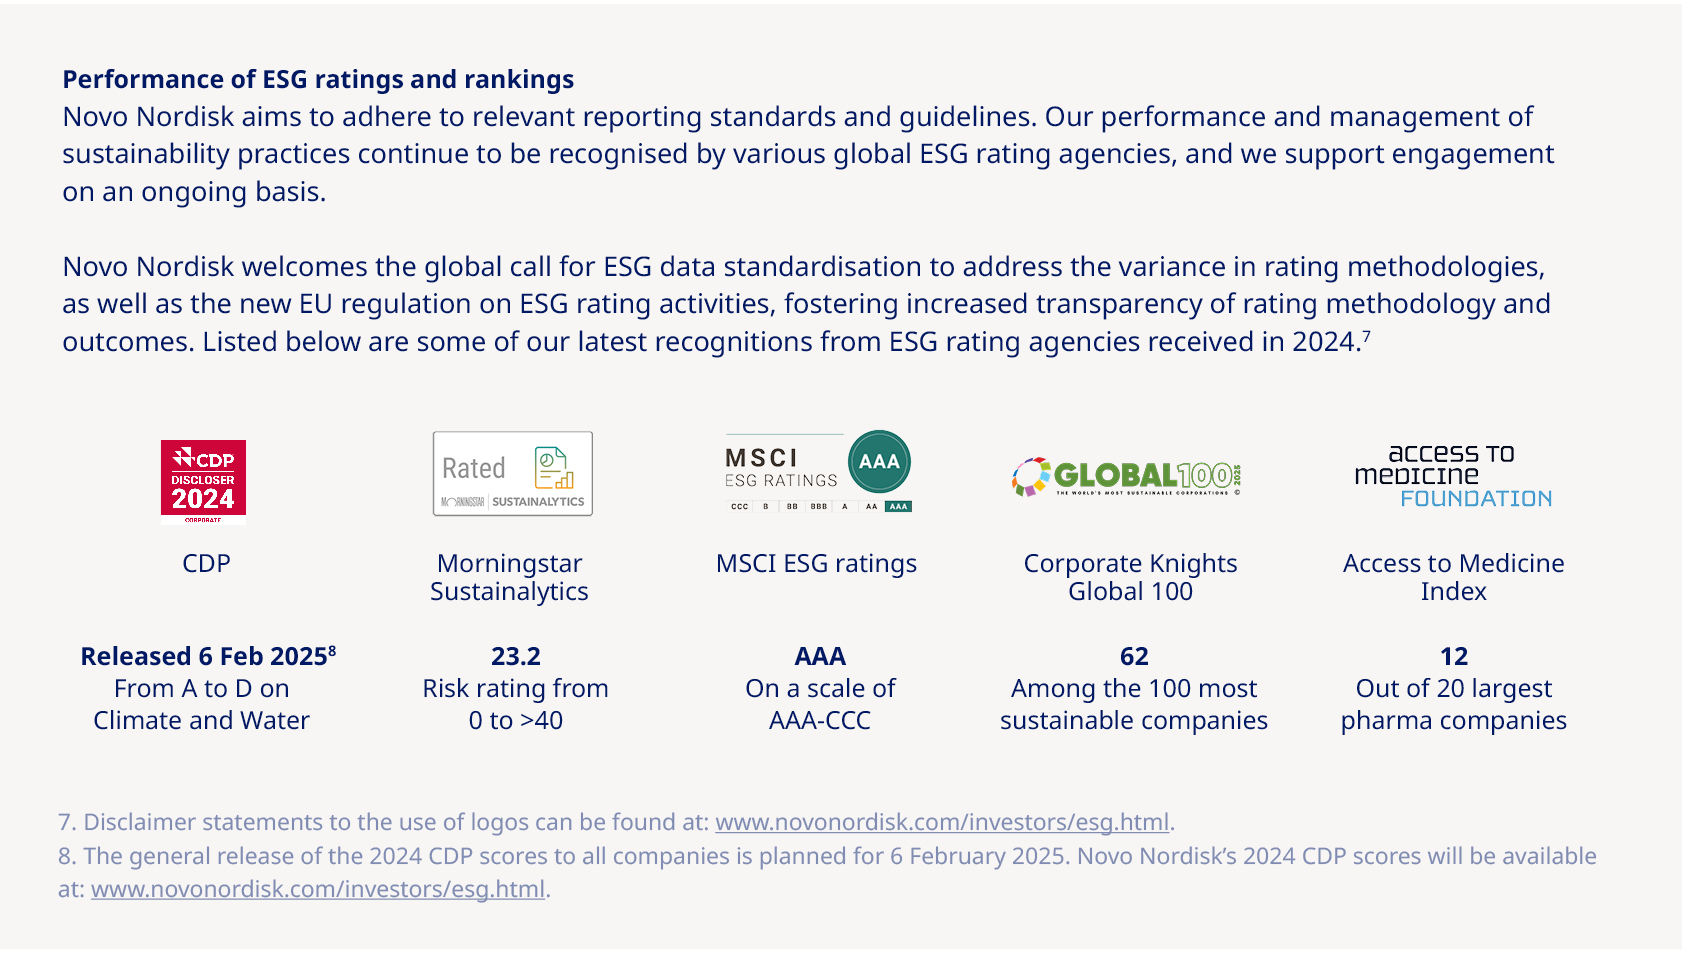 | ||||||||||||||||||||||||||||||||||||||||||||
Scope 3 GHG emissions3 | 1,000 tonnes CO2e | 2.1.1 | 2,160 | 1,743 | - | |||||||||||||||||||||||||||||||||||||||||||||
 Resource use and circular economy Resource use and circular economy | ||||||||||||||||||||||||||||||||||||||||||||||||||
Plastic footprint (absolute) | Tonnes | 2.2.2 | 15,654 | - | - | |||||||||||||||||||||||||||||||||||||||||||||
Plastic footprint per patient | kg/patient | 2.2.2 | 0.35 | - | - | |||||||||||||||||||||||||||||||||||||||||||||
 Own workforce Own workforce | ||||||||||||||||||||||||||||||||||||||||||||||||||
Employees (headcount)4 | Number | 3.2.3 | 74,156 | 64,319 | 55,185 | |||||||||||||||||||||||||||||||||||||||||||||
Gender in senior leadership positions | % men:women | 3.2.7 | 58:42 | 59:41 | 61:39 | |||||||||||||||||||||||||||||||||||||||||||||
Rate of recordable work-related accidents for own workforce5 | Accidents per million hours worked | 3.2.6 | 1.2 | 1.3 | 1.3 | |||||||||||||||||||||||||||||||||||||||||||||
Employees reporting symptoms of stress | % | 3.2.6 | 13.8 | 13.8 | 13.8 | |||||||||||||||||||||||||||||||||||||||||||||
Employees reporting symptoms of work-related physical pain | % | 3.2.6 | 6.8 | 7.1 | 7.8 | |||||||||||||||||||||||||||||||||||||||||||||
2. 2023 figure has been restated. For more information, please see section 3.1 'Patient protection and quality of life' on page 75. 3. 2023 figure has been restated. For more information, please see section 2.1 'Climate change' on page 58. 4. Total headcount of 77,349 cf. note 2.4 in the Consolidated financial statements. The variance of 3,193 employees is due to Catalent employees not being included. 5. 2023 and 2022 figures have been restated. For more information, please see section 3.2 'Own workforce' on page 84. 6. 2023 and 2022 figures have been restated. For more information, please see section 4.1 'Business conduct' on page 92. | ||||||||||||||||||||||||||||||||||||||||||||||||||
| Sustainability statement / General information / 1.2 Basis for preparation of the Sustainability statement | | |||||||||
Core elements of environmental and social due diligence | Pages | |||||||
| a) | Embedding due diligence in governance, strategy and business model | 50-55, 60, 64, 65, 67, 68, 71, 80, 88, 90 | ||||||
| b) | Engaging with affected stakeholders in all key steps of the due diligence | 50-52, 60, 66, 68, 72, 80, 86, 88, 90, 91, 94, 95 | ||||||
| c) | Identifying and assessing adverse impacts | 52-55, 60, 64, 65, 67, 71, 80, 88, 90 | ||||||
| d) | Taking actions to address those adverse impacts | 55, 56, 60-61, 64, 66, 68, 72-74, 76-79, 81-82, 84, 86, 89, 90-92, 94 | ||||||
| e) | Tracking effectiveness of these efforts and communicating | 55-59, 62-68, 74, 75, 82-87, 91-93 | ||||||
| Sustainability statement / General information / 1.3 Sustainability governance | | |||||||||
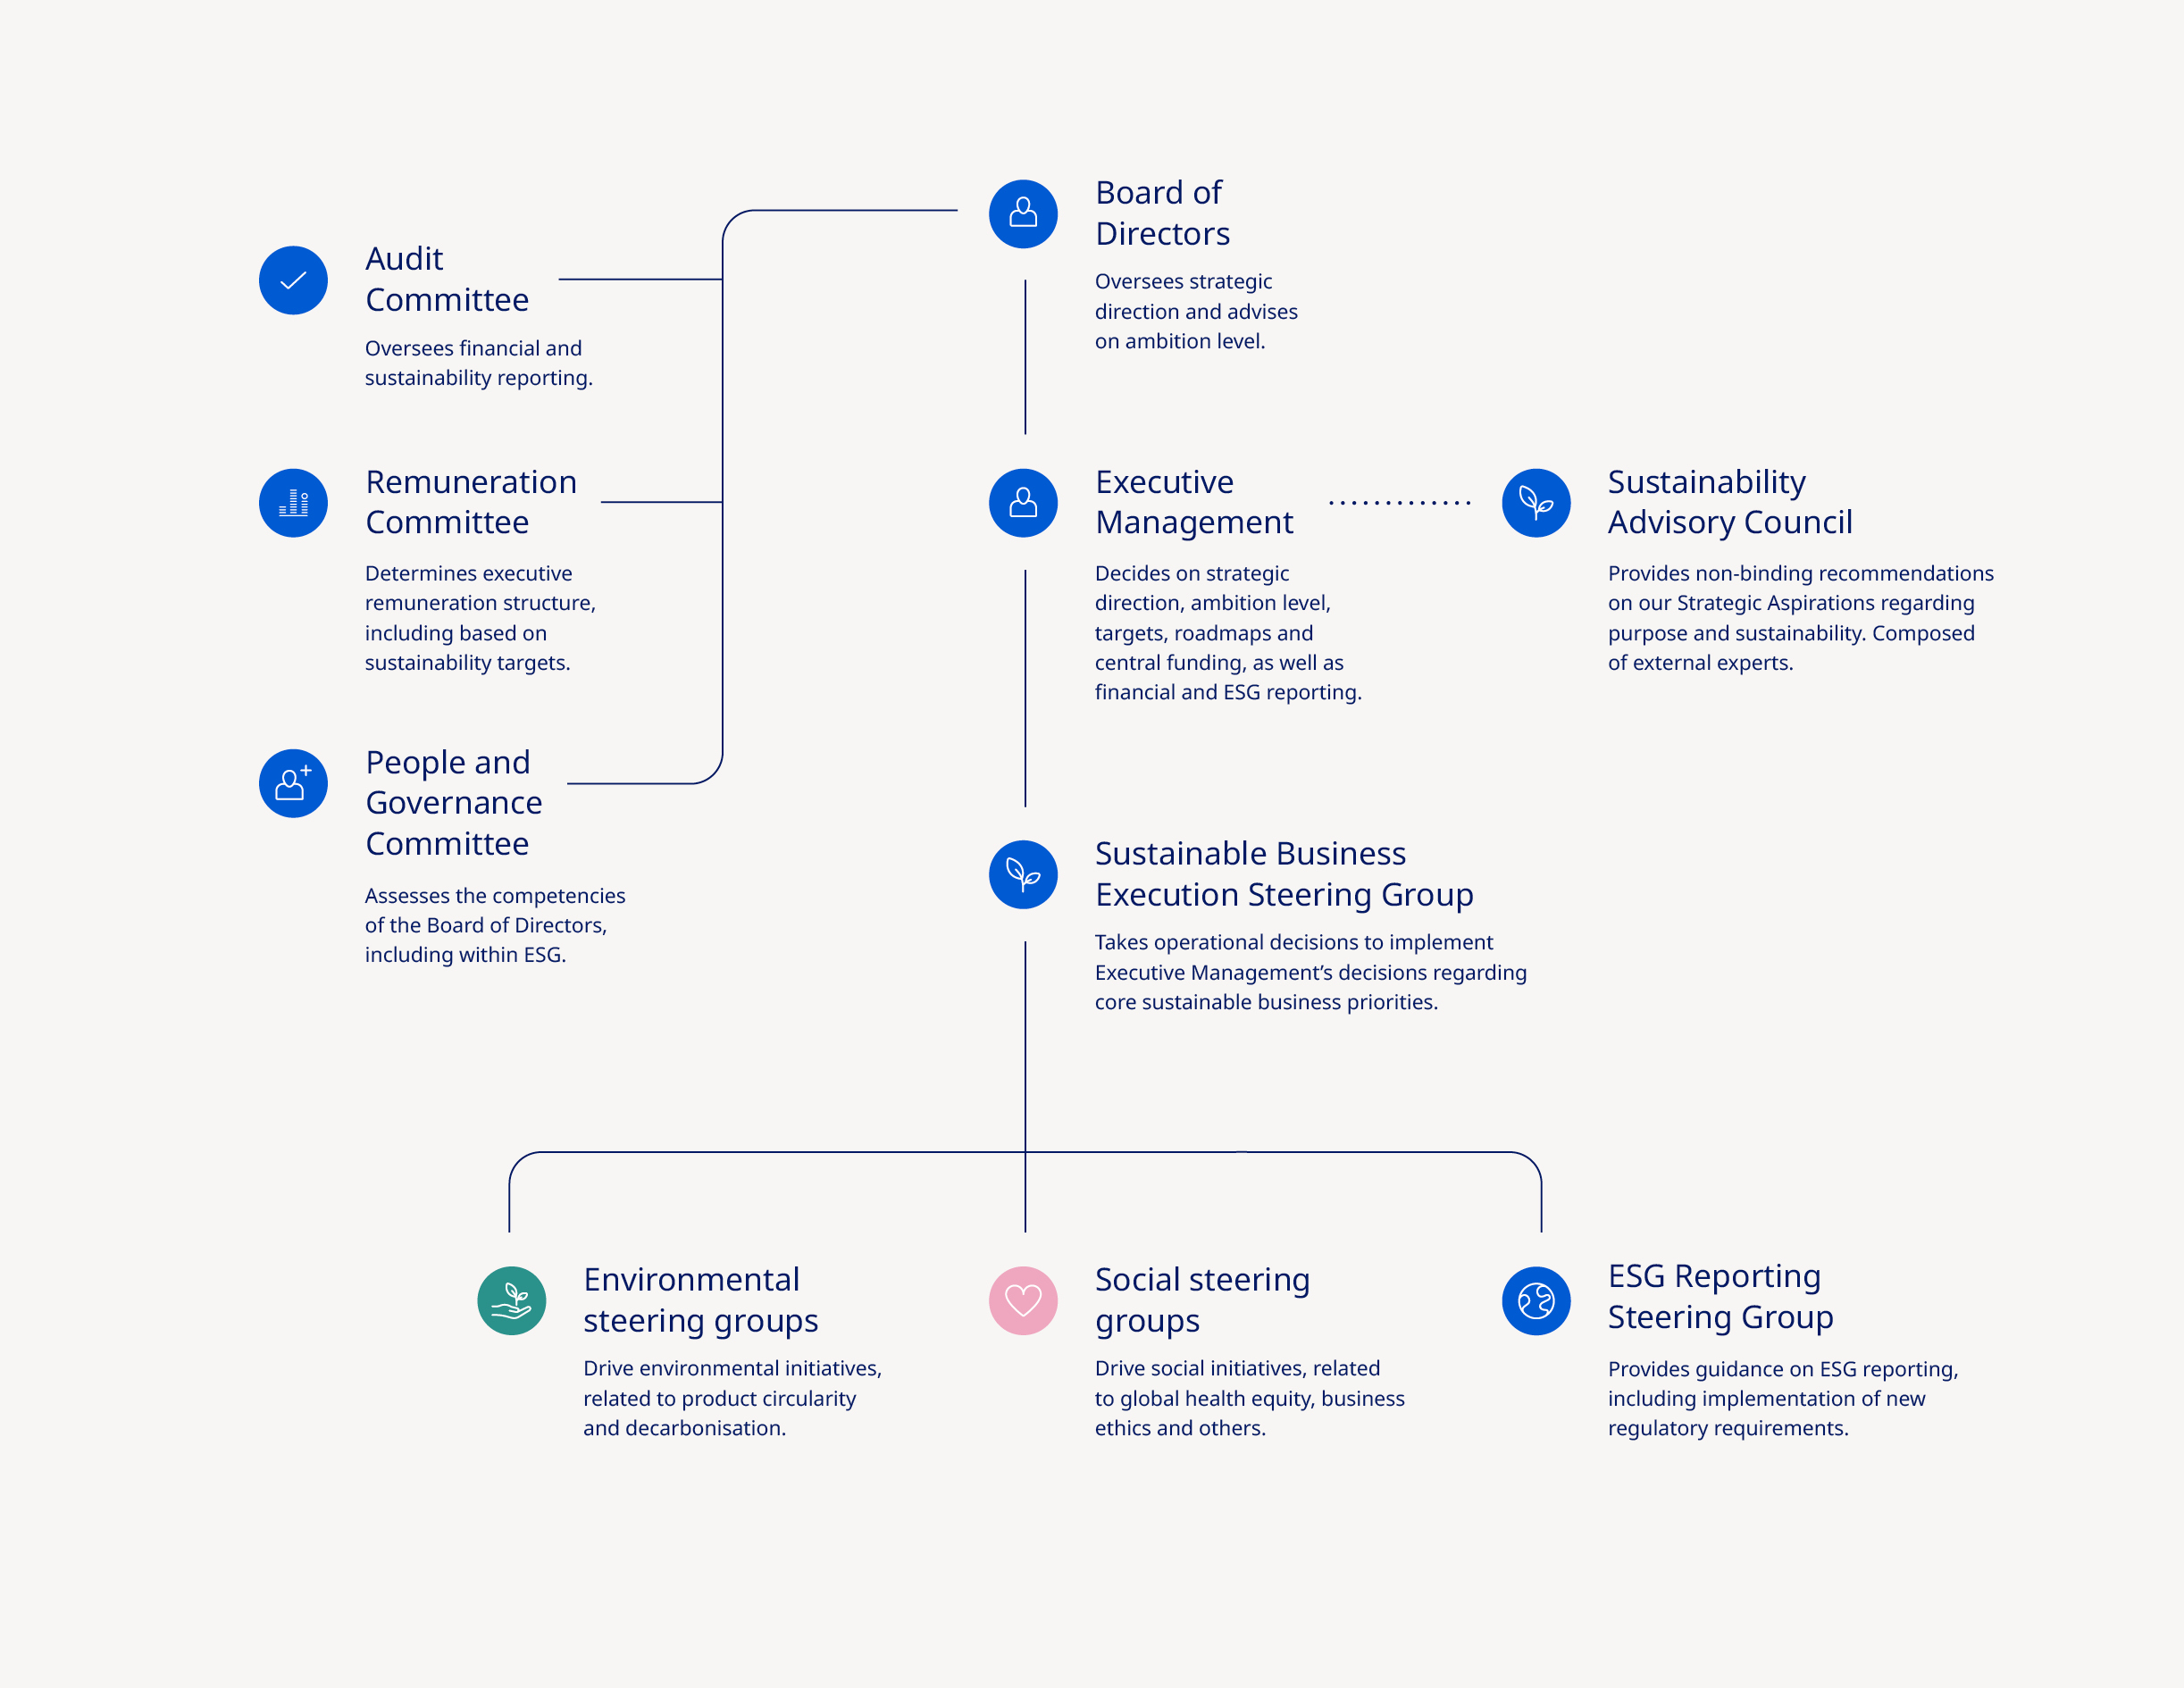
| Sustainability statement / General information / 1.4 Interests and views of stakeholders | | |||||||||
Stakeholder group | Purpose and engagement channels | Examples of how outcomes are taken into account | ||||||
| Patient organisations, healthcare professionals and healthcare organisations | We ensure a patient-centred business approach to improve prevention, detection, treatment and access to quality care for people living with serious chronic diseases, through research collaboration and trials, conferences, and scientific and medical communications. | •Development of new treatments and product improvements. •Efforts to strengthen the resilience of healthcare systems, for example through prevention efforts. | ||||||
| Employees | We strive to improve health, safety and wellbeing of our employees. Talent attraction and retention, driving innovation and providing employees with equitable opportunities to realise their potential, are essential to our strategy. We enable this via our annual employee survey, Evolve, individual career development and training, workers’ councils, ongoing social dialogue, and investing in onboarding of new employees. | •Novo Nordisk Way facilitations to live up to our cultural commitments. •Fostering a culture of safety with attention to increase employee health and total wellbeing. •Improving employee benefits, for example parental leave. | ||||||
| Suppliers and third-party representatives | Our Responsible Sourcing Programme, human rights due diligence and established contracting and engagement processes drive our supplier and third-party engagement. We leverage this when purchasing goods and services to manufacture or distribute pharmaceutical products and partnering with third-party representatives, for example on filling or assembling final products or performing clinical trials. | •Renewable electricity commitments in our supply chain. •Informed supplier and third-party representative selection. | ||||||
| Public officials and regulators | To advocate for improvement of public health and meet current and future regulatory requirements we organise and sponsor events, engage with industry associations, drive bilateral dialogues with local, national and international agencies and authorities. | •Enable new innovation. •Improve existing healthcare to the benefit of patients. | ||||||
| Partners and peers | We seek perspectives from partners and peers to advance on many of our commitments, especially when it comes to our access and prevention efforts. Example of such collaborations include our Sustainability Advisory Council, Cities for Better Health, and other industry partnerships. | •Advance our environmental commitments, for example through Sustainable Marine Fuels (SMF) and lower carbon plastics. •Prevent childhood overweight and obesity through UNICEF partnership and the Childhood Obesity Prevention Initiative with partners such as city governments and academic institutions. •Provide input to sustainability strategies and targets. | ||||||
| Investors | We strive to provide timely, accurate and transparent information to our investors through engagements such as Capital Markets Day, the annual general meeting, ESG raters and rankers, and recurring engagement in response to investor queries. | •Strengthened sustainability performance, reporting and communication efforts. | ||||||
| Sustainability statement / General information / 1.5 Double materiality assessment | | |||||||||
| Sustainability statement / General information / 1.5 Double materiality assessment | | |||||||||
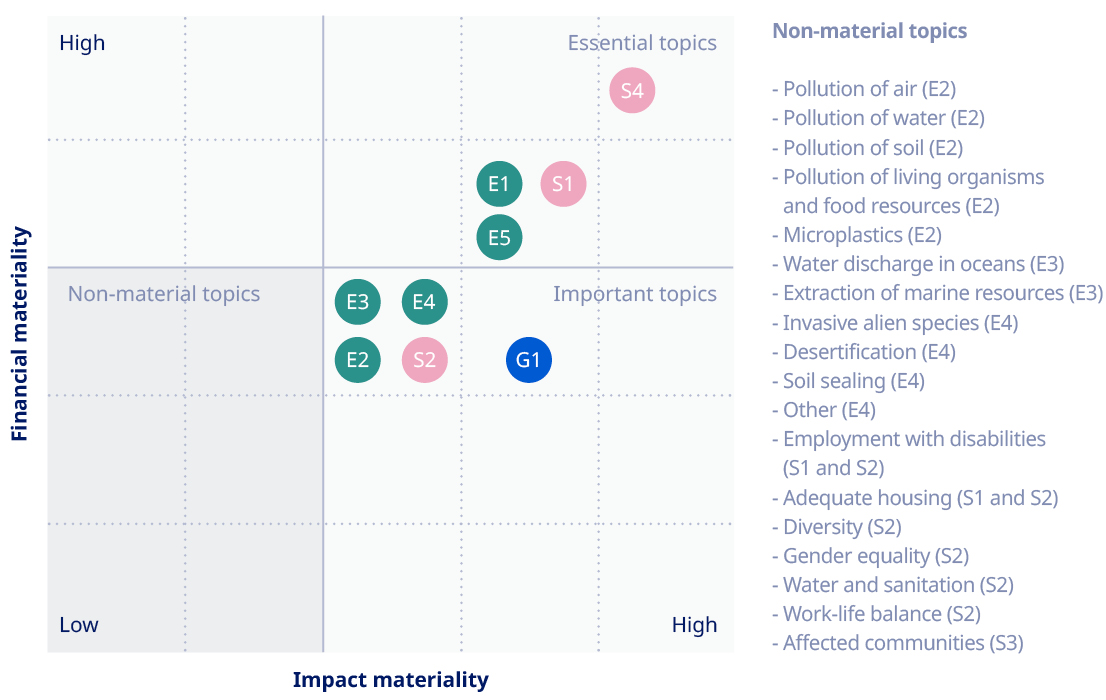
 | |||||||||||||||||||||||||||||||||||||||||
 | |||||||||||||||||||||||||||||||||||||||||
DMA topics | Category | Resources | R&D | Manufacturing | Distribution | Patients | Time horizon | Page | |||||||||||||||||||||||||||||||||
 | Climate change |  | CO2e emissions across our operations and value chain contribute to climate change |  | 54 | ||||||||||||||||||||||||||||||||||||
 | Potential reputational risks associated with rising CO2e emissions |  | 54 | ||||||||||||||||||||||||||||||||||||||
| Potential weather-related hazards impacting safety at our sites and in our value chain | | 54 | ||||||||||||||||||||||||||||||||||||||
 | Resource use and circular economy | | Resource use and waste associated with manufacturing and products | | 60 | ||||||||||||||||||||||||||||||||||||
| Potential reputational risks associated with resource consumption | | 60 | ||||||||||||||||||||||||||||||||||||||
 | Pollution | | Chemicals affecting human health or ecosystems | | 64 | ||||||||||||||||||||||||||||||||||||
 | Water | | Availability and deterioration of water resources | | 65 | ||||||||||||||||||||||||||||||||||||
 | Biodiversity and ecosystems | | Reliance on natural resources and ecosystem services | | 67 | ||||||||||||||||||||||||||||||||||||
| Reliance on vulnerable species in research |  | 67 | ||||||||||||||||||||||||||||||||||||||
 | Patient protection and quality of life |  | Improving quality of life through medicine | | 71 | ||||||||||||||||||||||||||||||||||||
Innovation2 |  | Potential new discoveries to serve patient needs | | 71 | |||||||||||||||||||||||||||||||||||||
Prevention2 | | Reducing and preventing serious chronic diseases | | 71 | |||||||||||||||||||||||||||||||||||||
| Health equity in clinical trials | Health equity for vulnerable patients | | 71 | |||||||||||||||||||||||||||||||||||||
| Safe clinical trials | Product quality and safety | | 71 | |||||||||||||||||||||||||||||||||||||
Falsified medicines2 | | Protection against falsified medicines | | 71 | |||||||||||||||||||||||||||||||||||||
| Protecting clinical trial information | Protecting patient information | | 71 | |||||||||||||||||||||||||||||||||||||
| Potential reputational and regulatory risks | | 71 | ||||||||||||||||||||||||||||||||||||||
 | Own workforce | | Employee benefits and flexible working conditions | | 80 | ||||||||||||||||||||||||||||||||||||
| Potential human rights incidents | | 80 | ||||||||||||||||||||||||||||||||||||||
| Healthy and safe work environment | | 80 | ||||||||||||||||||||||||||||||||||||||
| Equal opportunities fostering innovation | | 80 | ||||||||||||||||||||||||||||||||||||||
| Attracting talent to enable continued innovation | | 80 | ||||||||||||||||||||||||||||||||||||||
 | Workers in the value chain | | Protecting working conditions and human rights | Protecting working conditions and human rights | | 88 | |||||||||||||||||||||||||||||||||||
 | Business conduct | | Ethical working culture through Novo Nordisk Way | | 90 | ||||||||||||||||||||||||||||||||||||
| Interacting with all stakeholders in accordance with our business ethics standards | | 90 | ||||||||||||||||||||||||||||||||||||||
| Promoting public health | | 90 | ||||||||||||||||||||||||||||||||||||||
Bioethics2 | | Upholding high bioethical standards | | 90 | |||||||||||||||||||||||||||||||||||||
| Reliance on animals in research | | 90 | ||||||||||||||||||||||||||||||||||||||
| Positive impact Negative impact Opportunity Risk |  | ||||||||||||||||||||||||||||||||||||||||
| Sustainability statement / Environment / 2.1 Climate change | | |||||||||
Identified IRO | Category | Value chain | ||||||
CO2e emissions across our operations and value chain contribute to climate change |  | •Upstream •Own operations •Downstream | ||||||
Potential reputational risks associated with rising CO2e emissions |  | •Upstream •Own operations •Downstream | ||||||
Identified IRO | Category | Value chain | ||||||
Potential weather-related hazards impacting safety at our sites and in our value chain | | •Upstream •Own operations •Downstream | ||||||
 Positive impact Negative impact
  Opportunity Risk
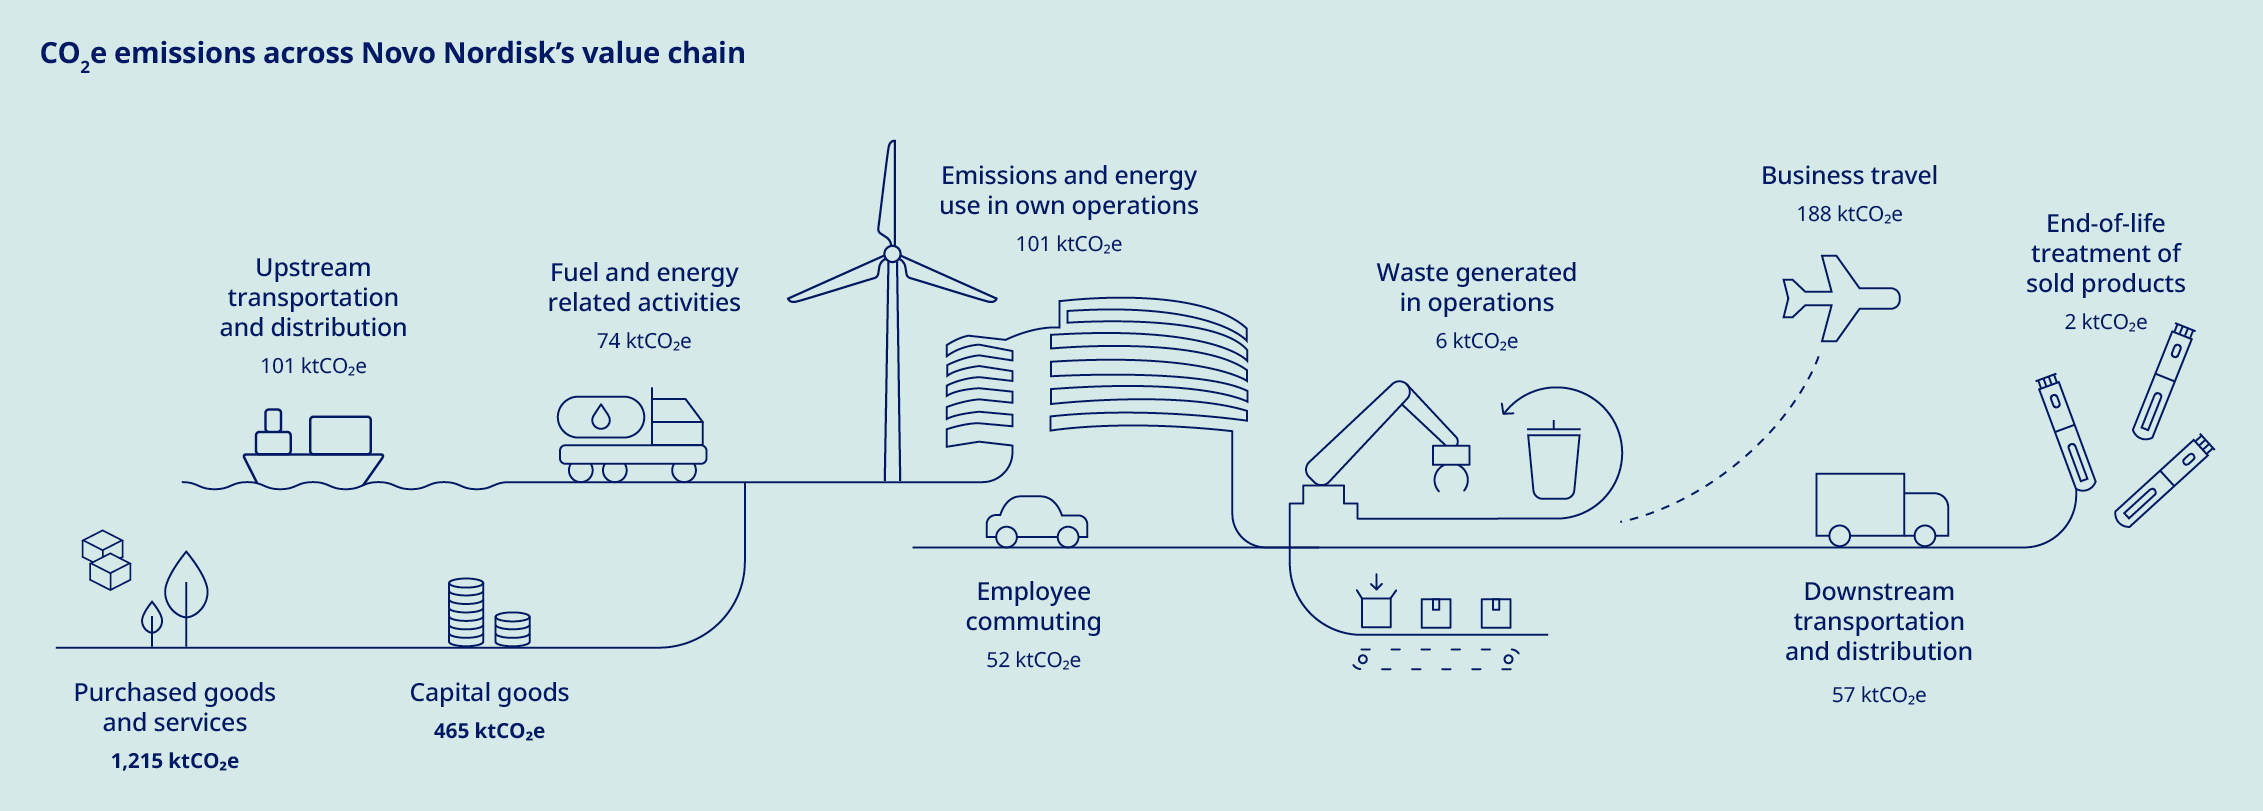
| Sustainability statement / Environment / 2.1 Climate change | | |||||||||
| Policy | Environmental policy | ||||||||||
| Purpose | Guides action across material environmental topics | ||||||||||
Scope | All of Novo Nordisk's global activities | ||||||||||
Most senior level accountable | Executive Management | ||||||||||
Availability | Externally available: Our environmental policy | ||||||||||
Applicability across Sustainability statement | •Climate change, page 54 •Resource use and circular economy, page 60 •Pollution, page 64 •Water, page 65 •Biodiversity and ecosystems, page 67 | ||||||||||
| Sustainability statement / Environment / 2.1 Climate change | | |||||||||
| Key action to address climate change | Description and year of completion | Scope of action | Target in place | Overall progress in 2024 and how we track effectiveness | ||||||||||||||||
Energy efficiency and optimisation (scope 1 and 2) | Sites and processes are optimised through our energy savings programme, rethinking the design of our site infrastructure to ensure a resource-efficient energy supply, for example through the construction of a district cooling ring at site Kalundborg, Denmark, to be completed in 2026. Energy efficiency and optimisation across sites is an ongoing action until at least 2030. | Own operations globally | Yes | •Progressed with the construction of district cooling ring at site Kalundborg, Denmark, with expected energy savings of over 20,000 MWh/year after completion in 2026. •In 2024, energy savings initiatives across sites resulted in total energy reduction of 13,740 MWh. | ||||||||||||||||
Switching to renewable electricity (scope 2) | Reach 100% renewable electricity for Novo Nordisk’s own production sites and affiliates, continuously striving for best practice solutions. Action is ongoing until at least 2030. | Own operations globally | Yes | •Maintained 100% of Novo Nordisk’s electricity consumption procured from renewable energy sources at all production sites. •Continued the transition towards renewable electricity at our affiliates, reaching 99% coverage. | ||||||||||||||||
Reducing emissions from heat and steam (scope 1 and 2) | To reach zero CO2e emissions from production, we are converting steam and heat in our production processes towards renewable energy sources by electrifying processes and covering natural gas consumption by biogas certificates. Action is ongoing until at least 2030. | Own operations globally | Yes | •Progressed plans to electrify heat and steam production where possible and to cover the natural gas consumption of sites in the US with biogas (renewable natural gas) certificates. •Energy consumption from renewable resources accounted for 54% of total energy consumption (excluding steam and heat derived from biomass). | ||||||||||||||||
Remaining scope 1 and 2 emissions reductions | Main reductions from remaining scope 1 and 2 GHG emissions will come from lowering emissions from refrigerants, back-up systems and transitioning fossil-based vehicles in own operations to battery electric or plug-in hybrid vehicles. Action is ongoing until at least 2030. | Own operations globally | Yes | •Continued the transition away from fossil-based vehicles with market-specific guidance based on local infrastructure conditions. | ||||||||||||||||
Reducing emissions from high impact sourcing categories (scope 3, category 1 and 2) | Reducing emissions from high impact sourcing categories through three focus areas: 1) converting to lower carbon raw materials and feedstocks for our device and drug manufacturing, as well as lower carbon construction materials; 2) process optimisations to lower material use; 3) renewable energy for tier 1 suppliers. Action to be implemented from 2025-2033. | Supply chain globally | Yes | •To date, more than 1,800 suppliers have committed to transitioning to renewable power. •In 2024, initiatives were identified together with suppliers and relevant business units across Novo Nordisk, which are expected to account for the majority of scope 3 emission reductions. •Effectiveness is assessed on a quarterly basis through tracking estimated GHG emissions. | ||||||||||||||||
Reducing emissions from product distribution (scope 3, category 4 and 9) | Lower distribution emissions by air, sea, and road: 1) by air, converting additional upstream air freight to sea freight, while securing Sustainable Aviation Fuel (SAF) via long-term off-take agreements; 2) by sea, securing Sustainable Marine Fuel (SMF) in upstream distribution; 3) by road, through low-carbon road freight solutions upstream and downstream. Action to be completed by 2033. | Upstream and downstream distribution globally | Yes | •Initiatives identified together with suppliers and relevant business units across Novo Nordisk. •Effectiveness is assessed on a quarterly basis through tracking estimated GHG emissions. | ||||||||||||||||
Climate adaptation | To address physical climate risks faced by some of our sites in the medium and long term, all medium- and high-risk sites are covered by mitigation plans, including procedures in cases of a temporary production shutdown and safety rooms for employees, as well as leak detection, drainage, and protection against storm surge. The natural hazard exposure of our 400 most critical suppliers is reviewed as part of our comprehensive supply chain risk assessment. | Own production sites and suppliers | No | •Conducted an updated assessment based on new tools and data, including several new suppliers and acquisition sites, in addition to own sites. •Effectiveness of actions are tracked through an annual NatCat report, distributed to own sites to ensure cross-site learning and best practice. | ||||||||||||||||
| Sustainability statement / Environment / 2.1 Climate change | | |||||||||
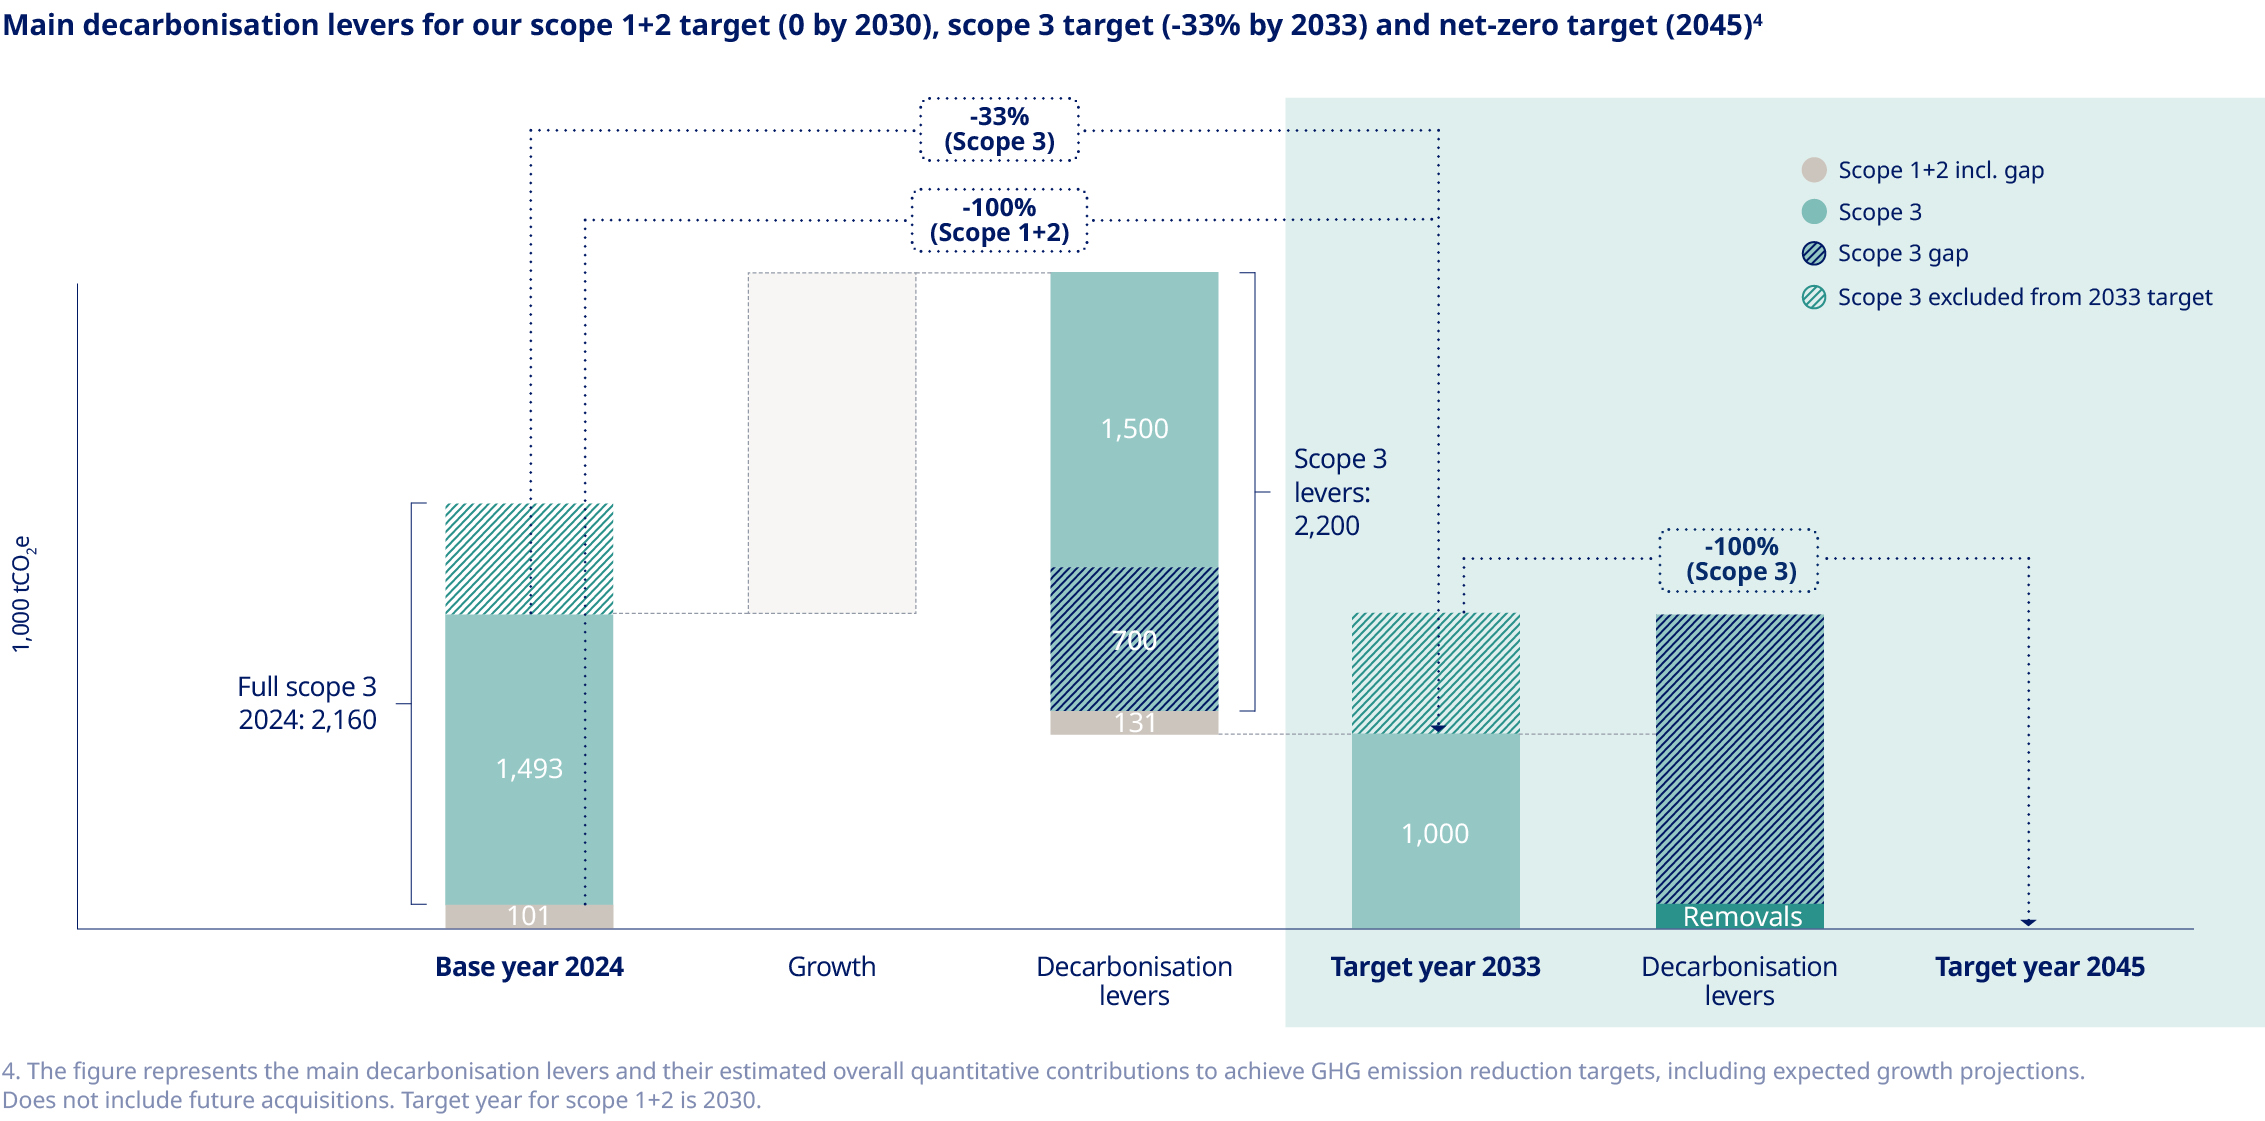
| Sustainability statement / Environment / 2.1 Climate change | | |||||||||
2.1.1 Scope 1, 2 and 3 GHG emissions6 | Unit | 2024 | 2023 | 2022 | % change | ||||||||||||
| Scope 1 GHG emissions | 1,000 tCO2e | 85 | 78 | 76 | 9% | ||||||||||||
Percentage of scope 1 GHG emissions from regulated emission trading schemes | % | 0.3 | – | – | – | ||||||||||||
Biogenic emissions (Out-of-scope emissions) scope 1 | 1,000 tCO2 | 37 | – | – | – | ||||||||||||
Scope 2 GHG emissions – location-based | 1,000 tCO2e | 174 | – | – | – | ||||||||||||
Scope 2 GHG emissions – market-based | 1,000 tCO2e | 16 | 15 | 16 | 7% | ||||||||||||
Biogenic emissions (Out-of-scope emissions) scope 2 | 1,000 tCO2 | 73 | – | – | – | ||||||||||||
Scope 1 and 2 (market-based) GHG emissions | 1,000 tCO2e | 101 | 93 | 92 | 9% | ||||||||||||
| Scope 3 GHG emissions | 1,000 tCO2e | 2,160 | 1,743 | – | 24% | ||||||||||||
• Category 1: Purchased goods and services7 | 1,000 tCO2e | 1,215 | 1,018 | – | 19% | ||||||||||||
• Category 2: Capital goods7 | 1,000 tCO2e | 465 | 303 | – | 53% | ||||||||||||
• Category 3: Fuel- and energy-related activities | 1,000 tCO2e | 74 | 56 | – | 32% | ||||||||||||
• Category 4: Upstream transportation and distribution7 | 1,000 tCO2e | 101 | 108 | – | (6%) | ||||||||||||
• Category 5: Waste generated in operations | 1,000 tCO2e | 6 | 6 | – | 0% | ||||||||||||
• Category 6: Business travel7 | 1,000 tCO2e | 188 | 154 | – | 22% | ||||||||||||
• Category 7: Employee commuting | 1,000 tCO2e | 52 | 43 | – | 21% | ||||||||||||
• Category 9: Downstream transportation and distribution | 1,000 tCO2e | 57 | 52 | – | 10% | ||||||||||||
• Category 12: End-of-life treatment of sold products | 1,000 tCO2e | 2 | 3 | – | (33%) | ||||||||||||
Percentage of scope 3 GHG emissions calculated using primary data | % | 12.3 | – | – | - | ||||||||||||
Total GHG emissions – location-based | 1,000 tCO2e | 2,419 | – | – | - | ||||||||||||
GHG emission intensity, location-based (total GHG emissions per net revenue8) | tCO2e/mDKK | 8.3 | – | – | - | ||||||||||||
Total GHG emissions – market-based | 1,000 tCO2e | 2,261 | 1,836 | – | 23% | ||||||||||||
GHG emission intensity, market-based (total GHG emissions per net revenue8) | tCO2e/mDKK | 7.8 | – | – | - | ||||||||||||
6. Operational control = financial control approach. 7. 2023 figures have been restated for categories 1, 2, 4 and 6 from 2,067; 1,315; 113 and 83 thousand tonnes CO2e, respectively, as disclosed in the Annual Report 2023. 8. Please see note 2.1 'Net sales and rebates' on page 107 in the Consolidated financial statements. | |||||||||||||||||
2.1.2 Scope 1, 2 and 3 GHG emissions targets | Unit | 20249 | 2030 | 2033 | 2045 | Average annual reduction | Target type | Target | ||||||||||||||||||
| Scope 1 and 2 (market-based) GHG emissions | 1,000 tCO2e | 101 | 0 | 0 | 0 | 17% | Absolute | (100%) | ||||||||||||||||||
Scope 3 GHG emissions10 | 1,000 tCO2e | 1,493 | – | 1,000 | 011 | 4% | Absolute | (33%) | ||||||||||||||||||
9. Base year. 10. The target covers nearly 70% of our scope 3 emissions in accordance with SBTi provisions. Read more on page 57. 11. Novo Nordisk estimates residual emissions after the decarbonisation levers to be 150 thousand tonnes CO2e. | ||||||||||||||||||||||||||
2.1.3 Energy consumption and mix | Unit | 2024 | 2023 | 2022 | ||||||||||
Total energy consumption related to own operations12 | MWh | 1,400,228 | 1,051,111 | 1,021,389 | ||||||||||
Percentage of fossil sources in total energy consumption | % | 46% | – | – | ||||||||||
Percentage of renewable sources in total energy consumption | % | 54% | – | – | ||||||||||
Energy intensity (total energy consumption per net revenue13) | MWh/mDKK | 4.82 | – | – | ||||||||||
12. Equals to total energy consumption from activities in high climate impact sectors. 13. Please see note 2.1 'Net sales and rebates' on page 107 in the Consolidated financial statements. | ||||||||||||||
| Sustainability statement / Environment / 2.1 Climate change | | |||||||||
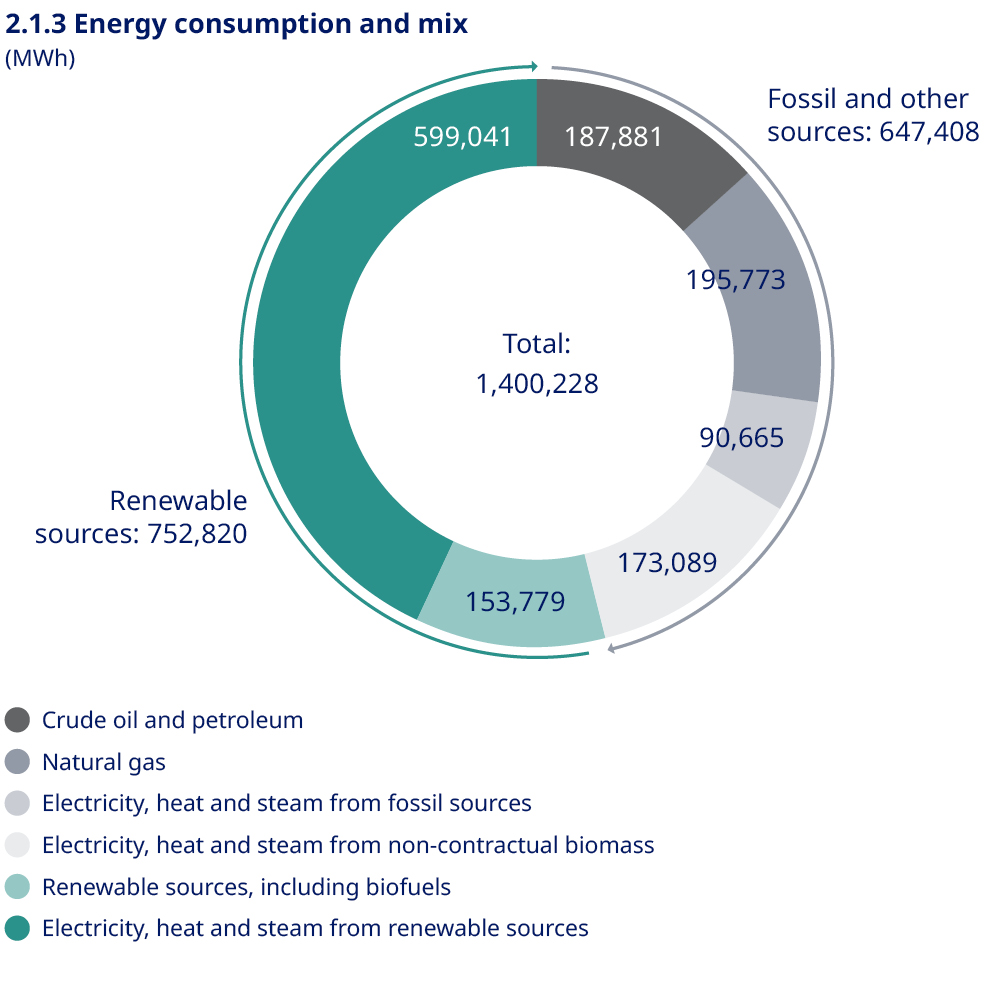
| Sustainability statement / Environment / 2.2 Resource use and circular economy | | |||||||||
Identified IRO | Category | Value chain | ||||||
Resource use and waste associated with manufacturing and products | | •Upstream •Own operations •Downstream | ||||||
Potential reputational risks related to resource consumption | | •Upstream •Own operations •Downstream | ||||||
Positive impact Negative impact Opportunity Risk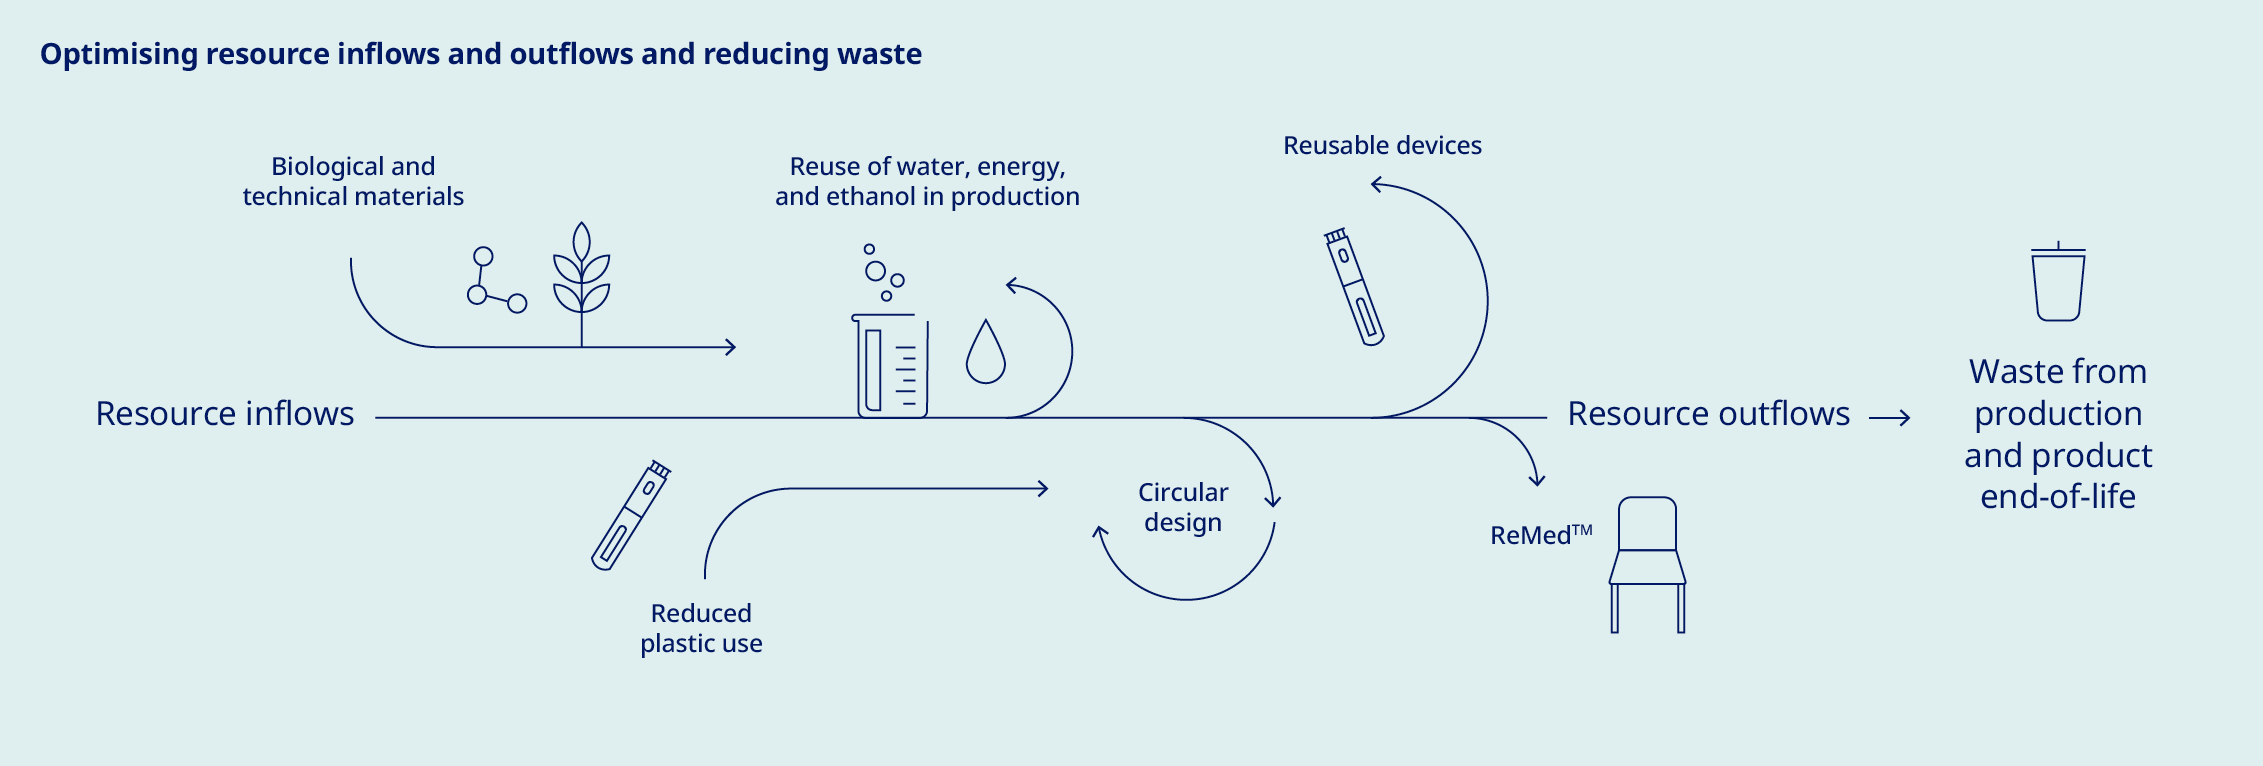
| Sustainability statement / Environment / 2.2 Resource use and circular economy | | |||||||||
| Key action to address resource use and circular economy | Description and year of completion | Scope of action | Target in place | Overall progress in 2024 and how we track effectiveness | ||||||||||||||||
| Lower-carbon plastics | Industrial partnership to buy e-methanol to produce a lower-carbon alternative to one of Novo Nordisk's top two plastic types. Production is expected to start in 2025 and continue on an ongoing basis, pending completion of plant construction. | Global, injection devices | No | •Partnership launched in 2024. •Tracking to be established in connection with receipt of first batch of materials. | ||||||||||||||||
ReMedTM: recycling of used pens | Take-back scheme to recycle injection pens launched in 2020 in Denmark, and subsequently in six other markets. These seven markets represent approximately 20% of injection pens currently supplied in the market. An industry-wide scheme was launched in Denmark in 2023 with three other pharmaceutical companies as part of our ongoing efforts to address the lack of recycling infrastructures in our industry. Collected pens are recycled by an external recycling partner. | Denmark, Brazil, France, Italy, UK, Japan, Germany | No | •ReMedTM initiatives launched in Italy, Japan and Germany. •Return rate of 32% achieved for all injection devices in Danish industry scheme. Recycling rate for returned pens increased from 50% in early 2024 to 70% by end of 2024. •Effectiveness is tracked through monitoring return rates across markets in scope. We work continuously on making patients, society and partners aware of the scheme to drive up return rates and increase recycled volumes. | ||||||||||||||||
Converting to reusable devices | Converting from single and multi-use devices to reusable devices, to lower the lifetime environmental impact per product, including developing a cost-efficient reusable pen with a competitive environmental profile across our injection pen portfolio as part of our recurring efforts to increase circularity and reduce our plastic footprint per patient. | Global | Yes | •Plastic footprint of 0.35 kg/patient in 2024. •Development of new reusable device, planned for launch in 2026. •Future plans include delivering the majority of daily insulins in reusable devices. •Strengthened implementation of circular design framework through organisational anchoring and tools. •Awiqli® entered the market for the first time. | ||||||||||||||||
| Circular design guidelines | Guidelines tailored to our devices and packaging and applied to every design process, which consider 1) design for expected lifetime; 2) design for sustainable materials; 3) no unnecessary waste in production; and 4) recyclability after use. This is a recurring action. | Global | ||||||||||||||||||
| Innovating treatment methods | Optimising our material use through Awiqli®, the world’s first once-weekly basal insulin, as part of our efforts to reduce our plastic footprint towards 2033. Going from daily to weekly injection reduces the plastic footprint of the treatment by approximately two thirds (compared to once-daily treatment). | Canada, Germany, and China | ||||||||||||||||||
| Making production processes more circular | Circular production processes, including internal reuse of ethanol at our two largest API production sites, as a recurring action. At site Kalundborg, Denmark, most remaining ethanol waste together with yeast slurry is turned into energy and fertiliser for local farmers as part of the Kalundborg Symbiosis. | API production in Denmark and US | No | •Resource use is monitored at site level to track our levels of circularity and resource efficiency across production processes, thus enabling the ongoing identification of improvement areas. For example, the reuse of ethanol reduces use of new ethanol by almost 90%. | ||||||||||||||||
Eliminating landfill waste | Divert waste from landfill to either incineration, other recovery operations or recycling by 2030 to avoid harmful environmental impacts from landfill waste. | Production sites globally | Yes | •Waste to landfill reduced at site Clayton, US, most of it via waste-to-energy, leading to a significant reduction of landfill waste. | ||||||||||||||||
| Sustainability statement / Environment / 2.2 Resource use and circular economy | | |||||||||
2.2.1 Resource inflows | Unit | 2024 | 2023 | 2022 | ||||||||||
| Overall total weight of products and technical and biological materials used during the reporting period | 1,000 tonnes | 226 | – | – | ||||||||||
| Percentage of biological materials (and biofuels used for non-energy purposes) that are sustainably sourced | % | 0 | – | – | ||||||||||
| Absolute weight of secondary reused or recycled components, secondary intermediary products and secondary materials used to manufacture the undertaking’s products and services (including packaging) | 1,000 tonnes | 3 | – | – | ||||||||||
| Percentage of secondary reused or recycled components, secondary intermediary products and secondary materials | % | 1 | – | – | ||||||||||
2.2.2 Resource outflows | Unit | Novo Nordisk 2024 | Industry 2024 | Novo Nordisk 2023 | Industry 2023 | Novo Nordisk 2022 | Industry 2022 | ||||||||||||||||
Expected durability of unopened prefilled devices | Months | 24-36 | 12-36 | – | – | – | – | ||||||||||||||||
• Prefilled devices for single use | Number of uses | 1 | 1 | – | – | – | – | ||||||||||||||||
• Prefilled devices for multiple use | Number of uses | 7 | 7 | – | – | – | – | ||||||||||||||||
Expected durability of reusable devices | Months | 60 | 12-72 | – | – | – | – | ||||||||||||||||
Recyclable content in products | % | 0 | – | – | – | – | – | ||||||||||||||||
Recyclable content in products packaging | % | 28 | – | – | – | – | – | ||||||||||||||||
Plastic footprint (absolute) | Tonnes | 15,654 | N/A | ||||||||||||||||||||
Plastic footprint per patient | kg/patient | 0.35 | N/A | ||||||||||||||||||||
| Target | 2024 | 2033 | |||||||||||||||||||||
Plastic footprint per patient | % reduction from 2024 | N/A | (30%) | ||||||||||||||||||||
| Sustainability statement / Environment / 2.2 Resource use and circular economy | | |||||||||
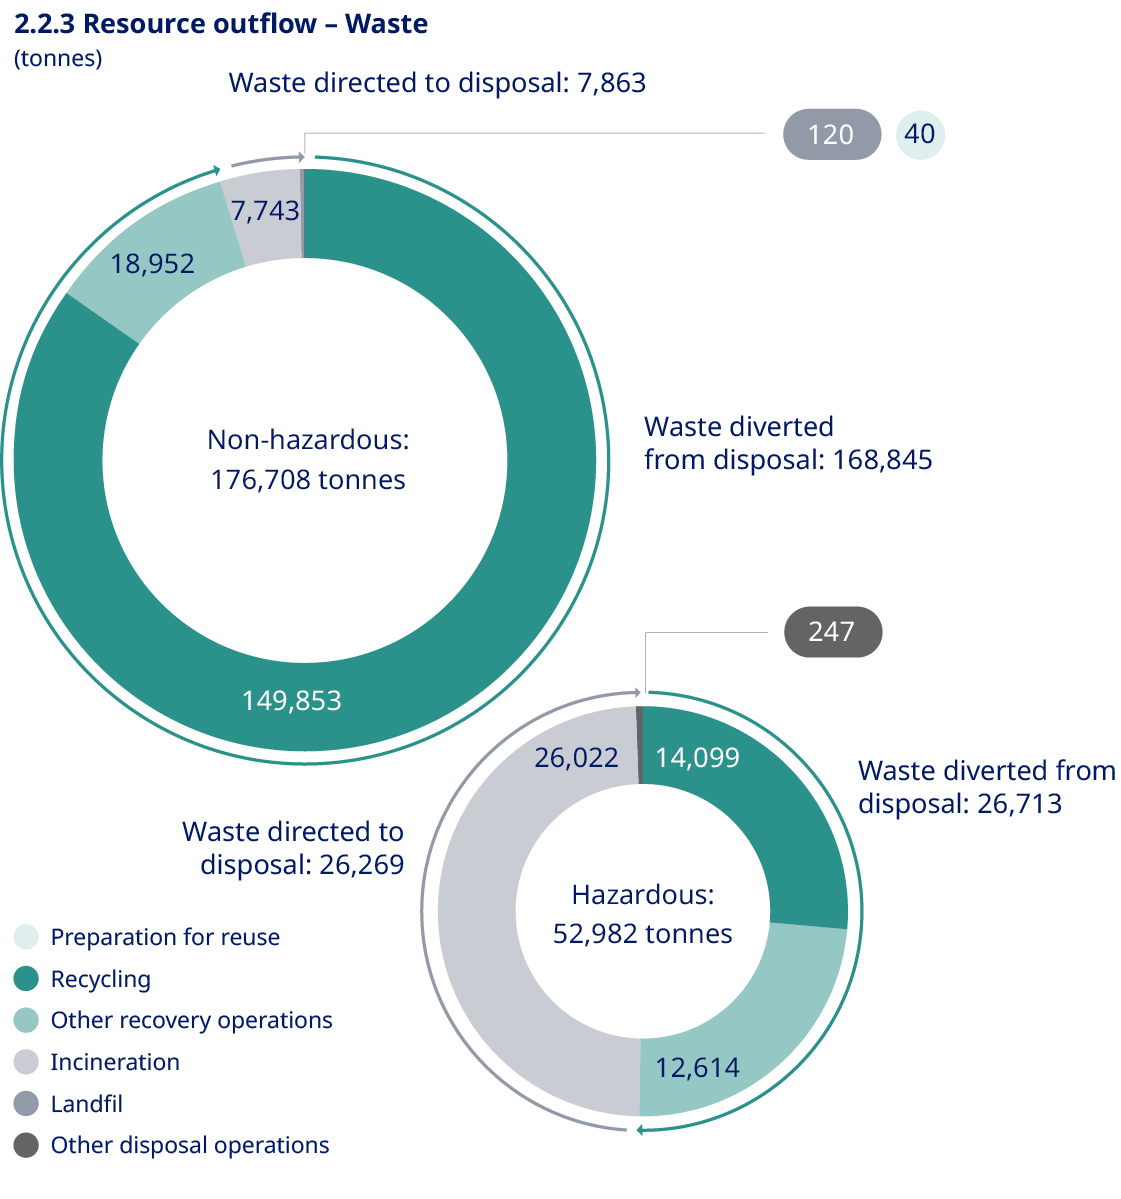
2.2.3 Resource outflow – Waste | Unit | 2024 | 2023 | 2022 | ||||||||||
| Total waste generated | Tonnes | 229,690 | 189,091 | 213,505 | ||||||||||
Non-recycled waste | Tonnes | 34,132 | – | – | ||||||||||
Percentage of non-recycled waste | % | 15% | – | – | ||||||||||
Total amount of radioactive waste | kg | 871 | – | – | ||||||||||
Waste to landfill | Tonnes | 120 | 638 | 906 | ||||||||||
Progress on target | 2024 | 2030 | ||||||||||||
Waste to landfill (production) | Tonnes | 94 | 0 | |||||||||||
1. 20kg Isotope 125-I solid, 15kg Isotope 125-I Liquid, 15kg Isotope 3-H, solid, and 37kg Isotope 3-H, solid. | ||||||||||||||
| Sustainability statement / Environment / 2.3 Pollution | | |||||||||
Identified IRO | Category | Value chain | ||||||
Chemicals affecting human health or ecosystems | | •Upstream •Own operations •Downstream | ||||||
Positive impact Negative impact Opportunity Risk| Key action to address chemical pollution | Description and year of completion | Scope of action | Target in place | Overall progress in 2024 and how we track effectiveness | ||||||||||||||||
Reducing chemicals in production and medicines | Recurring action to minimise the use of specific chemicals in production processes through substitution or purification for reuse, and to optimise efficacy of medicines with lower chemical use. | In-house and outsourced production processes | No | •The use of relevant chemicals is tracked through environmental assessments at production sites and during product design and development processes to monitor effectiveness. | ||||||||||||||||
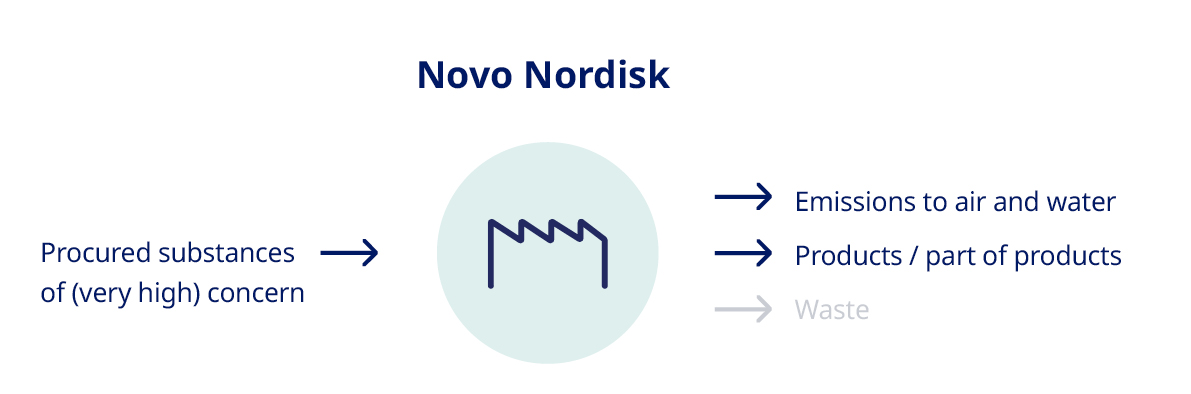
| Sustainability statement / Environment / 2.4 Water | | |||||||||
2.3.1 Substances of Concern and Substances of Very High Concern2 | Substances of concern | Substances of very high concern | ||||||||||||||||||||||||
| Unit | 2024 | 2023 | 2022 | 2024 | 2023 | 2022 | ||||||||||||||||||||
| Substances procured | Tonnes | 445 | – | – | 1,859 | – | – | |||||||||||||||||||
| • Human health hazard | Tonnes | 355 | – | – | N/A | – | – | |||||||||||||||||||
| • Environmental hazard | Tonnes | 111 | – | – | N/A | – | – | |||||||||||||||||||
| • Physical hazard | Tonnes | 0 | – | – | N/A | – | – | |||||||||||||||||||
| Substances leaving facilities as emissions, as products, or as part of products | Tonnes | 10 | – | – | 1 | – | – | |||||||||||||||||||
| Substances leaving facilities as emissions | Tonnes | 5 | – | – | 1 | – | – | |||||||||||||||||||
| • Human health hazard | Tonnes | 5 | – | – | N/A | – | – | |||||||||||||||||||
| • Environmental hazard | Tonnes | 0 | – | – | N/A | – | – | |||||||||||||||||||
| • Physical hazard | Tonnes | 0 | – | – | N/A | – | – | |||||||||||||||||||
| Substances leaving facilities as products, or part of products | Tonnes | 5 | – | – | 0.003 | – | – | |||||||||||||||||||
| • Human health hazard | Tonnes | 5 | – | – | N/A | – | – | |||||||||||||||||||
| • Environmental hazard | Tonnes | 0 | – | – | N/A | – | – | |||||||||||||||||||
| • Physical hazard | Tonnes | 0 | – | – | N/A | – | – | |||||||||||||||||||
2. If a material belongs to more than one main hazard class, the weight of the substance is reported in both hazard classes. Consequently, the sum of the sub-categories exceeds the total. | ||||||||||||||||||||||||||
Identified IRO | Category | Value chain | ||||||
Availability and deterioration of water resources | | •Upstream •Own operations •Downstream | ||||||
Positive impact Negative impact Opportunity Risk | Sustainability statement / Environment / 2.4 Water | | |||||||||
| Key action to address water | Description and year of completion | Scope of action | Target in place | Overall progress in 2024 and how we track effectiveness | ||||||||||||||||
Water withdrawal savings programme | Efficiency projects at production sites in scope, including optimisation of water use, creating systems for single and multiple reuse and recycling. We systematically map opportunities for water savings to create detailed savings plans, and the programme is planned to run until 2033. | Production sites with high water withdrawals and/or high water-risk/stress area | No | •To track the effectiveness, sites in scope forecast expected water withdrawals and implement water savings initiatives. Water savings are registered per initiative via an internal dashboard. •Total water savings in 2024 amounted to 105,600 m3, of which 51,000 m3 was in areas of high water-stress and/or water risk. | ||||||||||||||||
Engaging priority suppliers | Engaging priority suppliers on their water impacts through a capability-building programme. Planned for 2025-2033 | Key suppliers to be identified | No | •Action to be initiated in 2025, when processes for tracking effectiveness will be established. | ||||||||||||||||
Taking actions outside of sites | Enhancing water quantity and quality outside of our sites, including replenishing water. Planned for 2025-2033. | Upstream value chain | No | •Action to be initiated in 2025, when processes for tracking effectiveness will be established. | ||||||||||||||||
Saving water through the establishment of district cooling in Kalundborg | Establishment of district cooling at our largest production site in Kalundborg, Denmark, which accounts for half of our total water withdrawals, including phasing out the use of water from Lake Tissø. Industrial collaboration with the Kalundborg Symbiosis, Kalundborg Utility, and Novonesis. Expected completion of construction during 2026. | Production site in Kalundborg, Denmark | No | •Progressed with the construction process, which is expected to be finalised during 2026, with surrounding factories connected from 2026 onwards. •Expected annual water withdrawal savings upon completion estimated at 400,000 m3. | ||||||||||||||||
Doubling wastewater treatment capacity in Kalundborg | Expansion of on-site wastewater treatment operated by Novonesis, doubling the industrial wastewater and biomass treatment capacity. Energy is recovered in the treatment process as part of the Kalundborg Symbiosis. To be completed in 2026. | Production site in Kalundborg, Denmark | No | •Project launched and construction has started. | ||||||||||||||||
| 2.4.1 Water consumption | Unit | 2024 | 2023 | 2022 | ||||||||||
| Total water consumption | 1,000 m3 | 630 | – | – | ||||||||||
• Water withdrawal1 | 1,000 m3 | 5,213 | 4,150 | 3,918 | ||||||||||
• Water discharge | 1,000 m3 | 4,583 | – | – | ||||||||||
| Total water consumption in areas at water risk, including areas of high water stress | 1,000 m3 | 191 | – | – | ||||||||||
• Water withdrawal | 1,000 m3 | 1,217 | – | – | ||||||||||
| Total water recycled and reused | 1,000 m3 | 416 | – | – | ||||||||||
| Water intensity ratio | m3/mDKK | 2.17 | – | – | ||||||||||
1. Water withdrawal was previously reported as 'Water consumption'. | ||||||||||||||
| Sustainability statement / Environment / 2.5 Biodiversity and ecosystems | | |||||||||
Identified IRO | Category | Value chain | ||||||
Reliance on natural resources and ecosystem services | | •Upstream •Own operations | ||||||
Identified IRO | Category | Value chain | ||||||
Reliance on vulnerable species in research | | •Upstream •Own operations | ||||||
Positive impact Negative impact Opportunity Risk | Sustainability statement / Environment / 2.5 Biodiversity and ecosystems | | |||||||||
Key action to address biodiversity and ecosystems | Description and year of completion | Scope of action | Target in place | Overall progress in 2024 and how we track effectiveness | ||||||||||||||||
Reduce impact on water | Reduced impact on water through water withdrawal savings at production sites in scope, together with other actions as detailed in section 2.4 'Water' on page 66. | Own operations and key suppliers | No | •Water withdrawals and water savings are tracked. •For more details, see section 2.4 'Water'. •Process to track effectiveness of supplier engagement to be established during roadmap implementation in 2025. | ||||||||||||||||
Reduce impact on land by addressing deforestation, soil degradation and pollution in supply chain | Avoid degradation of land in our supply chain by ensuring a deforestation free paper and cardboard supply chain, and strive for all glucose to be sourced from regenerative agriculture. | Supply chain | No | •Novo Nordisk’s nature roadmap was endorsed in 2024 and will be implemented from 2025 onwards, during which processes to track effectiveness will be established. | ||||||||||||||||
Reduce impact on biodiversity | Restore biodiversity at key sites, ensuring positive impacts by 2033. Avoid impacts on endangered species. | Own production sites | ||||||||||||||||||
Restoration projects | Initiate restoration projects near key sites by 2033. Develop a global restoration plan linked to our value chain by 2026 to become nature positive by 2045. | Own value chain and beyond | ||||||||||||||||||
Transformation | Through transformative approaches, optimise and replace glucose in API production to bring our glucose land footprint close to zero by 2045. | Own operations | ||||||||||||||||||
Minimise and phase out the use of biological products from vulnerable and endangered species | Minimise and phase out the use of horseshoe crab materials, Tachypleus amebocyte lysate, TAL, and Limulus amebocyte lysate, LAL. The use of lysate from the endangered Chinese horseshoe crab, TAL, has been phased out, and the remaining phase-out of LAL from the vulnerable American horseshoe crab is tentatively expected between 2025 and 2035, with the majority of testing expected to be phased out by 2027. The complete discontinuation depends on regulatory approvals of alternative testing methods. | Own operations | No | •Phase-out of TAL has been completed as of 2023. •Use of LAL in our research areas was discontinued in 2024, and we continue working to phase out use for remaining testing of samples. The recent acceptance by the European Pharmacopoeia and the USP Microbiology Expert Committee of the use of recombinant reagents for relevant testing marked an important milestone towards this goal. | ||||||||||||||||
| Sustainability statement / Environment / 2.6 EU Taxonomy | | |||||||||
| Sustainability statement / Environment / 2.6 EU Taxonomy | | |||||||||
Novo Nordisk adjusted EU Taxonomy overview1 (see section 5, tables 4 a-c for the mandatory reporting templates) | Turnover | CapEx1 | OpEx | ||||||||||||||||||||||||||
| 2024 | 2024 | 2024 | |||||||||||||||||||||||||||
| Environmental objective | Economic activity | (mDKK) | (%) | (mDKK) | (%) | (mDKK) | (%) | ||||||||||||||||||||||
| Total Turnover, CapEx, OpEx | 290,403 | 100 | 57,720 | 100 | 39,933 | 100 | |||||||||||||||||||||||
Taxonomy-non-eligible activities | 0 | 0 | 18,698 | 32 | 38,014 | 95 | |||||||||||||||||||||||
| Climate change mitigation | 7.1 Construction of new buildings | 0 | 0 | 13,050 | 23 | 0 | 0 | ||||||||||||||||||||||
7.2 Renovation of existing buildings | 0 | 0 | 2,336 | 4 | 0 | 0 | |||||||||||||||||||||||
| Pollution prevention and control | 1.2 Manufacture of medicinal products | 290,403 | 100 | 20,142 | 35 | 1,919 | 5 | ||||||||||||||||||||||
Eligible not aligned | 290,403 | 100 | 35,528 | 62 | 1,919 | 5 | |||||||||||||||||||||||
Eligible and aligned | 7.1 Construction of new buildings (in Hillerød and Kalundborg, Denmark) | 0 | 0 | 3,494 | 6 | 0 | 0 | ||||||||||||||||||||||
1. Excluding impact of Catalent acquisition. With the inclusion of Catalent, total CapEx would have been DKK 123,972 million, eligible not aligned CapEx 29% and eligible and aligned CapEx 3%. | |||||||||||||||||||||||||||||
| Sustainability statement / Social information / 3.1 Patient protection and quality of life | | |||||||||
Identified IRO | Category | Value chain | ||||||
Improving quality of life through medicines |  | •Downstream | ||||||
Potential new discoveries to serve patient needs |  | •Own operations •Downstream | ||||||
Identified IRO | Category | Value chain | ||||||
Reducing and preventing serious chronic diseases | | •Downstream | ||||||
Positive impact  Negative impact Opportunity
  Risk
Risk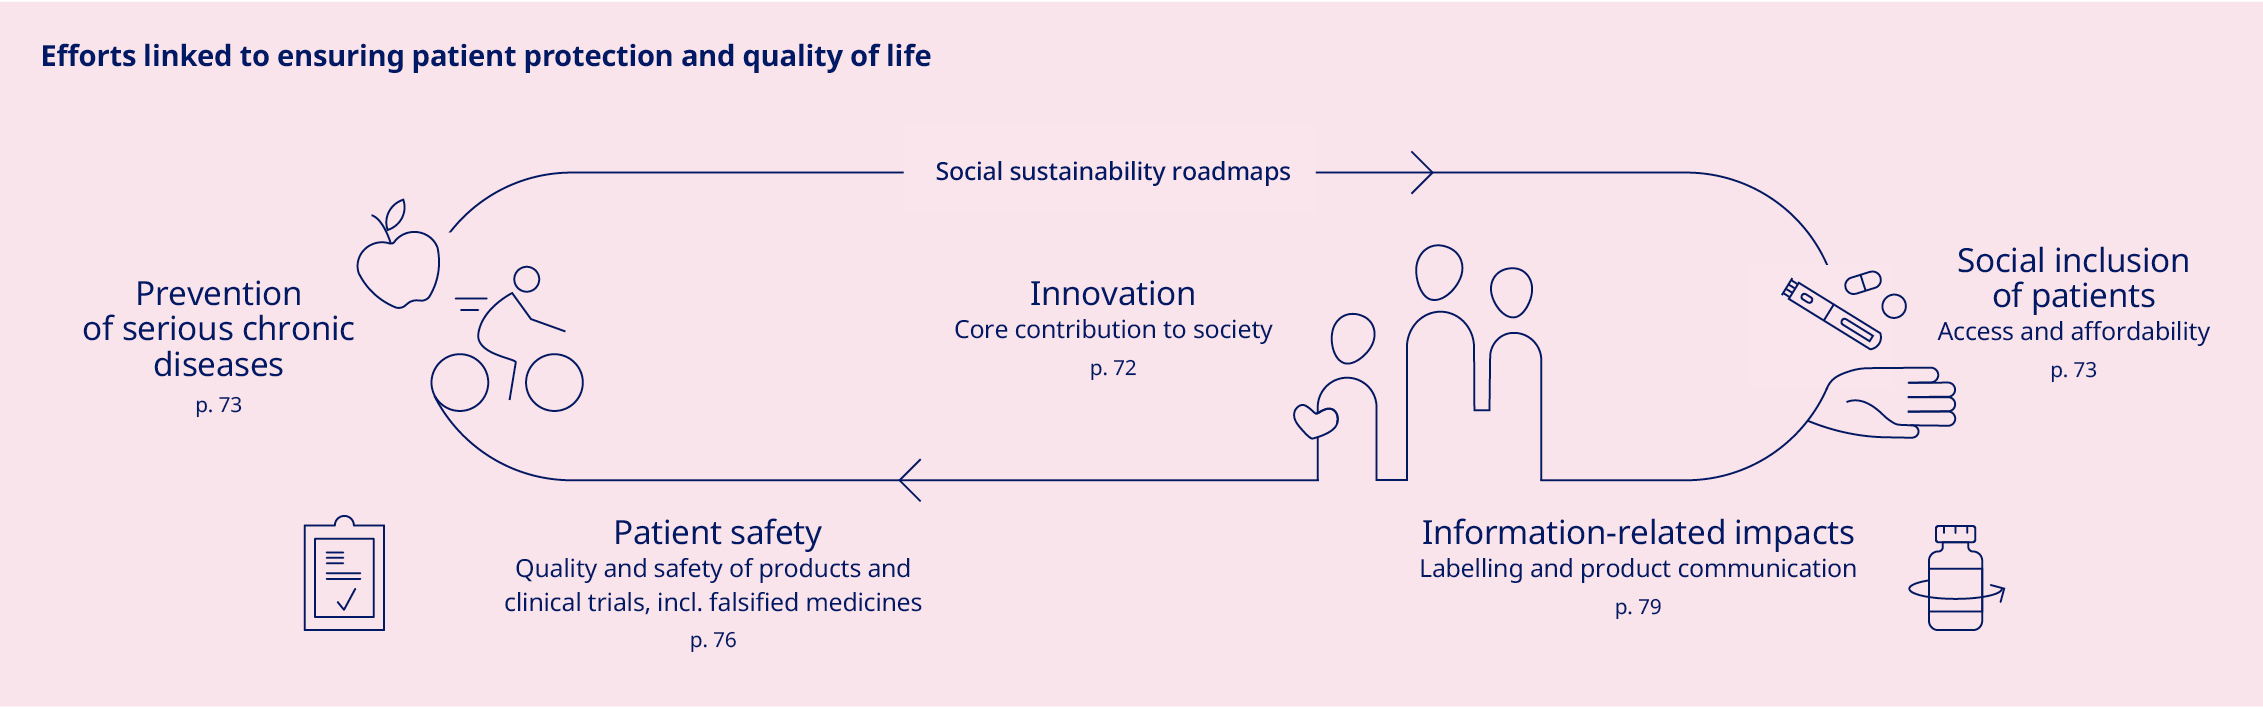
Identified IRO | Category | Value chain | ||||||
Health equity for vulnerable patients and in clinical trials | | •Own operations •Downstream | ||||||
Potential reputational risks related to access efforts | | •Own operations | ||||||
Identified IRO | Category | Value chain | ||||||
Safe clinical trials and product quality and safety | | •Own operations •Downstream | ||||||
Protection against falsified medicines | | •Downstream | ||||||
Identified IRO | Category | Value chain | ||||||
Protecting clinical trial and patient information | | •Own operations •Downstream | ||||||
Identified IRO | Category | Value chain | ||||||
Potential reputational and regulatory risks | | •Own operations | ||||||
| Sustainability statement / Social information / 3.1 Patient protection and quality of life | | |||||||||
| Key action to address sustainability-related innovation | Description and year of completion | Scope of action | Target in place | Overall progress in 2024 and how we track effectiveness | ||||||||||||||||
Integration of sustainability in product development | Ongoing integration of sustainability in product development and product-related governance. The framework assesses the social and environmental profile across the product's lifecycle to support development decisions and identify areas of improvement across product portfolio. | 40+ products, including R&D pipeline and marketed products | No | •Piloted in five products across five different product development stages and five different therapy areas to test the robustness and applicability of the framework. •Rolled out the framework for +80% of the products in scope and will continue the implementation in 2025. | ||||||||||||||||
| Policy | OneCode | |||||||||||||
| Purpose | Guide on how to act as a company and as individuals | |||||||||||||
Scope | Everyone employed by or working on behalf of Novo Nordisk | |||||||||||||
Most senior level accountable | Executive Management | |||||||||||||
Availability | Externally available: OneCode | |||||||||||||
Applicability across Sustainability statement | •Patient protection and quality of life, page 71 •Own workforce, page 80 •Business conduct, page 90 | |||||||||||||
| Supporting policy documentation | •Position papers (Access to diabetes care and medicine pricing, clinical trials ethics, falsified medicines) •Principles (Data and Al ethics, processing of personal data) •Standard operating procedure | |||||||||||||
| Sustainability statement / Social / 3.1 Patient protection and quality of life | | |||||||||
Key actions to address prevention | Description and year of completion | Scope of action | Target in place | Overall progress in 2024 and how we track effectiveness | ||||||||||||||||
Partnership with UNICEF | Partnership with UNICEF to prevent childhood overweight and obesity by building healthy environments that enable and empower children to eat well and be active. Partnership runs until 2026. | Primary focus is on Brazil, Colombia, Mexico, and Indonesia | No | •Roll-out of programmatic activities by UNICEF, for example strengthening nutrition education in schools and promoting use of food labelling. •UNICEF evaluates effectiveness against KPIs covering both indirect and direct impacts of the programmatic activities and report these in a publicly available report. | ||||||||||||||||
| Cities for Better Health | Global network of prevention partnerships at city level, addressing three core challenges to drive better health in cities: healthy food, physical activity and sustainable financing models to ensure ongoing funding. | 51 cities across the world | No | •In 2024, a new childhood obesity prevention initiative, The Childhood Obesity Prevention Initiative (COPI), was launched in six cities across Brazil, Canada, France, Japan, South Africa and Spain to accelerate the prevention of childhood obesity in disadvantaged urban communities. •In addition, 15 affiliates received technical and financial support to start local prevention initiatives. •A monitoring and evaluation framework is used to assess improved health-related outcomes. | ||||||||||||||||
Transformational Prevention Unit (TPU) | Develop scientific and scalable commercial solutions that predict and pre-empt obesity and its consequences for those at greatest risk. Established in 2023, the TPU is committed to building multi-sector partnerships with the ambition to support overall prevention efforts with substantial societal value, including socially disadvantaged groups. | Individuals globally with higher risk of obesity | No | •Combining scientific insights with clinical, as well as public health data, with the aim to develop tailored and targeted interventions that meet specific individual and societal needs. •The tailored approach aims to enable earlier and more accessible prediction of health and disease, improving patient outcomes and minimising unnecessary treatments and reducing healthcare costs. | ||||||||||||||||
| Sustainability statement / Social / 3.1 Patient protection and quality of life | | |||||||||
| Key actions to address access to medicines | Description and year of completion | Scope of action | Target in place | Overall progress in 2024 and how we track effectiveness | ||||||||||||||||
Ringfenced volumes Wegovy® | A proportion of Wegovy® volumes in each launch market is ringfenced for access pathways such as public reimbursement, public institution purchase or other patient access and support programmes. The focus is to improve health equity and provide affordable care. | People with high medical need and low socioeconomic status | No | •Seven countries have agreements in place for access pathways such as public reimbursement, individual reimbursement or private insurance: UK, Japan, Switzerland, Qatar, Iceland, Norway, and Canada. | ||||||||||||||||
| Access to Insulin Commitment | A ceiling price of USD 3 per vial in low- and middle-income countries around the world and USD 2 per vial for organisations providing relief in humanitarian settings. | 77 low- and middle-income countries | No | •The patients reached through the Commitment are a part of the overall metric on vulnerable patients with diabetes reached through Novo Nordisk Diabetes care products in 2024. | ||||||||||||||||
Changing Diabetes® in Children | Public-private partnership founded in 2009 to provide diabetes care to children and youth with type 1 diabetes living in low and middle-income countries. This includes free life-saving medicine, blood glucose monitoring equipment and medical supplies for young people under the age of 25. | 30 countries across Africa, Middle East, Asia and South America | Yes | •An accumulate 64,743 children and youth have been reached through Changing Diabetes® in Children. •Patient education and healthcare capacity-building supported across more than 500 clinics. | ||||||||||||||||
iCARE business model | Improve access to diabetes care to vulnerable populations. Implementation is integrated in affiliates' business strategies and targets through four main building blocks of health equity focused diabetes management: capacity, affordability, reach, and empowerment. | 49 countries in Sub-Saharan Africa, and Indonesia | No | •Expansion of iCARE business model to Indonesia. •Served 433 thousand people with diabetes with insulin and trained 3,778 healthcare professionals through capacity building programmes through partnerships. •We assess effectiveness together with our partners. | ||||||||||||||||
| Human Thermal Solution (HITS) | New flexible storage options for two Novo Nordisk human insulin products: Actrapid® and Insulatard®, making Novo Nordisk the first insulin manufacturer to introduce flexible storage options for people with diabetes in settings where refrigeration is a challenge. | All countries where Actrapid® and Insulatard® are launched | No | •38 countries have received approvals of label update. •Expanding to all countries where Actrapid® and Insulatard® are launched depends on country approvals. | ||||||||||||||||
| Access Innovation Incubator | Identification of new and innovative solutions to support people with diabetes. Solutions include a global partnership with MedtronicLABS to scale a digital patient pathway for diabetes management in three African countries. Our Senselet partnership in Ethiopia strengthens supply chain capacity through higher education and on-the-job training. | Ghana, Kenya, Rwanda, Ethiopia | No | •To date, the MedtronicLABS partnership has supported the enrolment of approximately 22,380 patients across 27 reference centres in three African countries. •To date, Senselet has supported more than 1,000 front-line workers and 900 academics to receive training in healthcare supply chain management. •From 2025 onwards, these initiatives will be transitioned and integrated into the iCARE business model to ensure alignment with local and regional strategies and activities. | ||||||||||||||||
| Collaboration with World Diabetes Foundation | Donations to the independent and non-profit foundation, World Diabetes Foundation (WDF), to improve diabetes care by strengthening national health systems as well as primary prevention. | Low and middle-income countries | No | •In 2024, donations to World Diabetes Foundation (WDF) reached DKK 120 million. | ||||||||||||||||
| Partnering for Change programme | Public-private knowledge-partnership between the International Committee of the Red Cross, London School of Hygiene & Tropical Medicine and the Danish Red Cross to address the growing need for chronic disease treatment for people in humanitarian crisis areas. | Lebanon and Iraq | No | •11 peer-reviewed research publications, informing humanitarian efforts. •Support handbook with guidance to patients in times of crises where continuity in care is disrupted. •The partnership is ending in 2024 but the Red Cross is staying on the ground despite the escalating crises in Lebanon. New commitment is in development. | ||||||||||||||||
| Affordability programmes in the US | Creating comprehensive, affordable patient access by focusing our efforts on key levers: •Ensure affordable access to Novo Nordisk products to address challenges within the complex US healthcare system. •Increase product access among low-income population and/or individuals with disabilities through Medicaid. •Continue to offer programmes to maintain insulin affordability. •Support vulnerable patient populations with free products across Diabetes and Rare Disease portfolios through Novo Nordisk’s patient assistance programmes. | United States | No | •In 2024, 80% of US patients with insurance coverage for Ozempic® or Wegovy® paid USD 25 or less for each prescription, and almost 90% of US patients paid USD 50 or less. •Substantially increased access to Wegovy® for Medicaid eligible patients with lower incomes and/or disabilities, which now accounts for 10% of Novo Nordisk’s US Wegovy® sales. •Upheld 5+ year commitment to provide diverse insulin affordability support options, including MyInsulinRx™ programme, unbranded biologic and human insulin treatment options. •Continued commitment of long-standing patient assistance programme to support eligible patients. •Visit novocare.com for more information on our affordability programmes. | ||||||||||||||||
| Sustainability statement / Social / 3.1 Patient protection and quality of life | | |||||||||
3.1.1 Patients reached with Novo Nordisk's products | Unit | 2024 | 2023 | 2022 | ||||||||||
Patients reached with Novo Nordisk's Diabetes and Obesity care products | Number in millions | 45.2 | 41.6 | 36.9 | ||||||||||
| Patients reached with Novo Nordisk's Diabetes care products | Number in millions | 43.0 | 40.5 | 36.3 | ||||||||||
| Patients reached with Novo Nordisk's Obesity care products | Number in millions | 2.2 | 1.1 | 0.6 | ||||||||||
Vulnerable patients reached with Diabetes care products1 | Number in millions | 8.4 | 8.8 | – | ||||||||||
3.1.2 Changing Diabetes® in children | Unit | 2024 | 2023 | 2022 | ||||||||||
Children reached through the Changing Diabetes® in children programme | Number | 64,743 | 52,249 | 41,033 | ||||||||||
2030 target | Number | 100,000 | ||||||||||||
3.1.3. Donations and other contributions | Unit | 2024 | 2023 | 2022 | ||||||||||
| Total donations and other contributions | mDKK | 146 | 138 | 126 | ||||||||||
| World Diabetes Foundation (WDF) | mDKK | 120 | 119 | 93 | ||||||||||
| Novo Nordisk Haemophilia Foundation (NNHF) | mDKK | 26 | 19 | 33 | ||||||||||
| Sustainability statement / Social / 3.1 Patient protection and quality of life | | |||||||||
| Key action to address access to clinical trials | Description and year of completion | Scope of action | Target in place | Overall progress in 2024 and how we track effectiveness | ||||||||||||||||
| Promotion of DE&I in clinical trials | Framework for integrating DE&I in clinical trial planning and execution to ensure that clinical trial participants are representative of the patient population. | Global trials on a fit-for-purpose basis | No | •Current focus has primarily been on US population. •Global actions include launch of a training programme in order to upskill relevant staff. •We participate in a public-private partnership (IHI READI) that aims to improve representation and inclusion in clinical research. •Overall effectiveness is assessed on an ongoing basis and we continuously assess how to optimise internal processes, including technology and data capture. | ||||||||||||||||
Integration of decentralised trials (DCT) elements | Integrating DCT elements to help improve access to clinical trials, a more diverse pool of participants and a higher retention rate, for example by allowing assessments to be conducted at patients’ preferred location. | Global trials on a fit-for-purpose basis | No | •In 2024, over two thirds of our active phase 2-3 clinical trials included one or more DCT elements. •We actively engage with regulatory bodies, clinical research sites and patient advocacy groups to address the various barriers for implementing DCT elements in clinical studies. | ||||||||||||||||
| Sustainability statement / Social / 3.1 Patient protection and quality of life | | |||||||||
| Key actions to address quality and safety | Description and year of completion | Scope of action | Target in place | Overall progress in 2024 and how we track effectiveness | ||||||||||||||||
| Mitigating risks related to product safety and quality signals | Monitoring and using safety information from patients to take timely and appropriate action to improve product quality and safety. Outcomes are monitored in our risk management system and a risk management plan is prepared in accordance with regulatory requirements. | All Novo Nordisk products with marketing authorisation and products in Novo Nordisk sponsored clinical trials | No | •A safety committee with members from all relevant functional areas is established prior to any clinical investigation of a new pharmaceutical product or medical device, providing assessments of safety data throughout the product or device’s life cycle. •Number of product recalls and failed inspections are reported to track effectiveness. In 2024, we tracked three product recalls and 0 failed inspections. | ||||||||||||||||
Mitigating safety risks in clinical trials | Detailed protocol for each clinical research activity based on scientific methodology and ethical considerations, to be approved by an Independent Ethics Committee, Institutional Review Board or other appropriate bodies, as well as by regulatory authorities prior to study start. | All Novo Nordisk sponsored clinical trials | No | •Relevant safety information is continuously assessed during Novo Nordisk-sponsored clinical research activities and appropriate actions taken if risks outweigh potential benefits. In the event of any clinical research-related injury, participants are compensated according to domestic laws. | ||||||||||||||||
3.1.4. Product recalls and failed inspections | Unit | 2024 | 2023 | 2022 | ||||||||||
| Product recalls | Number | 3 | 2 | 3 | ||||||||||
| Failed inspections | Number | 0 | 0 | 0 | ||||||||||
| Sustainability statement / Social / 3.1 Patient protection and quality of life | | |||||||||
Key actions to address falsified medicines | Description and year of completion | Scope of action | Target in place | Overall progress in 2024 and how we track effectiveness | ||||||||||||||||
Product protection end-to-end solutions | Applying relevant security features based on risk assessment and regulatory requirements, including reinforcing supply chain integrity through security specifications in distribution and warehouse contracts. | Global operations and downstream value chain | No | •In 2024, we continued to review the security of our supply chain including agile testing solutions and rapid testing devices to support swift identification of falsified medicines. •We continuously review our approach to the protective features of products, from overt to covert solutions. | ||||||||||||||||
Awareness campaigns and training | Awareness campaigns and onboarding programme to prevent patients from buying medicines outside legitimate channels, including more information for healthcare professionals. | Global operations and downstream value chain | No | •Rolled out a dedicated, onboarding programme to over 1,600 employees in relevant functions. •Launch of awareness programme for law enforcement agencies enabling an increase in seizures of falsified medicines. •Launch of other external awareness campaigns for patients via social media and our website. | ||||||||||||||||
| Sustainability statement / Social / 3.1 Patient protection and quality of life | | |||||||||
Key actions to address information-related impacts | Description and year of completion | Scope of action | Target in place | Overall progress in 2024 and how we track effectiveness | ||||||||||||||||
Improving transparency of our Patient Information and Informed Consent forms (PIIC) | Update of PIIC forms to enhance general transparency with respect to i) engaging in Novo Nordisk sponsored clinical trials and ii) how privacy rights of patients are protected. Project expected to be completed by May 2025. | Intended for use in global clinical trials. Will be adaptable to local deviations | No | •We continuously assess improvement areas when it comes to privacy rights of patients. | ||||||||||||||||
Communicating and raising awareness of informed use of our products | All promotional materials for our respective products undergo robust legal, medical and regulatory review processes. We continuously strengthen our guidance and communication to ensure healthcare professionals are equipped with appropriate information about our products and the underlying clinical data to make the best decisions for patients. | Global operations related to product communication | No | •Training healthcare professionals on approved indications of our products and key messages around responsible use. •Alignment with authorities to support proactive communication to emphasis the indication of our products. •Field forces and commercial functions in all markets have been provided with clear guidance on how only to engage in conversations for approved labels of our products. | ||||||||||||||||
| Sustainability statement / Social / 3.2 Own workforce | | |||||||||
Identified IRO | Category | Value chain | ||||||
Employee benefits and flexible working conditions | | •Own operations | ||||||
Potential human rights incidents | | •Own operations | ||||||
Identified IRO | Category | Value chain | ||||||
Healthy and safe work environment | | •Own operations | ||||||
Positive impact Negative impact Opportunity Risk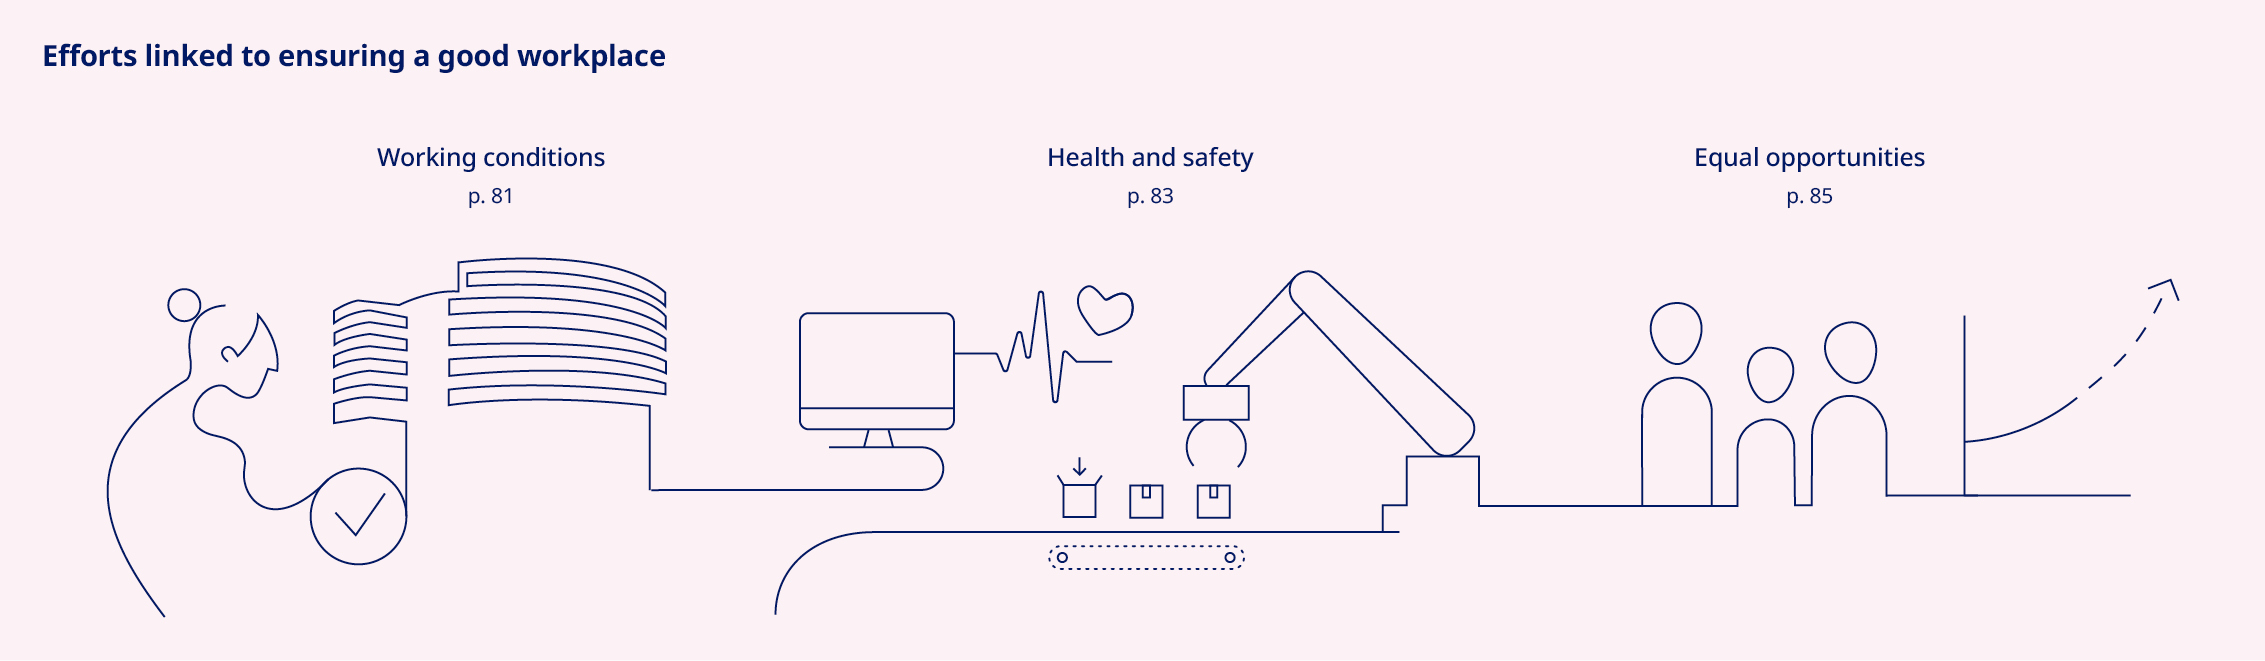
Identified IRO | Category | Value chain | ||||||
Equal opportunities fostering innovation | | •Own operations | ||||||
Identified IRO | Category | Value chain | ||||||
Attracting talent to enable continued innovation | | •Own operations | ||||||
| Sustainability statement / Social / 3.2 Own workforce | | |||||||||
| Policy | Labour Code of Conduct | |||||||||||||
| Purpose | Minimum labour standards for our employees | |||||||||||||
Scope | All Novo Nordisk employees | |||||||||||||
Most senior level accountable | Executive Management | |||||||||||||
Availability | Externally available: Novo Nordisk Labour Code of Conduct | |||||||||||||
Applicability across Sustainability statement | •Own Workforce, p. 80 | |||||||||||||
Supporting policy documentation | •Anti-harassment Framework | |||||||||||||
| Sustainability statement / Social / 3.2 Own workforce | | |||||||||
| Key actions to address working conditions in own workforce | Description and year of completion | Scope of action | Target in place | Overall progress in 2024 and how we track effectiveness | ||||||||||||||||
Mitigating risks related to own workforce or potential human rights breaches | Risks are assessed and addressed through mitigating actions on an ongoing basis, in accordance with the enterprise risk management framework. Any remedy is applicable in accordance with, local, legal requirements. | Global operations | No | •Risk mitigation efforts are carried out continuously, and includes support to relevant affiliates on compliance with for example local legislation. •With respect to human rights efforts, we are in the process of upskilling our workforce to strengthen our due diligence for our own operations. | ||||||||||||||||
| Due diligence assessment of Labour Code of Conduct | In 2024, we have initiated a due diligence assessment of our Labour Code of Conduct to evaluate the effectiveness of its global implementation since its launch in 2019 to ensure we protect our working condition standards. To be completed in 2025. | Global operations | No | •The finalisation of the assessment in 2025 will provide insights for potential future action plans. | ||||||||||||||||
| Permanent employees (headcount) | Temporary employees (headcount) | Non-guaranteed hours employees (headcount) | Total | |||||||||||||||||||||||||||||||||||||||||||||||
3.2.2 Characteristics of Novo Nordisk's employees2 | Unit | 2024 | 2023 | 2022 | 2024 | 2023 | 2022 | 2024 | 2023 | 2022 | 2024 | 2023 | 2022 | |||||||||||||||||||||||||||||||||||||
Men | Number | 34,720 | – | – | 2,696 | – | – | 0 | – | – | 37,416 | – | – | |||||||||||||||||||||||||||||||||||||
Women | Number | 33,920 | – | – | 2,791 | – | – | 0 | – | – | 36,711 | – | – | |||||||||||||||||||||||||||||||||||||
Other/not reported | Number | 29 | – | – | 0 | – | – | 0 | – | – | 29 | – | – | |||||||||||||||||||||||||||||||||||||
2. Total headcount of 77,349 as per note 2.4 'Employee cost' on page 110 in the Consolidated financial statements. The variance of 3,193 employees is due to Catalent employees not being included. | ||||||||||||||||||||||||||||||||||||||||||||||||||
3.2.3 Employees and employee turnover3 | Unit | 2024 | 2023 | 2022 | ||||||||||
Total number of employees (FTEs) – excluding Catalent | FTEs | 73,109 | 63,370 | 54,393 | ||||||||||
Total number of employees (headcount) – including Catalent | Number | 77,349 | 64,319 | 55,185 | ||||||||||
Total number of employees (headcount) – excluding Catalent | Number | 74,156 | 64,319 | 55,185 | ||||||||||
• Denmark | Number | 34,185 | 28,692 | 22,916 | ||||||||||
• EMEA (Europe, the Middle East and Africa), excluding Denmark | Number | 9,928 | 8,808 | 7,954 | ||||||||||
• North America (US, Canada) | Number | 9,279 | 8,315 | 7,250 | ||||||||||
• Region China (Mainland China, Hong Kong, Taiwan) | Number | 6,977 | 6,485 | 6,148 | ||||||||||
• Rest of World (all other countries) | Number | 13,787 | 12,019 | 10,917 | ||||||||||
Number of leavers | Number | 3,574 | – | – | ||||||||||
Employee turnover | % | 5.5 | 5.5 | 8.2 | ||||||||||
3. Total headcount of 77,349 as per note 2.4 'Employee cost' on page 110 in the Consolidated financial statements. The variance of 3,193 employees is due to Catalent employees not being included. | ||||||||||||||
3.2.1 Enterprise Evolve score | Unit | 2024 | 2023 | 2022 | ||||||||||
Enterprise Evolve score | % | 85 | 86 | 85 | ||||||||||
3.2.4 Collective bargaining agreements and workers' representatives coverage | Unit | 2024 | 2023 | 2022 | ||||||||||
Number of collective bargaining agreements – Denmark | Number | 5 | – | – | ||||||||||
Percentage of employees covered by collective bargaining agreements and workers' representatives – Denmark | % | 32 | – | – | ||||||||||
| Sustainability statement / Social / 3.2 Own workforce | | |||||||||
3.2.5 Incidents, complaints and severe human rights impacts | Unit | 2024 | 2023 | 2022 | ||||||||||
Substantiated people-related cases | Number | 167 | – | – | ||||||||||
• Hereof substantiated cases of harassment, including discrimination | Number | 139 | – | – | ||||||||||
• Hereof substantiated cases of severe human rights incidents | Number | 0 | – | – | ||||||||||
• Hereof breaches of the UNGPs | Number | 0 | – | – | ||||||||||
• Hereof number of complaints filed against Novo Nordisk to National Contact Points for OECD Multinational Enterprises | Number | 0 | – | – | ||||||||||
Amount of material fines, penalties and compensation related to the above mentioned incidents | mDKK | 0 | – | – | ||||||||||
| Policy | Health and Safety | |||||||||||||
| Purpose | Ensure safety, mental and physical wellbeing | |||||||||||||
Scope | Applies across all operations, including contractors | |||||||||||||
Most senior level accountable | Executive Management | |||||||||||||
Availability | Externally available: Health and Safety | |||||||||||||
Applicability across Sustainability statement | •Own workforce, page 80 | |||||||||||||
| Supporting policy documentation | •Local health and safety instructions | |||||||||||||
| Sustainability statement / Social / 3.2 Own workforce | | |||||||||
| Key actions to address health and safety | Description and year of completion | Scope of action | Target in place | Overall progress in 2024 and how we track effectiveness | ||||||||||||||||
| Local health and safety action plans | A bottom-up management review is conducted on an annual basis to assess the effectiveness of the health and safety management system. Each business area has committed to a local health and safety plan addressing all strategic focus areas and relevant risks associated. Any remedy is provided based on local, legal requirements and global support options are made available for affected employees. | Global operations | Yes | •Safety: Performance against health and safety metrics include 173 recordable work-related accidents. Several actions were taken to ensure that safety is systematically addressed. •Mental wellbeing: 13.8% of employees reported symptoms of stress. Areas with a high level of stress symptoms have been offered support from an organisational psychologist, focusing on organisational aspects, psycho-social factors and leadership. •Physical wellbeing: 6.8% reported symptoms of work-related physical pain. Targeted efforts in areas with a high level of work-related pain has been piloted supporting local business areas to address root causes systematically. Further, interventions in Denmark and competency building on work-related pain at global production sites have been conducted. •NovoHealth: The employee health promotion programme focuses on physical activity, healthy eating, individual mental wellbeing, nicotine cessation, weight management and health checks. | ||||||||||||||||
| Specific actions related to health and safety incidents | In response to expansion-related health and safety risks, further measures have been implemented in 2024 to prevent fire-related accidents in the future, including mapping of high-risk activities, establishing work permit offices, and review of emergency response plans. | Global operations, with a focus on capacity expansion projects | No | •New safety KPI was developed, applicable from 2025, expanding the scope of reported accidents and investigations to further prevent incidents across 10 high-risk hazards, including activities related to working at heights and hot work. | ||||||||||||||||
3.2.6 Health and safety (own employees) | Unit | 2024 | 2023 | 2022 | Year-on-year reduction target | |||||||||||||||
| Workforce covered by health and safety management system (headcount) | % | 100 | – | – | ||||||||||||||||
Recordable work-related accidents | Number | 173 | 153 | 128 | ||||||||||||||||
Rate of recordable work-related accidents4 | Accidents per million hours worked | 1.2 | 1.3 | 1.3 | 10% | |||||||||||||||
Fatalities as result of work-related injuries | Number | 0 | 1 | 2 | ||||||||||||||||
Employees reporting symptoms of stress | % | 13.8 | 13.8 | 13.8 | 10% | |||||||||||||||
Employees reporting symptoms of work-related physical pain | % | 6.8 | 7.1 | 7.8 | 5% | |||||||||||||||
4. Rate of recordable work-related accidents was previously reported as Frequency of occupational accidents. Figures for 2022 and 2023 have been restated from 1.5 accidents per million hours worked in both years. | ||||||||||||||||||||
| Sustainability statement / Social / 3.2 Own workforce | | |||||||||
| Policy | Diversity and Inclusion | |||||||||||||
| Purpose | Guides our actions to promote equal opportunities | |||||||||||||
Scope | All Novo Nordisk employees | |||||||||||||
Most senior level accountable | Executive Management | |||||||||||||
Availability | Externally available: Diversity and inclusion policy | |||||||||||||
Applicability across Sustainability statement | •Own workforce, page 80 | |||||||||||||
| Sustainability statement / Social / 3.2 Own workforce | | |||||||||
| Key actions to address equal treatment and opportunities | Description and year of completion | Scope of action | Target in place | Overall progress in 2024 and how we track effectiveness | ||||||||||||||||
| Mitigate bias through equal pay reviews | Ensure that individuals with similar roles and responsibilities are compensated equitably, regardless of background, gender, or ethnicity. Equal pay reviews are conducted on a quarterly basis with corrective actions for confirmed equal pay risk cases. | Global operations, excluding US and Canada following own processes | No | •In 2024, out of the around 62 thousand positions covered in the pay review, we identified 0.13% – compared to 0.6% in 2023 – with an equal pay gap and we are taking corrective actions. •The equal pay review goes beyond gender and considers various parameters to identify gaps using employee’s job level, job family, tenure, country. | ||||||||||||||||
| Inclusive workplace through balanced gender representation | Striving for balanced gender representation across managerial levels, through for example ensuring a diverse slate of candidates, diverse recruitment panel and pipeline of diverse talents. | Global operations | Yes | •Men account for 54% in leadership positions and 58% in senior leadership positions. •Women account for 46% in leadership positions and 42% in senior leadership positions. | ||||||||||||||||
| Inclusive workplace through flexible working policies | Improved minimum global standards for paid maternity leave and paid parental leave for non-birthing parents as well as paid leave for employees to handle serious health conditions of their dependents. Changes are applicable from January 2025. | Global operations | No | •Introduction of a global minimum standard of parental leave within the first year of becoming a parent extended from 8 to 14 weeks for all non-birthing parents globally. •Introduction of a global minimum standard of 2 weeks of paid leave annually for employees who need time to handle a serious health condition of dependents. | ||||||||||||||||
Roll-out of training offerings | Employee training based on target group, qualifications and job requirements to inspire positive leadership habits and empower potential at all levels. Training offerings cover both compliance-related training but also development options through global talent and development programmes, virtual and face-to-face skill courses, and online learning content. | Global operations | No | •In 2024, new compliance-related training was established regarding product quality, safety and efficacy, impacting around 6,000 managers. •Approximately 4,000 out of nearly 9,000 leaders engaged in our development programmes, and about 2,000 employees completed global strategic capability development programmes. •More than 40,000 times employees and leaders have completed a learning item online to help develop specific skills. •Progress of training programmes are monitored through voluntary surveys following course completion. | ||||||||||||||||
| Sustainability statement / Social / 3.2 Own workforce | | |||||||||
Men | Women | |||||||||||||||||||||||||
3.2.7 Diversity metrics – Management levels | Unit | 2024 | 2023 | 2022 | 2024 | 2023 | 2022 | |||||||||||||||||||
Number of employees (headcount) at senior leadership – CEO, EVP, SVP | Number | 38 | – | – | 22 | – | – | |||||||||||||||||||
Percentage of employees (headcount) at senior leadership – CEO, EVP, SVP | % | 63 | 64 | 71 | 37 | 36 | 29 | |||||||||||||||||||
Number of employees (headcount) at senior leadership – CVP, VP | Number | 466 | – | – | 339 | – | – | |||||||||||||||||||
Percentage of employees (headcount) at senior leadership – CVP, VP | % | 58 | 59 | 60 | 42 | 41 | 40 | |||||||||||||||||||
Number of employees (headcount) at other leadership levels – Director, manager, team leader | Number | 4,726 | – | – | 4,171 | – | – | |||||||||||||||||||
Percentage of employees (headcount) at other leadership levels – Director, manager, team leader | % | 53 | 54 | 55 | 47 | 46 | 45 | |||||||||||||||||||
Gender in leadership positions (overall) | % | 54 | 54 | 56 | 46 | 46 | 44 | |||||||||||||||||||
Gender in senior leadership positions (CEO, EVP, SVP, CVP and VP) | % | 58 | 59 | 61 | 42 | 41 | 39 | |||||||||||||||||||
| Target: minimum 45% men and 45% women | ||||||||||||||||||||||||||
Gender on the Board of Directors | % | 50 | 50 | 54 | 50 | 50 | 46 | |||||||||||||||||||
Gender on the Board of Directors without employee representatives | % | 62 | 62 | 67 | 38 | 38 | 33 | |||||||||||||||||||
3.2.8 Remuneration metrics | Unit | 2024 | 2023 | 2022 | ||||||||||
| Gender pay gap | % | (3)5 | – | – | ||||||||||
| Annual total remuneration ratio | Ratio | 63 | – | – | ||||||||||
5. Negative gender pay gap shows a pay gap in favour of women. | ||||||||||||||
3.2.9 Employees by age group | Unit | 2024 | 2023 | 2022 | ||||||||||
| Under 30 years old | Headcount | 11,538 | – | – | ||||||||||
| % | 16 | 17 | 15 | |||||||||||
| Between 30 and 50 years old | Headcount | 48,429 | – | – | ||||||||||
| % | 65 | 64 | 65 | |||||||||||
| Over 50 years old | Headcount | 14,189 | – | – | ||||||||||
| % | 19 | 19 | 20 | |||||||||||
| Sustainability statement / Social / 3.3 Workers in the value chain | | |||||||||
Identified IRO | Category | Value chain | ||||||
Protecting working conditions and human rights | | •Upstream •Downstream | ||||||
Positive impact Negative impact Opportunity Risk| Policy | Responsible Sourcing Standards | |||||||||||||
| Purpose | Expected minimum requirements for our partners | |||||||||||||
Scope | All global suppliers providing goods or services to Novo Nordisk | |||||||||||||
Most senior level accountable | Senior Vice President of Global Solutions | |||||||||||||
Availability | Externally available: Responsible Sourcing Standards | |||||||||||||
Applicability across Sustainability statement | •Workers in the value chain, page 88 •Business conduct, page 90 | |||||||||||||
| Sustainability statement / Social / 3.3 Workers in the value chain | | |||||||||
| Policy | Human Rights Commitment | |||||||||||||
| Purpose | Guiding all behaviour with respect to human rights | |||||||||||||
Scope | All individuals who can be impacted by Novo Nordisk's activities and business relationships | |||||||||||||
Most senior level accountable | Chief compliance officer | |||||||||||||
Availability | Externally available: Novo Nordisk Human Rights Commitment | |||||||||||||
Applicability across Sustainability statement | •Patient protection and quality of life, page 71 •Own workforce, page 80 •Workers in the value chain, page 88 •Business conduct, page 90 | |||||||||||||
Key actions to address workers in the value chain | Description and year of completion | Scope of action | Target in place | Overall progress in 2024 and how we track effectiveness | ||||||||||||||||
| Strengthened the Responsible Sourcing Standard | Update of policy from October 2024, making it mandatory for all new contracts going forward. To initiate the process we focus on larger contracts and strategic suppliers. Policy requirements are aligned with external legal firm and CSDDD. | Global suppliers | No | •Since October, we have started to work in a phased approach to ensure that all our suppliers globally adopt Responsible Sourcing Standards in new or renegotiated contracts. We aim to complete our efforts by 2027. Effectiveness and progress will be assessed continuously. | ||||||||||||||||
| Sustainability statement / Governance / 4.1 Business conduct | | |||||||||
Identified IRO | Category | Value chain | ||||||
Ethical working culture through Novo Nordisk Way |  | •Own operations | ||||||
Identified IRO | Category | Value chain | ||||||
Interacting with all stakeholders in accordance with our business ethics standards |  | •Upstream •Own operations •Downstream | ||||||
Positive impact Negative impact  Opportunity
  Risk
RiskIdentified IRO | Category | Value chain | ||||||
Promoting public health | | •Downstream | ||||||
Identified IRO | Category | Value chain | ||||||
Upholding high bioethical standards | | •Own operations | ||||||
| Identified IRO | Category | Value chain | ||||||
Reliance on animals in research | | •Upstream •Own operations | ||||||
| 4.1.1 Facilitations of the Novo Nordisk Way | Unit | 2024 | 2023 | 2022 | ||||||||||
| Facilitations of the Novo Nordisk Way | Number | 51 | 42 | 36 | ||||||||||
| Sustainability statement / Governance / 4.1 Business conduct | | |||||||||
| 4.1.2 Prevention and detection of corruption and bribery | Unit | 2024 | 2023 | 2022 | ||||||||||
Employees trained in ethics and compliance | % | 99 | 99 | 99 | ||||||||||
| 4.1.3 Incidents of corruption or bribery | Unit | 2024 | 2023 | 2022 | ||||||||||
Convictions for violation of anti-corruption and anti-bribery laws | Number | 0 | 0 | 0 | ||||||||||
| Policy | Anti-retaliation policy | |||||||||||||
| Purpose | Protection of any persons who report or participate in an investigation in good faith | |||||||||||||
Scope | Any user of the Compliance Hotline, whether employees or external stakeholders | |||||||||||||
Most senior level accountable | Chief Compliance Officer | |||||||||||||
Availability | Externally available: Compliance Hotline | |||||||||||||
| Applicability across Sustainability statement | •Patient protection and quality of life, page 71 •Own workforce, page 80 •Workers in the value chain, page 88 | |||||||||||||
| Sustainability statement / Governance / 4.1 Business conduct | | |||||||||
4.1.4 Substantiated cases reported within accounting issues, fraud and business ethics matters | Unit | 2024 | 2023 | 2022 | ||||||||||
Substantiated cases reported within accounting issues, fraud and business ethics matters via the Compliance Hotline1 | Number | 242 | 221 | 227 | ||||||||||
| 1. Substantiated cases reported within accounting issues, fraud and business ethics matters was previously reported as Number of substantiated cases reported via the Compliance Hotline. For 2023 and 2022, 314 and 288 cases have been reported, respectively, considering the previous definition. | ||||||||||||||
| Policy | Global procurement policy | |||||||||||||
| Purpose | Ensure good conduct in how we source goods and services, select suppliers and negotiate agreements | |||||||||||||
Scope | All sourced goods and services, excluding those used for manufacturing of Novo Nordisk products | |||||||||||||
Most senior level accountable | Corporate vice president of Corporate Procurement | |||||||||||||
Availability | Externally available: Procurement in Novo Nordisk | |||||||||||||
| Applicability across Sustainability statement | •Business conduct, p. 90 | |||||||||||||
Supporting policy documentation | •Internal standard operating procedure on procurement for manufacturing | |||||||||||||
| 4.1.5 Payment practices | Unit | 2024 | 2023 | 2022 | ||||||||||
Average number of days to pay invoice | Days | 42 | – | – | ||||||||||
• Small suppliers | Days | 24 | – | – | ||||||||||
• Large suppliers | Days | 49 | – | – | ||||||||||
Percentage of payments aligned with standard payment terms | % | 83 | – | – | ||||||||||
• Small suppliers | % | 77 | – | – | ||||||||||
• Large suppliers | % | 84 | – | – | ||||||||||
Outstanding legal proceedings for late payments | Number | 0 | – | – | ||||||||||
| 4.1.6 Supplier audits | Unit | 2024 | 2023 | 2022 | ||||||||||
| Total supplier audits | Number | 429 | 382 | 294 | ||||||||||
| Sustainability statement / Governance / 4.1 Business conduct | | |||||||||
| Key actions to address advocacy | Description and year of completion | Scope of action | Target in place | Overall progress in 2024 and how we track effectiveness | ||||||||||||||||
Presidency of the European Federation of Pharmaceutical Industries and Associations (EFPIA) | Novo Nordisk’s President and CEO Lars Fruergaard Jørgensen is President of EFPIA 2023-2025, focusing on the review of the EU General Pharmaceutical Legislation, advocating for innovation and providing optimal conditions for making new discoveries accessible to patients. | Patients in Europe | No | •Our CEO's presidency of EFPIA supported the collaboration with policy makers, to establish industrial policies aimed at fostering an ecosystem that encourages innovation and prioritises life sciences as a strategic industry. | ||||||||||||||||
| Obesity advocacy | Advocacy through EFPIA Obesity Policy Platform to improve healthcare solutions for people living with obesity, recognise obesity as a relapsing chronic disease and increase knowledge of its financial cost. Recurring collaboration with EFPIA Health Systems Working Group, to address some of the major challenges facing health system resilience. | Patients in Europe | No | •In 2024, Novo Nordisk joined the newly established Obesity Policy Platform. •The Health Systems Working Group has made progress on improving efficiencies between health system resources and fostering collaboration on creating more sustainable health systems. | ||||||||||||||||
| Diabetes advocacy | Advocacy through the European Diabetes Forum for policy change that enables healthcare systems to better manage diabetes care. | Patients in Europe | No | •Campaigned, together with the European cardiovascular community, for cardiovascular disease and diabetes within European policy priorities. | ||||||||||||||||
4.1.7 Trade association membership fees and in-kind political contributions | Unit | 2024 | 2023 | 2022 | ||||||||||
Trade association membership fees | mDKK | 177 | – | – | ||||||||||
| In-kind political contributions made | mDKK | 0 | – | – | ||||||||||
| Sustainability statement / Governance / 4.1 Business conduct | | |||||||||
| Policy | Bioethics policy | |||||||||||||
| Purpose | Guide bioethical behaviour in our research and development | |||||||||||||
Scope | Applies globally | |||||||||||||
Most senior level accountable | Executive management | |||||||||||||
Availability | Externally available: Bioethics | |||||||||||||
| Applicability across Sustainability statement | •Business conduct, page 90 •Patient protection and quality of life, page 71 | |||||||||||||
| Supporting policy documentation | •Position papers (for each bioethical focus area) •Standard operating procedures | |||||||||||||
| 4.1.8 Animals purchased for research | Unit | 2024 | 2023 | 2022 | ||||||||||
| Mice, rats and other rodents | Number | 47,478 | 54,410 | 63,760 | ||||||||||
| Pigs | Number | 615 | 608 | 427 | ||||||||||
| Rabbits | Number | 689 | 289 | 606 | ||||||||||
| Dogs | Number | 126 | 356 | 146 | ||||||||||
| Non-human primates | Number | 366 | 807 | 700 | ||||||||||
| Fish | Number | 0 | 36 | 14,098 | ||||||||||
| Other vertebrates | Number | 10 | 2 | 13 | ||||||||||
| Total animals purchased | Number | 49,284 | 56,508 | 79,750 | ||||||||||
| Sustainability statement / Appendix | | |||||||||
| Disclosure requirement | Data point | SFDR reference | Pillar 3 reference | Benchmark regulation reference | EU Climate Law reference | Section | Page | ||||||||||||||||
| ESRS 2 GOV-1 | 21 (d) | x | x | Sustainability statement | 87 | ||||||||||||||||||
| ESRS 2 GOV-1 | 21 (e) | x | Sustainability statement | 42-44 | |||||||||||||||||||
| ESRS 2 GOV-4 | 30 | x | Sustainability statement | 49 | |||||||||||||||||||
| ESRS 2 SBM-1 | 40 (d) i | x | x | x | Not applicable to NN | - | |||||||||||||||||
| ESRS 2 SBM-1 | 40 (d) ii | x | x | Not applicable to NN | - | ||||||||||||||||||
| ESRS 2 SBM-1 | 40 (d) iii | x | x | Not applicable to NN | - | ||||||||||||||||||
| ESRS 2 SBM-1 | 40 (d) iv | x | Not applicable to NN | - | |||||||||||||||||||
| ESRS E1-1 | 14 | x | Sustainability statement | 55 | |||||||||||||||||||
| ESRS E1-1 | 16 (g) | x | x | Sustainability statement | 55 | ||||||||||||||||||
| ESRS E1-4 | 34 | x | x | x | Sustainability statement | 55, 57, 58 | |||||||||||||||||
| ESRS E1-5 | 38 | x | Sustainability statement | 58, 59 | |||||||||||||||||||
| ESRS E1-5 | 37 | x | Sustainability statement | 58, 59 | |||||||||||||||||||
| ESRS E1-5 | 40-43 | x | Sustainability statement | 58 | |||||||||||||||||||
| ESRS E1-6 | 44 | x | x | x | Sustainability statement | 58 | |||||||||||||||||
| ESRS E1-6 | 53-55 | x | x | x | Sustainability statement | 58 | |||||||||||||||||
| ESRS E1-7 | 56 | x | Not applicable to NN | - | |||||||||||||||||||
| ESRS E1-9 | 66 | x | Not applicable to NN | - | |||||||||||||||||||
| ESRS E1-9 | 66 (a); 66 (c) | x | Not applicable to NN | - | |||||||||||||||||||
| ESRS E1-9 | 67 (c) | x | Not applicable to NN | - | |||||||||||||||||||
| ESRS E1-9 | 69 | x | Not applicable to NN | - | |||||||||||||||||||
| ESRS E2-4 | 28 | x | Not applicable to NN | - | |||||||||||||||||||
| ESRS E3-1 | 9 | x | Sustainability statement | 66 | |||||||||||||||||||
| ESRS E3-1 | 13 | x | Not applicable to NN | - | |||||||||||||||||||
| ESRS E3-1 | 14 | x | Not applicable to NN | - | |||||||||||||||||||
| ESRS E3-4 | 28 (C) | x | Sustainability statement | 66 | |||||||||||||||||||
| ESRS E3-4 | 29 | x | Sustainability statement | 66 | |||||||||||||||||||
ESRS 2- IRO 1 - E4 | 16 (a) i | x | Not applicable to NN | - | |||||||||||||||||||
ESRS 2- IRO 1 - E4 | 16 (b) | x | Not applicable to NN | - | |||||||||||||||||||
ESRS 2- IRO 1 - E4 | 16 (c) | x | Sustainability statement | 67 | |||||||||||||||||||
| ESRS E4-2 | 24 (b) | x | Sustainability statement | 67 | |||||||||||||||||||
| ESRS E4-2 | 24 (c) | x | Not applicable to NN | - | |||||||||||||||||||
| Disclosure requirement | Data point | SFDR reference | Pillar 3 reference | Benchmark regulation reference | EU Climate Law reference | Section | Page | ||||||||||||||||
| ESRS E4-2 | 24 (d) | x | Sustainability statement | 67 | |||||||||||||||||||
| ESRS E5-5 | 37 (d) | x | Sustainability statement | 62, 63 | |||||||||||||||||||
| ESRS E5-5 | 39 | x | Sustainability statement | 62, 63 | |||||||||||||||||||
ESRS 2- SBM 3 - S1 | 14 (f) | x | Sustainability statement | 80 | |||||||||||||||||||
ESRS 2- SBM 3 - S1 | 14 (g) | x | Sustainability statement | 80 | |||||||||||||||||||
| ESRS S1-1 | 20 | x | Sustainability statement | 80, 81 | |||||||||||||||||||
| ESRS S1-1 | 21 | x | Sustainability statement | 81 | |||||||||||||||||||
| ESRS S1-1 | 22 | x | Sustainability statement | 81 | |||||||||||||||||||
| ESRS S1-1 | 23 | x | Sustainability statement | 83, 84 | |||||||||||||||||||
| ESRS S1-3 | 32 (c) | x | Sustainability statement | 81 | |||||||||||||||||||
| ESRS S1-14 | 88 (b), 88 (c) | x | x | Sustainability statement | 84, 85 | ||||||||||||||||||
| ESRS S1-14 | 88 (e) | x | Not applicable to NN | - | |||||||||||||||||||
| ESRS S1-16 | 97 (a) | x | x | Sustainability statement | 87 | ||||||||||||||||||
| ESRS S1-16 | 97 (b) | x | Sustainability statement | 87 | |||||||||||||||||||
| ESRS S1-17 | 103 (a) | x | Sustainability statement | 83 | |||||||||||||||||||
| ESRS S1-17 | 104 (a) | x | x | Sustainability statement | 83 | ||||||||||||||||||
ESRS 2- SBM 3 - S2 | 11 (b) | x | Sustainability statement | 88 | |||||||||||||||||||
| ESRS S2-1 | 17 | x | Sustainability statement | 88, 89 | |||||||||||||||||||
| ESRS S2-1 | 18 | x | Sustainability statement | 88 | |||||||||||||||||||
| ESRS S2-1 | 19 | x | x | Sustainability statement | 88 | ||||||||||||||||||
| ESRS S2-1 | 19 | x | Sustainability statement | 88 | |||||||||||||||||||
| ESRS S2-4 | 36 | x | Not applicable to NN | - | |||||||||||||||||||
| ESRS S3-1 | 16 | x | Not applicable to NN | - | |||||||||||||||||||
| ESRS S3-1 | 17 | x | x | Not applicable to NN | - | ||||||||||||||||||
| ESRS S3-4 | 36 | x | Not applicable to NN | - | |||||||||||||||||||
| ESRS S4-1 | 16 | x | Sustainability statement | 72 | |||||||||||||||||||
| ESRS S4-1 | 17 | x | x | Sustainability statement | 72 | ||||||||||||||||||
| ESRS S4-4 | 35 | x | Not applicable to NN | - | |||||||||||||||||||
| ESRS G1-1 | 10 (b) | x | Not applicable to NN | - | |||||||||||||||||||
| ESRS G1-1 | 10 (d) | x | Not applicable to NN | - | |||||||||||||||||||
| ESRS G1-4 | 24 (a) | x | x | Sustainability statement | 91 | ||||||||||||||||||
| ESRS G1-4 | 24 (b) | x | Sustainability statement | 91 | |||||||||||||||||||
| Sustainability statement / Appendix | | |||||||||
| Table 2 – Disclosure requirements in ESRS covered by the Sustainability statement | Table 3 – List of incorporations by reference | |||||||||||||||||||||||||||||||||||||||||||
| ESRS 2 – General disclosures | ESRS E2 – Pollution | ESRS E5 – Resource use and circular economy | ESRS S2 – Workers in the value chain | ESRS disclosure requirement | Incorporation by reference | |||||||||||||||||||||||||||||||||||||||
| Disclosure requirement | Page | Disclosure requirement | Page | ESRS 2 GOV-1 (21 a-e, 23 a, b); G1 GOV-1 (5 a, b): Roles and responsibilities of Board of Directors and Executive Management | See Annual review, subheading ‘Competences' on pages 42 and 43 and section 'Independence and meeting attendance overview' on page 44 (and as additional reference within the Sustainability statement: see table 3.2.7 'Diversity metrics – Management levels' on page 87). | |||||||||||||||||||||||||||||||||||||||
| BP-1: Basis for preparation | 49 | ESRS 2 IRO-1: Processes | 52, 53, 64 | Disclosure requirement | Page | Disclosure requirement | Page | |||||||||||||||||||||||||||||||||||||
| BP-2: Specific circumstances | 49 | E2-1: Policies | 64 | ESRS 2 IRO-1: Processes | 52, 53, 60 | ESRS 2 SBM 2: Stakeholders | 51 | |||||||||||||||||||||||||||||||||||||
| GOV-1: Governance roles | 50, 51 | E2-2: Actions | 64 | E5-1: Policies | 60 | ESRS 2 SBM 3: Strategy | 88 | ESRS 2 GOV-2 (26 b): Overseeing sustainability matters | See Corporate governance report, page 4, sub-section ‘Strategy’ and Annual review: page 39, sub-sections ‘Access and affordability’, ‘Environmental impact’ and ‘Ethics and compliance’. | |||||||||||||||||||||||||||||||||||
| GOV-2: Governance | 50, 51 | E2-3: Targets | 64 | E5-2: Actions | 60, 61 | S2-1: Policies | 88, 89 | |||||||||||||||||||||||||||||||||||||
| GOV-3: Incentives schemes | 50-52, 55 | E2-4: Pollution | N/A | E5-3: Targets | 61, 62 | S2-2: Processes | 88 | |||||||||||||||||||||||||||||||||||||
| GOV-4: Due diligence | 49 | E2-5: Substances | 64, 65 | E5-4: Resource inflows | 62, 63 | S2-3: Remediate impacts | 88 | ESRS 2 GOV-2 (26 a): Sustainability matters discussed | See Corporate governance report, page 4, sub-section ‘Strategy’. | |||||||||||||||||||||||||||||||||||
| GOV-5: Risk management | 51 | E2-6: Financial effects | N/A | E5-5: Resource outflows | 62, 63 | S2-4: Actions | 89 | |||||||||||||||||||||||||||||||||||||
| SBM-1: Value chain | 49, 52 | E5-6: Financial effects | N/A | S2-5: Targets | 89 | ESRS 2 GOV-3 (29 a-e): Incentive schemes dependent on sustainability-related targets and performance metrics | See Remuneration report, pages 13-16, 3.5 ‘Short-term incentive programme 2024’ and pages 16-19, 3.6-3.8 ‘Long-term incentive programmes 2022, 2023 and 2024 – programme design’; page 5, table 1, rows: Short-term cash-based incentive programme and Long-term share-based incentive programme for the Board of Directors; and page 9, table 7, rows: Short-term incentive programme (STIP) and Long-term incentive programme (LTIP) for Executive Management. | |||||||||||||||||||||||||||||||||||||
| SBM-2: Stakeholders | 51 | ESRS E3 – Water and marine resources | ||||||||||||||||||||||||||||||||||||||||||
| SBM-3: Strategy | 52 | ESRS S1 – Own workforce | ESRS S4 – Patient protection and quality of life | |||||||||||||||||||||||||||||||||||||||||
| IRO-1: Processes | 52, 53 | Disclosure requirement | Page | Disclosure requirement | Page | |||||||||||||||||||||||||||||||||||||||
| IRO-2: ESRS DR's covered | 95, 96 | ESRS 2 IRO-1: Processes | 52, 53, 65 | ESRS 2 SBM 2: Stakeholders | 51 | Disclosure requirement | Page | |||||||||||||||||||||||||||||||||||||
| E3-1: Policies | 66 | ESRS 2 SBM 3: Strategy | 80 | ESRS 2 SBM 2: Stakeholders | 51 | ESRS E1, 13 (related to ESRS 2 GOV-3): Portion of total expensed remuneration to registered executives dependent on performance against climate related targets; ESRS 2 GOV-3 (29 d): Portion of total expensed variable remuneration to registered executives dependent on performance against ESG related targets | See Remuneration report, page 20, table 25. | |||||||||||||||||||||||||||||||||||||
| ESRS E1 – Climate change | E3-2: Actions | 66 | S1-1: Policies | 81, 83, 85 | ESRS 2 SBM 3: Strategy | 71 | ||||||||||||||||||||||||||||||||||||||
| Disclosure requirement | Page | E3-3: Targets | 66 | S1-2: Processes | 80, 81 | S4-1: Policies | 72, 73, 76-79 | |||||||||||||||||||||||||||||||||||||
| ESRS 2 GOV-3: Governance | 51, 96 | E3-4: Water consumption | 66, 67 | S1-3: Remediate impacts | 81 | S4-2: Processes | 72 | |||||||||||||||||||||||||||||||||||||
| E1-1: Transition plan | 57 | E3-5: Financial effects | N/A | S1-4: Actions | 81, 84, 86 | S4-3: Remediate impacts | 72 | |||||||||||||||||||||||||||||||||||||
| ESRS 2 SBM-3: Strategy | 55 | S1-5: Targets | 82, 84, 86 | S4-4: Actions | 72-74, 76-79 | |||||||||||||||||||||||||||||||||||||||
| ESRS 2 IRO-1: Processes | 52-54 | ESRS E4 – Biodiversity and ecosystems | S1-6: Own employees | 82-87 | S4-5: Targets | 72-79 | ESRS 2 SBM-1 (42 a-c): Business model and value chain | See Annual review, page 9, illustration of the stages from resources to patients. | ||||||||||||||||||||||||||||||||||||
| E1-2: Policies | 55 | S1-7: Non-employees | N/A | |||||||||||||||||||||||||||||||||||||||||
| E1-3: Actions | 55, 56 | Disclosure requirement | Page | S1-8: Bargaining coverage | 82, 83 | ESRS G1 – Business conduct | ESRS 2 BP-2 (12): Forward-looking information | See Annual review, page 35, section ‘Financials’, sub-chapter 'Forward-looking statements' for information on forward-looking information such as targets. | ||||||||||||||||||||||||||||||||||||
| E1-4: Targets | 56, 57 | E4-1: Transition plan | 68 | S1-9: Diversity | 87 | Disclosure requirement | Page | |||||||||||||||||||||||||||||||||||||
| E1-5: Energy consumption | 58, 59 | ESRS 2 SBM-3: Strategy | 67 | S1-10: Adequate wages | 82 | ESRS 2 GOV-1: Governance | 90 | ESRS 2 SBM-1 (40 a, e-g): Sustainability-related goals, significant products, value chain | See Annual review, section 'Purpose and sustainability', pages 12-16, for more on our strategy that relate to sustainability matters (and as additional reference within the Sustainability statement: See page 82, table 3.2.3 'Employees and employee turnover'). | |||||||||||||||||||||||||||||||||||
| E1-6: Scopes 1, 2, and 3 | 57, 58 | ESRS 2 - IRO 1: Processes | 52, 53, 67 | S1-11: Social protection | N/A | ESRS 2 IRO-1: Processes | 90 | |||||||||||||||||||||||||||||||||||||
| E1-7: GHG removals | 57 | E4-2: Policies | 67 | S1-12: Disabilities | N/A | G1-1: Corporate culture | 90 | |||||||||||||||||||||||||||||||||||||
| E1-8: Internal carbon pricing | N/A | E4-3: Actions | 68 | S1-13:Training | N/A | G1-2: Suppliers | 92, 93 | ESRS E1-1 (disclosure requirement related to ESRS 2 IRO-1 20 b, c): Process to identify and assess climate-related risks | See Annual review, section ‘Risk management’ on page 39 with regards to the main strategic risk 'environmental impact'. | |||||||||||||||||||||||||||||||||||
| E1-9: Financial effects | N/A | E4-4: Targets | 68 | S1-14: Health and safety | 83-85 | G1-3: Prevention | 91 | |||||||||||||||||||||||||||||||||||||
| E4-5: Impacts | 67, 68 | S1-15: Work-life balance | 81, 86 | G1-4: Incidents | 91, 92 | |||||||||||||||||||||||||||||||||||||||
| E4-6: Financial effects | N/A | S1-16: Compensation | 87 | G1-5: Political influence | 93 | ESRS S4-4 MDR-A (33b): Overview of what action is planned or underway to pursue material opportunities for the undertaking in relation to consumers and/or end-users | See Annual review, section 'Innovation and therapeutic focus', page 17-25, for an overview of opportunities to accelerate healthcare innovation across Obesity, Diabetes, Rare Diseases and Cardiovascular & Emerging Therapy Areas. | |||||||||||||||||||||||||||||||||||||
| S1-17: Complaints | 83 | G1-6: Payment practices | 92, 93 | |||||||||||||||||||||||||||||||||||||||||
| 1. In addition, a detailed description of the material IROs is given in the topical sections of this Sustainability statement. | ESRS 2 MDR-P (65a): The Novo Nordisk Way Essentials | See Annual review, page 15, visualisation ‘The Novo Nordisk Way Essentials’. | ||||||||||||||||||||||||||||||||||||||||||
| Sustainability statement / Appendix | | |||||||||
Financial year 2024 | 2024 | Substantial contribution criteria | DNSH criteria (“Does Not Significantly Harm”) | ||||||||||||||||||||||||||||||||||||||||||||||||||||||||
| Economic activities (1) | Code (2) | Turnover (3) | Proportion of turnover, 2024 (4) | Climate change mitigation (5) | Climate change adaptation (6) | Water (7) | Pollution (8) | Circular economy (9) | Biodiversity (10) | Climate change mitigation (11) | Climate change adaptation (12) | Water (13) | Pollution (14) | Circular economy (15) | Biodiversity (16) | Minimum safeguards (17) | Proportion of Taxonomy-aligned (A.1.) or -eligible (A.2.) turnover, 2023 (18) | Category enabling activity (19) | Category transitional activity (20) | ||||||||||||||||||||||||||||||||||||||||
mDkk | % | Y; N; N/EL | Y; N; N/EL | Y; N; N/EL | Y; N; N/EL | Y; N; N/EL | Y; N; N/EL | Y/N | Y/N | Y/N | Y/N | Y/N | Y/N | Y/N | % | E | T | ||||||||||||||||||||||||||||||||||||||||||
| A. TAXONOMY-ELIGIBLE ACTIVITIES | |||||||||||||||||||||||||||||||||||||||||||||||||||||||||||
| A.1. Environmentally sustainable activities (Taxonomy-aligned) | |||||||||||||||||||||||||||||||||||||||||||||||||||||||||||
| Turnover of environmentally sustainable activities (Taxonomy-aligned) (A.1) | 0 | 0% | 0% | 0% | |||||||||||||||||||||||||||||||||||||||||||||||||||||||
| Of which enabling | 0 | 0% | 0% | 0% | 0% | 0% | 0% | 0% | 0% | ||||||||||||||||||||||||||||||||||||||||||||||||||
| Of which transitional | 0 | 0% | 0% | 0% | |||||||||||||||||||||||||||||||||||||||||||||||||||||||
| A.2. Taxonomy-eligible but not environmentally sustainable activities (not Taxonomy-aligned activities) | |||||||||||||||||||||||||||||||||||||||||||||||||||||||||||
EL; N/EL | EL; N/EL | EL; N/EL | EL; N/EL | EL; N/EL | EL; N/EL | ||||||||||||||||||||||||||||||||||||||||||||||||||||||
| Manufacture of medicinal products | PPC 1.2 | 290,403 | 100% | N/EL | N/EL | N/EL | EL | N/EL | N/EL | 100% | |||||||||||||||||||||||||||||||||||||||||||||||||
| Turnover of Taxonomy-eligible but not environmentally sustainable activities (not Taxonomy-aligned activities) (A.2.) | 290,403 | 100% | 0% | 0% | 0% | 100% | 0% | 0% | 100% | ||||||||||||||||||||||||||||||||||||||||||||||||||
| Turnover of Taxonomy-eligible activities (A.1. + A.2.) | 290,403 | 100% | 0% | 0% | 0% | 100% | 0% | 0% | 100% | ||||||||||||||||||||||||||||||||||||||||||||||||||
| B. TAXONOMY-NON-ELIGIBLE ACTIVITIES | |||||||||||||||||||||||||||||||||||||||||||||||||||||||||||
| Turnover of Taxonomy-non-eligible activities (B) | 0 | 0% | |||||||||||||||||||||||||||||||||||||||||||||||||||||||||
| TOTAL | 290,403 | 100% | |||||||||||||||||||||||||||||||||||||||||||||||||||||||||
Y – Yes, Taxonomy-eligible and Taxonomy-aligned activity with the relevant environmental objective N – No, Taxonomy-eligible but not Taxonomy-aligned activity with the relevant environmental objective N/EL – Not eligible, Taxonomy-non-eligible activity for the relevant environmental objective | |||||||||||||||||||||||||||||||||||||||||||||||||||||||||||
| Sustainability statement / Appendix | | |||||||||
Financial year 2024 | 2024 | Substantial contribution criteria | DNSH criteria ("Does Not Significantly Harm") | ||||||||||||||||||||||||||||||||||||||||||||||||||||||||
| Economic activities (1) | Code (2) | CapEx (3) | Proportion of CapEx, 2024 (4) | Climate change mitigation (5) | Climate change adaptation (6) | Water (7) | Pollution (8) | Circular economy (9) | Biodiversity (10) | Climate change mitigation (11) | Climate change adaptation (12) | Water (13) | Pollution (14) | Circular economy (15) | Biodiversity (16) | Minimum safeguards (17) | Proportion of Taxonomy-aligned (A.1.) or eligible (A.2.) CapEx, 2023 (18) | Category enabling activity (19) | Category transitional activity (20) | ||||||||||||||||||||||||||||||||||||||||
| mDkk | % | Y; N; N/EL | Y; N; N/EL | Y; N; N/EL | Y; N; N/EL | Y; N; N/EL | Y; N; N/EL | Y/N | Y/N | Y/N | Y/N | Y/N | Y/N | Y/N | % | E | T | ||||||||||||||||||||||||||||||||||||||||||
| A. TAXONOMY-ELIGIBLE ACTIVITIES | |||||||||||||||||||||||||||||||||||||||||||||||||||||||||||
| A.1. Environmentally sustainable activities (Taxonomy-aligned) | |||||||||||||||||||||||||||||||||||||||||||||||||||||||||||
| Construction on new buildings | CCM 7.1 | 3,494 | 3% | Y | N/EL | N/EL | N/EL | N/EL | N/EL | Y | Y | Y | Y | Y | Y | Y | 0% | ||||||||||||||||||||||||||||||||||||||||||
CapEx of environmentally sustainable activities (Taxonomy-aligned) (A.1) | 3,494 | 3% | 3% | 0% | |||||||||||||||||||||||||||||||||||||||||||||||||||||||
| Of which enabling | 0 | 0% | 0% | 0% | 0% | 0% | 0% | 0% | 0% | ||||||||||||||||||||||||||||||||||||||||||||||||||
| Of which transitional | 0 | 0% | 0% | 0% | |||||||||||||||||||||||||||||||||||||||||||||||||||||||
| A.2. Taxonomy-eligible but not environmentally sustainable activities (not Taxonomy-aligned activities) | |||||||||||||||||||||||||||||||||||||||||||||||||||||||||||
| EL; N/EL | EL; N/EL | EL; N/EL | EL; N/EL | EL; N/EL | EL; N/EL | ||||||||||||||||||||||||||||||||||||||||||||||||||||||
| Construction on new buildings | CCM 7.1 | 13,050 | 11% | EL | N/EL | N/EL | N/EL | N/EL | N/EL | 14% | |||||||||||||||||||||||||||||||||||||||||||||||||
| Renovation of buildings | CCM 7.2 | 2,336 | 2% | EL | N/EL | N/EL | N/EL | N/EL | N/EL | 5% | |||||||||||||||||||||||||||||||||||||||||||||||||
| Manufacture of medicinal products | PPC 1.2 | 20,142 | 16% | N/EL | N/EL | N/EL | EL | N/EL | N/EL | 41% | |||||||||||||||||||||||||||||||||||||||||||||||||
| CapEx of Taxonomy-eligible but not environmentally sustainable activities (not Taxonomy-aligned activities) (A.2.) | 35,528 | 29% | 13% | 0% | 0% | 16% | 0% | 0% | 60% | ||||||||||||||||||||||||||||||||||||||||||||||||||
| CapEx of Taxonomy-eligible activities (A.1. + A.2.) | 39,022 | 32% | 16% | 0% | 0% | 16% | 0% | 0% | 60 | % | |||||||||||||||||||||||||||||||||||||||||||||||||
| B. TAXONOMY-NON-ELIGIBLE ACTIVITIES | |||||||||||||||||||||||||||||||||||||||||||||||||||||||||||
| CapEx of Taxonomy-non-eligible activities (B) | 84,950 | 68% | |||||||||||||||||||||||||||||||||||||||||||||||||||||||||
| TOTAL | 123,972 | 100% | |||||||||||||||||||||||||||||||||||||||||||||||||||||||||
| Y – Yes, Taxonomy-eligible and Taxonomy-aligned activity with the relevant environmental objective N – No, Taxonomy-eligible but not Taxonomy-aligned activity with the relevant environmental objective N/EL – Not eligible, Taxonomy-non-eligible activity for the relevant environmental objective | |||||||||||||||||||||||||||||||||||||||||||||||||||||||||||
| Sustainability statement / Appendix | | |||||||||
Financial year 2024 | 2024 | Substantial contribution criteria | DNSH criteria (“Does Not Significantly Harm”) | ||||||||||||||||||||||||||||||||||||||||||||||||||||||||
| Economic activities (1) | Code (2) | OpEx (3) | Proportion of OpEx, 2024 (4) | Climate change mitigation (5) | Climate change adaptation (6) | Water (7) | Pollution (8) | Circular economy (9) | Biodiversity (10) | Climate change mitigation (11) | Climate change adaptation (12) | Water (13) | Pollution (14) | Circular economy (15) | Biodiversity (16) | Minimum safeguards (17) | Proportion of Taxonomy-aligned (A.1.) or -eligible (A.2.) OpEx, 2023 (18) | Category enabling activity (19) | Category transitional activity (20) | ||||||||||||||||||||||||||||||||||||||||
| mDkk | % | Y; N; N/EL | Y; N; N/EL | Y; N; N/EL | Y; N; N/EL | Y; N; N/EL | Y; N; N/EL | Y/N | Y/N | Y/N | Y/N | Y/N | Y/N | Y/N | % | E | T | ||||||||||||||||||||||||||||||||||||||||||
| A. TAXONOMY-ELIGIBLE ACTIVITIES | |||||||||||||||||||||||||||||||||||||||||||||||||||||||||||
| A.1. Environmentally sustainable activities (Taxonomy-aligned) | |||||||||||||||||||||||||||||||||||||||||||||||||||||||||||
| OpEx of environmentally sustainable activities (Taxonomy-aligned) (A.1) | 0 | 0% | 0% | 0% | |||||||||||||||||||||||||||||||||||||||||||||||||||||||
| Of which enabling | 0 | 0% | 0% | 0% | 0% | 0% | 0% | 0% | 0% | ||||||||||||||||||||||||||||||||||||||||||||||||||
| Of which transitional | 0 | 0% | 0% | 0% | |||||||||||||||||||||||||||||||||||||||||||||||||||||||
| A.2. Taxonomy-eligible but not environmentally sustainable activities (not Taxonomy-aligned activities) | |||||||||||||||||||||||||||||||||||||||||||||||||||||||||||
| EL; N/EL | EL; N/EL | EL; N/EL | EL; N/EL | EL; N/EL | EL; N/EL | ||||||||||||||||||||||||||||||||||||||||||||||||||||||
| Manufacture of medicinal products | P 1.2 | 1,919 | 5% | N/EL | N/EL | N/EL | EL | N/EL | N/EL | 5% | |||||||||||||||||||||||||||||||||||||||||||||||||
| OpEx of Taxonomy-eligible but not environmentally sustainable activities (not Taxonomy-aligned activities) (A.2.) | 1,919 | 5% | 0% | 0% | 0% | 5% | 0% | 0% | 5% | ||||||||||||||||||||||||||||||||||||||||||||||||||
| OpEx of Taxonomy-eligible activities (A.1. + A.2.) | 1,919 | 5% | 0% | 0% | 0% | 5% | 0% | 0% | 5% | ||||||||||||||||||||||||||||||||||||||||||||||||||
| B. TAXONOMY-NON-ELIGIBLE ACTIVITIES | |||||||||||||||||||||||||||||||||||||||||||||||||||||||||||
| OpEx of Taxonomy-non-eligible activities (B) | 38,014 | 95% | |||||||||||||||||||||||||||||||||||||||||||||||||||||||||
| TOTAL | 39,933 | 100% | |||||||||||||||||||||||||||||||||||||||||||||||||||||||||
Y – Yes, Taxonomy-eligible and Taxonomy-aligned activity with the relevant environmental objective N – No, Taxonomy-eligible but not Taxonomy-aligned activity with the relevant environmental objective N/EL – Not eligible, Taxonomy-non-eligible activity for the relevant environmental objective | |||||||||||||||||||||||||||||||||||||||||||||||||||||||||||

| Consolidated financial statements | | |||||||||
| Income statement and Statement of comprehensive income | 102 | |||||||
| Cash flow statement | 103 | |||||||
| Balance sheet | 104 | |||||||
| Equity statement | 105 | |||||||
| Notes to the Consolidated financial statements | 106 | |||||||
| Section 1 | 106 | |||||||
| Basis of preparation | 106 | |||||||
| Material accounting policies and key accounting estimates and judgements | 106 | |||||||
1.2 | Changes in accounting policies and disclosures | 106 | ||||||
| Section 2 | 107 | |||||||
| Results for the year | 107 | |||||||
| 2.1 | Net sales and rebates | 107 | ||||||
| 2.2 | Segment information | 108 | ||||||
| 2.3 | Research and development costs | 110 | ||||||
| 2.4 | Employee costs | 110 | ||||||
| 2.5 | Other operating income and expenses | 111 | ||||||
| 2.6 | Income taxes and deferred income taxes | 111 | ||||||
| Section 3 | 113 | |||||||
| Operating assets and liabilities | 113 | |||||||
| 3.1 | Intangible assets | 113 | ||||||
| 3.2 | Property, plant and equipment | 115 | ||||||
| 3.3 | Inventories | 116 | ||||||
| 3.4 | Trade receivables | 116 | ||||||
| 3.5 | Provisions and contingent liabilities | 117 | ||||||
| Section 4 | 119 | ||||||||||
| Capital structure and financial items | 119 | ||||||||||
| 4.1 | Earnings per share | 119 | |||||||||
| 4.2 | Distribution to shareholders | 119 | |||||||||
| 4.3 | Share capital, Treasury shares and Other reserves | 119 | |||||||||
| 4.4 | Financial risks | 120 | |||||||||
| 4.5 | Derivative financial instruments | 122 | |||||||||
| 4.6 | Borrowings | 123 | |||||||||
| 4.7 | Cash flow statement specifications | 125 | |||||||||
| 4.8 | Financial assets and liabilities | 126 | |||||||||
| 4.9 | Financial income and expenses | 127 | |||||||||
| Section 5 | 128 | ||||||||||
| Other disclosures | 128 | ||||||||||
| 5.1 | Share-based payment schemes | 128 | |||||||||
| 5.2 | Commitments | 130 | |||||||||
| 5.3 | Acquisition of businesses | 130 | |||||||||
| 5.4 | Related party transactions | 131 | |||||||||
| 5.5 | Fees to statutory auditors | 132 | |||||||||
| 5.6 | General accounting policies | 132 | |||||||||
| 5.7 | Companies in the Novo Nordisk Group | 133 | |||||||||
| Part of the Annual review (not audited) | 134 | ||||||||||
Financial definitions and ratios | 134 | ||||||||||
| Non-IFRS financial measures | 135 | ||||||||||
| Consolidated financial statements / Income statement and Statement of comprehensive income | | |||||||||
| DKK million | Note | 2024 | 2023 | 2022 | ||||||||||||||||
| Income statement | ||||||||||||||||||||
| Net sales | 2.1, 2.2 | |||||||||||||||||||
| Cost of goods sold | 2.2 | ( | ( | ( | ||||||||||||||||
| Gross profit | ||||||||||||||||||||
| Sales and distribution costs | 2.2 | ( | ( | ( | ||||||||||||||||
| Research and development costs | 2.2, 2.3 | ( | ( | ( | ||||||||||||||||
| Administrative costs | 2.2 | ( | ( | ( | ||||||||||||||||
| Other operating income and expenses | 2.2, 2.5 | ( | ||||||||||||||||||
| Operating profit | ||||||||||||||||||||
| Financial income | 4.9 | |||||||||||||||||||
| Financial expenses | 4.9 | ( | ( | ( | ||||||||||||||||
| Profit before income taxes | ||||||||||||||||||||
| Income taxes | 2.6 | ( | ( | ( | ||||||||||||||||
| Net profit | ||||||||||||||||||||
| Earnings per share | ||||||||||||||||||||
| Basic earnings per share (DKK) | 4.1 | |||||||||||||||||||
| Diluted earnings per share (DKK) | 4.1 | |||||||||||||||||||
| DKK million | Note | 2024 | 2023 | 2022 | ||||||||||||||||
| Statement of comprehensive income | ||||||||||||||||||||
| Net profit | ||||||||||||||||||||
| Other comprehensive income: | ||||||||||||||||||||
| Remeasurements of retirement benefit obligations | ( | |||||||||||||||||||
| Items that will not be reclassified subsequently to the income statement | ( | |||||||||||||||||||
| Exchange rate adjustments of investments in subsidiaries | 4.3 | ( | ||||||||||||||||||
| Cash flow hedges: | ||||||||||||||||||||
| Realisation of previously deferred (gains)/losses | 4.3, 4.5 | ( | ( | |||||||||||||||||
| Deferred gains/(losses) related to acquisition of businesses | 4.3, 4.5 | |||||||||||||||||||
| Deferred gains/(losses) on hedges open at year-end | 4.3, 4.5 | ( | ||||||||||||||||||
| Tax and other items | 4.3 | ( | ( | |||||||||||||||||
| Items that will be reclassified subsequently to the income statement | ( | ( | ||||||||||||||||||
| Other comprehensive income | ( | ( | ||||||||||||||||||
| Total comprehensive income | ||||||||||||||||||||
| Consolidated financial statements / Cash flow statement | | |||||||||
| DKK million | Note | 2024 | 2023 | 2022 | ||||||||||||||||
| Cash flow statement | ||||||||||||||||||||
| Net profit | ||||||||||||||||||||
| Adjustment of non-cash items: | ||||||||||||||||||||
| Income taxes in the income statement | 2.6 | |||||||||||||||||||
| Depreciation, amortisation and impairment losses | 3.1, 3.2 | |||||||||||||||||||
| Other non-cash items | 4.7 | |||||||||||||||||||
| Changes in working capital | 4.7 | ( | ( | ( | ||||||||||||||||
| Interest received | ||||||||||||||||||||
| Interest paid | ( | ( | ( | |||||||||||||||||
| Income taxes paid | 2.6 | ( | ( | ( | ||||||||||||||||
| Net cash flows from operating activities | ||||||||||||||||||||
| Purchase of intangible assets | 3.1 | ( | ( | ( | ||||||||||||||||
| Purchase of property, plant and equipment | 3.2 | ( | ( | ( | ||||||||||||||||
| Cash used for acquisition of businesses | 5.3 | ( | ( | |||||||||||||||||
| Proceeds from other financial assets | ||||||||||||||||||||
| Purchase of other financial assets | ( | ( | ( | |||||||||||||||||
| Purchase of marketable securities | ( | ( | ( | |||||||||||||||||
| Sale of marketable securities | ||||||||||||||||||||
| Net cash flows from investing activities | ( | ( | ( | |||||||||||||||||
| DKK million | Note | 2024 | 2023 | 2022 | ||||||||||||||||
| Purchase of treasury shares | 4.2 | ( | ( | ( | ||||||||||||||||
| Dividends paid | 4.2 | ( | ( | ( | ||||||||||||||||
| Proceeds from borrowings | 4.6 | |||||||||||||||||||
| Repayment of borrowings | 4.6 | ( | ( | ( | ||||||||||||||||
| Net cash flows from financing activities | ( | ( | ||||||||||||||||||
| Net cash generated from activities | ||||||||||||||||||||
| Cash and cash equivalents at the beginning of the year | ||||||||||||||||||||
| Exchange gains/(losses) on cash and cash equivalents | ( | ( | ||||||||||||||||||
| Cash and cash equivalents at the end of the year | ||||||||||||||||||||
| Consolidated financial statements / Balance sheet | | |||||||||
| DKK million | Note | 2024 | 2023 | ||||||||||||||
| Assets | |||||||||||||||||
| Intangible assets | 3.1 | ||||||||||||||||
| Property, plant and equipment | 3.2 | ||||||||||||||||
| Investments in associated companies | |||||||||||||||||
| Deferred income tax assets | 2.6 | ||||||||||||||||
| Other receivables and prepayments | 4.8 | ||||||||||||||||
| Other financial assets | 4.8 | ||||||||||||||||
| Total non-current assets | |||||||||||||||||
| Inventories | 3.3 | ||||||||||||||||
| Trade receivables | 3.4 | ||||||||||||||||
| Tax receivables | |||||||||||||||||
| Other receivables and prepayments | 4.8 | ||||||||||||||||
| Marketable securities | 4.4 | ||||||||||||||||
| Derivative financial instruments | 4.5 | ||||||||||||||||
| Cash at bank | 4.4 | ||||||||||||||||
| Total current assets | |||||||||||||||||
| Total assets | |||||||||||||||||
| DKK million | Note | 2024 | 2023 | ||||||||||||||
| Equity and liabilities | |||||||||||||||||
| Share capital | 4.3 | ||||||||||||||||
| Treasury shares | 4.3 | ( | ( | ||||||||||||||
| Retained earnings | |||||||||||||||||
| Other reserves | 4.3 | ( | |||||||||||||||
| Total equity | |||||||||||||||||
| Borrowings | 4.6 | ||||||||||||||||
| Deferred income tax liabilities | 2.6 | ||||||||||||||||
| Retirement benefit obligations | |||||||||||||||||
| Other liabilities | 4.8 | ||||||||||||||||
| Provisions | 3.5 | ||||||||||||||||
| Total non-current liabilities | |||||||||||||||||
| Borrowings | 4.6 | ||||||||||||||||
| Trade payables | |||||||||||||||||
| Tax payables | |||||||||||||||||
| Other liabilities | 4.8 | ||||||||||||||||
| Derivative financial instruments | 4.5 | ||||||||||||||||
| Provisions | 3.5 | ||||||||||||||||
| Total current liabilities | |||||||||||||||||
| Total liabilities | |||||||||||||||||
| Total equity and liabilities | |||||||||||||||||
| Consolidated financial statements / Equity statement | | |||||||||
| 2024 | 2023 | 2022 | ||||||||||||||||||||||||||||||||||||||||||||||||||||||||||||
| DKK million | Share capital | Treasury shares | Retained earnings | Other reserves | Total | Share capital | Treasury shares | Retained earnings | Other reserves | Total | Share capital | Treasury shares | Retained earnings | Other reserves | Total | |||||||||||||||||||||||||||||||||||||||||||||||
| Balance at the beginning of the year | ( | ( | ( | ( | ||||||||||||||||||||||||||||||||||||||||||||||||||||||||||
| Net profit | ||||||||||||||||||||||||||||||||||||||||||||||||||||||||||||||
| Other comprehensive income | ( | ( | ( | ( | ( | |||||||||||||||||||||||||||||||||||||||||||||||||||||||||
| Total comprehensive income | ( | ( | ||||||||||||||||||||||||||||||||||||||||||||||||||||||||||||
Transfer of cash flow hedge reserve to intangible assets (note 4.3) | ( | ( | — | — | — | — | ||||||||||||||||||||||||||||||||||||||||||||||||||||||||
| Transactions with owners: | ||||||||||||||||||||||||||||||||||||||||||||||||||||||||||||||
Dividends (note 4.2) | ( | ( | ( | ( | ( | ( | ||||||||||||||||||||||||||||||||||||||||||||||||||||||||
Share-based payments (note 5.1) | ||||||||||||||||||||||||||||||||||||||||||||||||||||||||||||||
Purchase of treasury shares (note 4.3) | ( | ( | ( | ( | ( | ( | ( | ( | ( | |||||||||||||||||||||||||||||||||||||||||||||||||||||
Reduction of the B share capital (note 4.3) | ( | ( | ( | |||||||||||||||||||||||||||||||||||||||||||||||||||||||||||
| Tax related to transactions with owners | ||||||||||||||||||||||||||||||||||||||||||||||||||||||||||||||
| Balance at the end of the year | ( | ( | ( | ( | ||||||||||||||||||||||||||||||||||||||||||||||||||||||||||
| Consolidated financial statements / Notes to the Consolidated financial statement / 1.1 Material accounting policies and key accounting estimates and judgements | | |||||||||
| Key accounting estimates and judgements | Risk | Note(s) | ||||||||||||||||||
| Estimate of US sales deductions and provisions for sales rebates | High | 2.1, 3.5 | ||||||||||||||||||
| Estimate in determining fair values of assets acquired in a business combination and in impairment reviews of intangible assets | High | 3.1, 5.3 | ||||||||||||||||||
| Judgement of whether intangible assets acquired in a business combination are separately identifiable | High | 5.3 | ||||||||||||||||||
| Estimate regarding deferred income tax assets and provision for uncertain tax positions | Medium | 2.6 | ||||||||||||||||||
| Estimate of ongoing legal disputes, litigation and investigations | Medium | 3.5 | ||||||||||||||||||
| Consolidated financial statements / Notes to the Consolidated financial statement / 2.1 Net sales and rebates | | |||||||||
| Gross-to-net sales reconciliation | |||||||||||||||||
| DKK million | 2024 | 2023 | 2022 | ||||||||||||||
| Gross sales | |||||||||||||||||
| US Managed Care and Medicare | ( | ( | ( | ||||||||||||||
| US wholesaler charge-backs | ( | ( | ( | ||||||||||||||
| US Medicaid rebates | ( | ( | ( | ||||||||||||||
| Other US discounts and sales returns | ( | ( | ( | ||||||||||||||
| US rebates, discounts and sales returns | ( | ( | ( | ||||||||||||||
| Non-US rebates, discounts and sales returns | ( | ( | ( | ||||||||||||||
| Total gross-to-net sales adjustments | ( | ( | ( | ||||||||||||||
| Net sales | |||||||||||||||||
| Provisions for sales rebates | |||||||||||||||||
| DKK million | 2024 | 2023 | 2022 | ||||||||||||||
| At the beginning of the year | |||||||||||||||||
| Additional provisions, including increases to existing provisions | |||||||||||||||||
| Amount paid during the year | ( | ( | ( | ||||||||||||||
| Adjustments regarding prior years, including unused amounts reversed during the year | ( | ( | ( | ||||||||||||||
| Effect of exchange rate adjustment | ( | ||||||||||||||||
| At the end of the year | |||||||||||||||||
| Consolidated financial statements / Notes to the Consolidated financial statement / 2.2 Segment information | | |||||||||
| Operating segments – Key figures | |||||||||||||||||||||||||||||||||||||||||||||||
| Diabetes and Obesity care | Rare disease | Total | |||||||||||||||||||||||||||||||||||||||||||||
| DKK million | 2024 | 2023 | 2022 | 2024 | 2023 | 2022 | 2024 | 2023 | 2022 | ||||||||||||||||||||||||||||||||||||||
| Net sales | |||||||||||||||||||||||||||||||||||||||||||||||
| Cost of goods sold | ( | ( | ( | ( | ( | ( | ( | ( | ( | ||||||||||||||||||||||||||||||||||||||
| Sales and distribution costs | ( | ( | ( | ( | ( | ( | ( | ( | ( | ||||||||||||||||||||||||||||||||||||||
| Research and development costs | ( | ( | ( | ( | ( | ( | ( | ( | ( | ||||||||||||||||||||||||||||||||||||||
| Administrative costs | ( | ( | ( | ( | ( | ( | ( | ( | ( | ||||||||||||||||||||||||||||||||||||||
| Other operating income and expenses | ( | ( | ( | ( | |||||||||||||||||||||||||||||||||||||||||||
| Segment operating profit | |||||||||||||||||||||||||||||||||||||||||||||||
| Operating margin | % | % | % | % | % | % | % | % | % | ||||||||||||||||||||||||||||||||||||||
| Depreciation and amortisation expenses | ( | ( | ( | ( | ( | ( | ( | ( | ( | ||||||||||||||||||||||||||||||||||||||
| Impairment losses and reversals | ( | ( | ( | ( | ( | ( | ( | ( | |||||||||||||||||||||||||||||||||||||||
| Total depreciation, amortisation, impairment losses and reversals | ( | ( | ( | ( | ( | ( | ( | ( | ( | ||||||||||||||||||||||||||||||||||||||
| Consolidated financial statements / Notes to the Consolidated financial statement / 2.2 Segment information | | |||||||||
| Net sales – Segments and geographical areas | |||||||||||||||||||||||||||||||||||||||||||||||||||||||||||||||||
| Total International Operations | Total North America Operations | Total Novo Nordisk net sales | |||||||||||||||||||||||||||||||||||||||||||||||||||||||||||||||
| Total IO | EMEA | Region China | Rest of World | Total NAO | US | ||||||||||||||||||||||||||||||||||||||||||||||||||||||||||||
| DKK million | 2024 | 2023 | 2022 | 2024 | 2023 | 2022 | 2024 | 2023 | 2022 | 2024 | 2023 | 2022 | 2024 | 2023 | 2022 | 2024 | 2023 | 2022 | 2024 | 2023 | 2022 | ||||||||||||||||||||||||||||||||||||||||||||
| Diabetes and Obesity care segment: | |||||||||||||||||||||||||||||||||||||||||||||||||||||||||||||||||
Ozempic® | |||||||||||||||||||||||||||||||||||||||||||||||||||||||||||||||||
Rybelsus® | |||||||||||||||||||||||||||||||||||||||||||||||||||||||||||||||||
Victoza® | |||||||||||||||||||||||||||||||||||||||||||||||||||||||||||||||||
| Total GLP-1 | |||||||||||||||||||||||||||||||||||||||||||||||||||||||||||||||||
| Long-acting insulin | |||||||||||||||||||||||||||||||||||||||||||||||||||||||||||||||||
•of which Awigli® | |||||||||||||||||||||||||||||||||||||||||||||||||||||||||||||||||
•of which Tresiba® | |||||||||||||||||||||||||||||||||||||||||||||||||||||||||||||||||
•of which Xultophy® | |||||||||||||||||||||||||||||||||||||||||||||||||||||||||||||||||
•of which Levemir® | |||||||||||||||||||||||||||||||||||||||||||||||||||||||||||||||||
| Premix insulin | |||||||||||||||||||||||||||||||||||||||||||||||||||||||||||||||||
•of which Ryzodeg® | |||||||||||||||||||||||||||||||||||||||||||||||||||||||||||||||||
•of which NovoMix® | |||||||||||||||||||||||||||||||||||||||||||||||||||||||||||||||||
| Fast-acting insulin | |||||||||||||||||||||||||||||||||||||||||||||||||||||||||||||||||
•of which Fiasp® | |||||||||||||||||||||||||||||||||||||||||||||||||||||||||||||||||
•of which NovoRapid® | |||||||||||||||||||||||||||||||||||||||||||||||||||||||||||||||||
| Human insulin | |||||||||||||||||||||||||||||||||||||||||||||||||||||||||||||||||
| Total insulin | |||||||||||||||||||||||||||||||||||||||||||||||||||||||||||||||||
| Other Diabetes care | |||||||||||||||||||||||||||||||||||||||||||||||||||||||||||||||||
| Total Diabetes care | |||||||||||||||||||||||||||||||||||||||||||||||||||||||||||||||||
Wegovy® | |||||||||||||||||||||||||||||||||||||||||||||||||||||||||||||||||
Saxenda® | |||||||||||||||||||||||||||||||||||||||||||||||||||||||||||||||||
| Total Obesity care | |||||||||||||||||||||||||||||||||||||||||||||||||||||||||||||||||
| Diabetes and Obesity care total | |||||||||||||||||||||||||||||||||||||||||||||||||||||||||||||||||
Rare disease segment: | |||||||||||||||||||||||||||||||||||||||||||||||||||||||||||||||||
| Rare blood disorders | |||||||||||||||||||||||||||||||||||||||||||||||||||||||||||||||||
•of which Haemophilia A | |||||||||||||||||||||||||||||||||||||||||||||||||||||||||||||||||
•of which Haemophilia B | |||||||||||||||||||||||||||||||||||||||||||||||||||||||||||||||||
•of which NovoSeven® | |||||||||||||||||||||||||||||||||||||||||||||||||||||||||||||||||
| Rare endocrine disorders | |||||||||||||||||||||||||||||||||||||||||||||||||||||||||||||||||
| Other Rare disease | |||||||||||||||||||||||||||||||||||||||||||||||||||||||||||||||||
| Rare disease total | |||||||||||||||||||||||||||||||||||||||||||||||||||||||||||||||||
| Total sales by geographical area | |||||||||||||||||||||||||||||||||||||||||||||||||||||||||||||||||
| Total sales growth as reported | % | % | % | % | % | % | % | % | % | % | % | % | % | % | % | % | % | % | % | % | % | ||||||||||||||||||||||||||||||||||||||||||||
| Consolidated financial statements / Notes to the Consolidated financial statement / 2.3 Research and development costs | | |||||||||
| DKK million | 2024 | 2023 | 2022 | ||||||||||||||
Employee costs (note 2.4) | |||||||||||||||||
Amortisation, intangible assets (note 3.1) | |||||||||||||||||
Impairment losses and reversals, intangible assets (note 3.1) | |||||||||||||||||
Depreciation, property, plant and equipment (note 3.2) | |||||||||||||||||
Impairment losses, property, plant and equipment (note 3.2) | |||||||||||||||||
| Clinical trial cost | |||||||||||||||||
| Other research and development costs | |||||||||||||||||
| Total research and development costs | |||||||||||||||||
| As percentage of net sales | |||||||||||||||||
| DKK million | 2024 | 2023 | 2022 | |||||||||||
| Wages and salaries | ||||||||||||||
Share-based payment costs (note 5.1) | ||||||||||||||
| Pensions – defined contribution plans | ||||||||||||||
| Pensions – defined benefit plans | ||||||||||||||
| Other social security contributions | ||||||||||||||
| Other employee costs | ||||||||||||||
| Total employee costs for the year | ||||||||||||||
| Employee costs capitalised as intangible assets and property, plant and equipment | ( | ( | ( | |||||||||||
| Change in employee costs capitalised as inventories | ( | ( | ( | |||||||||||
| Total employee costs in the income statement | ||||||||||||||
| Included in the income statement: | ||||||||||||||
| Cost of goods sold | ||||||||||||||
| Sales and distribution costs | ||||||||||||||
| Research and development costs | ||||||||||||||
| Administrative costs | ||||||||||||||
| Other operating income and expenses | ||||||||||||||
| Total employee costs in the income statement | ||||||||||||||
| Number | 2024 | 2023 | 2022 | ||||||||||||||
| Average number of full-time employees | |||||||||||||||||
| Year-end number of full-time employees | |||||||||||||||||
| Year-end employees (total) | |||||||||||||||||
| Consolidated financial statements / Notes to the Consolidated financial statement / 2.5 Other operating income and expenses | | |||||||||
| Income taxes expensed | ||||||||||||||
| DKK million | 2024 | 2023 | 2022 | |||||||||||
| Current tax on profit for the year | ||||||||||||||
| Deferred tax on profit for the year | ( | ( | ( | |||||||||||
| Tax on profit for the year | ||||||||||||||
| Current tax adjustments recognised for prior years | ( | |||||||||||||
| Deferred tax adjustments recognised for prior years | ( | ( | ||||||||||||
| Income taxes in the income statement | ||||||||||||||
| Tax on other comprehensive income for the year, (income)/expense | ( | |||||||||||||
| Computation of effective tax rate | ||||||||||||||||||||
| DKK million | 2024 | 2023 | 2022 | |||||||||||||||||
| Statutory corporate income tax rate in Denmark | % | % | % | |||||||||||||||||
| Deviation in foreign subsidiaries' tax rates compared to the Danish tax rate (net) | ( | ( | ( | |||||||||||||||||
| Non-taxable income less non-tax-deductible expenses (net) | ( | ( | ( | |||||||||||||||||
| Other adjustments (net) | ( | ( | ( | |||||||||||||||||
| Effective tax rate | % | % | % | |||||||||||||||||
| Income taxes paid | |||||||||||||||||
| DKK million | 2024 | 2023 | 2022 | ||||||||||||||
| Income taxes paid in Denmark for current year | |||||||||||||||||
| Income taxes paid outside Denmark for current year | |||||||||||||||||
| Income taxes paid | |||||||||||||||||
| Consolidated financial statements / Notes to the Consolidated financial statement / 2.6 Income taxes and deferred income taxes | | |||||||||
| Development in deferred income tax assets and liabilities | Property, plant and equipment | Intangible assets | Inventories | Liabilities | Other | Offset within countries | Total | ||||||||||||||||||||||
| DKK million | |||||||||||||||||||||||||||||
| 2024 | |||||||||||||||||||||||||||||
| Net deferred tax asset/(liability) at the beginning of the year | ( | ( | |||||||||||||||||||||||||||
| Income/(charge) to the income statement | ( | — | |||||||||||||||||||||||||||
| Income/(charge) to other comprehensive income | ( | ( | — | ||||||||||||||||||||||||||
| Income/(charge) to equity | ( | — | ( | ||||||||||||||||||||||||||
| Additions from acquisitions | ( | — | |||||||||||||||||||||||||||
| Effect of exchange rate adjustment | ( | ( | — | ||||||||||||||||||||||||||
| Net deferred tax asset/(liability) at the end of the year | ( | ( | |||||||||||||||||||||||||||
| Classified as follows: | |||||||||||||||||||||||||||||
| Deferred tax asset at the end of the year | ( | ||||||||||||||||||||||||||||
| Deferred tax liability at the end of the year | ( | ( | ( | ( | ( | ( | |||||||||||||||||||||||
| 2023 | |||||||||||||||||||||||||||||
| Net deferred tax asset/(liability) at the beginning of the year | ( | ( | |||||||||||||||||||||||||||
| Income/(charge) to the income statement | ( | ( | ( | — | |||||||||||||||||||||||||
| Income/(charge) to other comprehensive income | ( | ( | ( | — | ( | ||||||||||||||||||||||||
| Income/(charge) to equity | ( | — | ( | ||||||||||||||||||||||||||
| Additions from acquisitions | — | ||||||||||||||||||||||||||||
| Effect of exchange rate adjustment | ( | ( | — | ( | |||||||||||||||||||||||||
| Net deferred tax asset/(liability) at the end of the year | ( | ( | |||||||||||||||||||||||||||
| Classified as follows: | |||||||||||||||||||||||||||||
| Deferred tax asset at the end of the year | ( | ||||||||||||||||||||||||||||
| Deferred tax liability at the end of the year | ( | ( | ( | ( | ( | ( | |||||||||||||||||||||||
| Consolidated financial statements / Notes to the Consolidated financial statement / 3.1 Intangible assets | | |||||||||
| Amortisation | |||||||||||||||||
| DKK million | 2024 | 2023 | 2022 | ||||||||||||||
| Cost of goods sold | |||||||||||||||||
| Sales and distribution costs | |||||||||||||||||
| Research and development costs | |||||||||||||||||
| Administrative costs | |||||||||||||||||
| Other operating income and expenses | |||||||||||||||||
| Total amortisation | |||||||||||||||||
| Impairment losses and reversals | |||||||||||||||||
| DKK million | 2024 | 2023 | 2022 | ||||||||||||||
| Research and development costs | |||||||||||||||||
| Other operating income and expenses | |||||||||||||||||
| Total impairment losses and reversals | |||||||||||||||||
| DKK million | Goodwill | Intellectual property rights and know-how | Software and other intangibles | Total intangible assets | |||||||||||||||||||
| 2024 | |||||||||||||||||||||||
| Cost at the beginning of the year | |||||||||||||||||||||||
Additions from acquisition of businesses (note 5.3) | |||||||||||||||||||||||
| Additions during the year | |||||||||||||||||||||||
| Disposals during the year | ( | ( | ( | ||||||||||||||||||||
| Effect of exchange rate adjustment | |||||||||||||||||||||||
| Cost at the end of the year | |||||||||||||||||||||||
| Amortisation and impairment losses at the beginning of the year | |||||||||||||||||||||||
| Amortisation for the year | — | ||||||||||||||||||||||
| Impairment losses for the year | |||||||||||||||||||||||
| Amortisation and impairment losses reversed on disposals during the year | ( | ( | ( | ||||||||||||||||||||
| Effect of exchange rate adjustment | |||||||||||||||||||||||
| Amortisation and impairment losses at the end of the year | |||||||||||||||||||||||
| Carrying amount at the end of the year | |||||||||||||||||||||||
| 2023 | |||||||||||||||||||||||
| Cost at the beginning of the year | |||||||||||||||||||||||
| Additions during the year | |||||||||||||||||||||||
| Disposals during the year | ( | ( | ( | ||||||||||||||||||||
| Effect of exchange rate adjustment | ( | ( | ( | ||||||||||||||||||||
| Cost at the end of the year | |||||||||||||||||||||||
| Amortisation and impairment losses at the beginning of the year | |||||||||||||||||||||||
| Amortisation for the year | — | ||||||||||||||||||||||
| Impairment losses for the year | |||||||||||||||||||||||
| Impairment losses reversed during the year | ( | ( | |||||||||||||||||||||
| Amortisation and impairment losses reversed on disposals during the year | ( | ( | ( | ||||||||||||||||||||
| Effect of exchange rate adjustment | ( | ||||||||||||||||||||||
| Amortisation and impairment losses at the end of the year | |||||||||||||||||||||||
| Carrying amount at the end of the year | |||||||||||||||||||||||
| Consolidated financial statements / Notes to the Consolidated financial statement / 3.1 Intangible assets | | |||||||||
| Consolidated financial statements / Notes to the Consolidated financial statement / 3.2 Property, plant and equipment | | |||||||||
| DKK million | Land and buildings | Plant and machinery | Other equipment | Assets under construction | Property, plant and equipment | ||||||||||||||||||
| 2024 | |||||||||||||||||||||||
| Cost at the beginning of the year | |||||||||||||||||||||||
| Additions from acquisition of businesses (note 5.3) | |||||||||||||||||||||||
| Additions during the year | |||||||||||||||||||||||
| Disposals during the year | ( | ( | ( | ( | ( | ||||||||||||||||||
| Transfer and reclassifications | ( | ||||||||||||||||||||||
| Effect of exchange rate adjustment | |||||||||||||||||||||||
| Cost at the end of the year | |||||||||||||||||||||||
| Depreciation and impairment losses at the beginning of the year | |||||||||||||||||||||||
| Depreciation for the year | |||||||||||||||||||||||
| Impairment losses for the year | |||||||||||||||||||||||
| Depreciation and impairment losses reversed on disposals during the year | ( | ( | ( | ( | ( | ||||||||||||||||||
| Effect of exchange rate adjustment | |||||||||||||||||||||||
| Depreciation and impairment losses at the end of the year | |||||||||||||||||||||||
| Carrying amount at the end of the year | |||||||||||||||||||||||
| 2023 | |||||||||||||||||||||||
| Cost at the beginning of the year | |||||||||||||||||||||||
| Additions during the year | |||||||||||||||||||||||
| Disposals during the year | ( | ( | ( | ( | ( | ||||||||||||||||||
| Transfer and reclassifications | ( | ||||||||||||||||||||||
| Effect of exchange rate adjustment | ( | ( | ( | ( | ( | ||||||||||||||||||
| Cost at the end of the year | |||||||||||||||||||||||
| Depreciation and impairment losses at the beginning of the year | |||||||||||||||||||||||
| Depreciation for the year | |||||||||||||||||||||||
| Impairment losses for the year | |||||||||||||||||||||||
| Depreciation and impairment losses reversed on disposals during the year | ( | ( | ( | ( | ( | ||||||||||||||||||
| Effect of exchange rate adjustment | ( | ( | ( | ( | |||||||||||||||||||
| Depreciation and impairment losses at the end of the year | |||||||||||||||||||||||
| Carrying amount at the end of the year | |||||||||||||||||||||||
| Depreciation | |||||||||||||||||
| DKK million | 2024 | 2023 | 2022 | ||||||||||||||
| Cost of goods sold | |||||||||||||||||
| Sales and distribution costs | |||||||||||||||||
| Research and development costs | |||||||||||||||||
| Administrative costs | |||||||||||||||||
| Other operating income and expenses | |||||||||||||||||
| Total depreciation | |||||||||||||||||
| Of which related to leased assets | |||||||||||||||||
| Impairment losses | |||||||||||||||||
| DKK million | 2024 | 2023 | 2022 | ||||||||||||||
| Cost of goods sold | |||||||||||||||||
| Sales and distribution costs | |||||||||||||||||
| Research and development costs | |||||||||||||||||
| Total impairment losses | |||||||||||||||||
| Of which related to leased assets | |||||||||||||||||
| Leased property, plant and equipment | |||||||||||
| DKK million | 2024 | 2023 | |||||||||
| Land and buildings | |||||||||||
| Other equipment | |||||||||||
| Total | |||||||||||
| Consolidated financial statements / Notes to the Consolidated financial statement / 3.3 Inventories | | |||||||||
| DKK million | 2024 | 2023 | ||||||||||||
| Raw materials | ||||||||||||||
| Work in progress | ||||||||||||||
| Finished goods | ||||||||||||||
| Total inventories (gross) | ||||||||||||||
| Write-downs at year-end | ( | ( | ||||||||||||
| Total inventories (net) | ||||||||||||||
| Indirect production costs included in work in progress and finished goods | ||||||||||||||
| Share of total inventories (net) | % | % | ||||||||||||
| Movements in inventory write-downs: | ||||||||||||||
| Write-downs at the beginning of the year | ||||||||||||||
| Write-downs during the year | ||||||||||||||
| Utilisation of write-downs | ( | ( | ||||||||||||
| Reversal of write-downs | ( | ( | ||||||||||||
| Write-downs at the end of the year | ||||||||||||||
| DKK million | Gross carrying amount | Loss allowance | Net carrying amount | ||||||||||||||
| 2024 | |||||||||||||||||
| Not yet due | ( | ||||||||||||||||
| 1-90 days | ( | ||||||||||||||||
| 91-180 days | ( | ||||||||||||||||
| 181-270 days | ( | ||||||||||||||||
| 271-360 days | ( | ||||||||||||||||
| More than 360 days past due | ( | ||||||||||||||||
| Trade receivables | ( | ||||||||||||||||
| 2023 | |||||||||||||||||
| Not yet due | ( | ||||||||||||||||
| 1-90 days | ( | ||||||||||||||||
| 91-180 days | ( | ||||||||||||||||
| 181-270 days | ( | ||||||||||||||||
| 271-360 days | ( | ||||||||||||||||
| More than 360 days past due | ( | ||||||||||||||||
| Trade receivables | ( | ||||||||||||||||
Allowance for doubtful trade receivables | ||||||||||||||
| DKK million | 2024 | 2023 | ||||||||||||
| Carrying amount at the beginning of the year | ||||||||||||||
| Reversal of allowance on realised losses | ( | ( | ||||||||||||
| Net movement recognised in income statement | ||||||||||||||
| Effect of exchange rate adjustment | ( | ( | ||||||||||||
| Allowance at the end of the year | ||||||||||||||
| Consolidated financial statements / Notes to the Consolidated financial statement / 3.5 Provisions and contingent liabilities | | |||||||||
| DKK million | Provisions for sales rebates1 | Provisions for legal disputes | Provisions for product returns | Other provisions2 | 2024 Total | 2023 Total | |||||||||||||||||||||||
| At the beginning of the year | |||||||||||||||||||||||||||||
| Additional provisions, including increases to existing provisions | |||||||||||||||||||||||||||||
Additional provisions from acquisition of businesses (note 5.3) | |||||||||||||||||||||||||||||
| Amount used during the year | ( | ( | ( | ( | ( | ||||||||||||||||||||||||
| Adjustments regarding prior years, including unused amounts reversed during the year | ( | ( | ( | ( | ( | ||||||||||||||||||||||||
| Effect of exchange rate adjustment | ( | ( | |||||||||||||||||||||||||||
| At the end of the year | |||||||||||||||||||||||||||||
Non-current liabilities3 | |||||||||||||||||||||||||||||
| Current liabilities | |||||||||||||||||||||||||||||
1. Provisions for sales rebates are related to US Managed Care, Medicare, Medicaid, 340B Drug Pricing Program and other types of US rebates, as well as rebates in a number of European countries and Canada. 2. Other provisions consist of various types of provisions, including contingent payments arising from business combinations and obligations in relation to employee benefits such as jubilee benefits. 3. For non-current liabilities, provisions for sales rebates are expected to be settled after one year, provisions for product returns will be utilised in 2025 and 2026. In the case of provisions for legal disputes, the timing of settlement cannot be determined. | |||||||||||||||||||||||||||||
| Consolidated financial statements / Notes to the Consolidated financial statement / 3.5 Provisions and contingent liabilities | | |||||||||
| Consolidated financial statements / Notes to the Consolidated financial statement / 4.1 Earnings per share | | |||||||||
| 2024 | 2023 | 2022 | ||||||||||||||||||
| Net profit | DKK million | |||||||||||||||||||
Average number of shares outstanding1 | in million shares | |||||||||||||||||||
| Dilutive effect of restricted stock units | in million shares | |||||||||||||||||||
| Average number of shares outstanding, including dilutive effect | in million shares | |||||||||||||||||||
| Basic earnings per share | DKK | |||||||||||||||||||
| Diluted earnings per share | DKK | |||||||||||||||||||
| 1. Excluding treasury shares. | ||||||||||||||||||||
| DKK million | 2024 | 2023 | 2022 | |||||||||||
| Interim dividend for the year | ||||||||||||||
| Dividend for prior year | ||||||||||||||
| Dividend payout in the year | ||||||||||||||
| Share repurchases for the year | ||||||||||||||
| Total distribution for the year | ||||||||||||||
| DKK million | 2024 | 2023 | 2022 | |||||||||||
Interim dividend1 | ||||||||||||||
Final dividend2 | ||||||||||||||
| Total dividend | ||||||||||||||
| DKK per share | 2024 | 2023 | 2022 | |||||||||||
Interim dividend1 | ||||||||||||||
Final dividend2 | ||||||||||||||
| Total dividend | ||||||||||||||
1. Interim dividend was declared and paid in August 2024. 2. Final dividend for 2024 is expected to be distributed pending approval at the Annual General Meeting in March 2025. Final dividend for 2023 was declared and paid in March 2024. | ||||||||||||||
| Number of shares (million) | A shares | B shares | Total issued shares | Treasury shares | Out-standing shares | ||||||||||||||||||
| Shares beginning of 2023 | ( | ||||||||||||||||||||||
| Shares cancelled in 2023 | ( | ( | |||||||||||||||||||||
| Released allocated shares to employees | |||||||||||||||||||||||
| Shares purchased in 2023 | ( | ( | |||||||||||||||||||||
| Number of shares end of 2023 | ( | ||||||||||||||||||||||
| Shares cancelled in 2024 | ( | ( | |||||||||||||||||||||
| Released allocated shares to employees | |||||||||||||||||||||||
| Shares purchased in 2024 | ( | ( | |||||||||||||||||||||
Number of shares end of 2024 | ( | ||||||||||||||||||||||
| Consolidated financial statements / Notes to the Consolidated financial statement / 4.4 Financial risks | | |||||||||
| Specification of Other reserves | |||||||||||||||||
| DKK million | Exchange rate adjustments | Cash flow hedges1 | Tax and other items | Total | |||||||||||||
Reserve at 1 January 2022 | ( | ( | ( | ||||||||||||||
| Other comprehensive income, net | ( | ||||||||||||||||
Reserve at 31 December 2022 | |||||||||||||||||
| Other comprehensive income, net | ( | ( | ( | ||||||||||||||
Reserve at 31 December 2023 | ( | ( | |||||||||||||||
| Other comprehensive income, net | ( | ( | |||||||||||||||
Transferred to intangible assets2 | ( | ( | |||||||||||||||
Reserve at 31 December 2024 | ( | ( | |||||||||||||||
1. Refer to note 4.5 for information on cash flow hedges. 2. A gain from cash flow hedges related to acquisition of businesses of DKK | |||||||||||||||||
| Type | Financial risk | ||||
| Foreign exchange risk | High | ||||
| Credit risk | Low | ||||
| Interest rate risk | Low | ||||
| Liquidity risk | Low | ||||
| Exchange rates applied for selected currencies | |||||||||||||||||
| USD | CNY | CAD | JPY | BRL | |||||||||||||
| Average exchange rate applied (DKK per 100) | |||||||||||||||||
| 2024 | |||||||||||||||||
| 2023 | |||||||||||||||||
| 2022 | |||||||||||||||||
| Year-end exchange rate applied (DKK per 100) | |||||||||||||||||
| 2024 | |||||||||||||||||
| 2023 | |||||||||||||||||
| 2022 | |||||||||||||||||
Sensitivity of an immediate 5% decrease in currency rates on 31 December vs DKK1 | |||||||||||
| DKK million | 2024 | 2023 | |||||||||
| Sensitivity of all currencies | |||||||||||
| Income statement | ( | ( | |||||||||
| Other comprehensive income | |||||||||||
| Total | |||||||||||
| Hereof sensitivity of USD | |||||||||||
| Income statement | |||||||||||
| Other comprehensive income | |||||||||||
| Total | |||||||||||
1. An immediate | |||||||||||
| Consolidated financial statements / Notes to the Consolidated financial statement / 4.4 Financial risks | | |||||||||
| Financial contracts coverage at year end | |||||||||||||||||
| Months | USD | CNY2 | CAD | JPY | BRL | ||||||||||||
| 2024 | |||||||||||||||||
| 2023 | |||||||||||||||||
| 2. Chinese yuan traded offshore (CNH) is used to hedge Novo Nordisk's CNY currency exposure. | |||||||||||||||||
| Credit exposure for cash at bank, marketable securities and derivative financial instruments (fair value) | |||||||||||||||||||||||
| DKK million | Cash at bank | Marketable securities | Derivative financial instruments | Total | |||||||||||||||||||
| 2024 | |||||||||||||||||||||||
| AAA range | |||||||||||||||||||||||
| AA range | |||||||||||||||||||||||
| A range | |||||||||||||||||||||||
| BBB range | |||||||||||||||||||||||
| Not rated or below BBB range | |||||||||||||||||||||||
| Total | |||||||||||||||||||||||
| 2023 | |||||||||||||||||||||||
| AAA range | |||||||||||||||||||||||
| AA range | |||||||||||||||||||||||
| A range | |||||||||||||||||||||||
| BBB range | |||||||||||||||||||||||
| Not rated or below BBB range | |||||||||||||||||||||||
| Total | |||||||||||||||||||||||
| DKK million | 2024 | 2023 | 2022 | ||||||||||||||
| US | |||||||||||||||||
| Japan | |||||||||||||||||
| Financial reserves | |||||||||||||||||
| DKK million | 2024 | 2023 | 2022 | ||||||||||||||
| Cash at bank | |||||||||||||||||
| Marketable securities | |||||||||||||||||
Undrawn committed credit facility3 | |||||||||||||||||
| Undrawn bridge facility | |||||||||||||||||
| Borrowings | ( | ( | ( | ||||||||||||||
| Financial reserves | |||||||||||||||||
3. The undrawn committed credit facility comprises a facility of EUR (EUR | |||||||||||||||||
| Consolidated financial statements / Notes to the Consolidated financial statement / 4.5 Derivative financial instruments | | |||||||||
| 2024 | 2023 | ||||||||||||||||||||||||||||
| DKK million | Average rate | Contract amount at year-end | Positive fair value at year-end | Negative fair value at year-end | Average rate | Contract amount at year-end | Positive fair value at year-end | Negative fair value at year-end | |||||||||||||||||||||
| Forward contracts USD | |||||||||||||||||||||||||||||
Forward contracts CNH and JPY1 | |||||||||||||||||||||||||||||
| Forward contracts, cash flow hedges | |||||||||||||||||||||||||||||
| Forward contracts USD | |||||||||||||||||||||||||||||
| Forward contracts EUR, CNH, JPY and others | |||||||||||||||||||||||||||||
| Forward contracts, fair value hedges | |||||||||||||||||||||||||||||
| Total derivative financial instruments | |||||||||||||||||||||||||||||
| Recognised in the income statement | |||||||||||||||||||||||||||||
| Recognised in other comprehensive income | |||||||||||||||||||||||||||||
1. For 2023 the relevant currencies are CNH, CAD and JPY. | |||||||||||||||||||||||||||||
| Consolidated financial statements / Notes to the Consolidated financial statement / 4.6 Borrowings | | |||||||||
| Reconciliation of liabilities arising from financing activities | Non-cash movements | ||||||||||||||||||||||||||||
| DKK million | Beginning of the year | Re-payments | Proceeds | Additions1 | Disposals | Exchange rates | Other | End of the year | |||||||||||||||||||||
2024 | |||||||||||||||||||||||||||||
| Lease liabilities | ( | ( | |||||||||||||||||||||||||||
| Eurobonds | ( | ||||||||||||||||||||||||||||
| Loans | |||||||||||||||||||||||||||||
| Commercial papers | ( | ||||||||||||||||||||||||||||
| Bank overdrafts | ( | ||||||||||||||||||||||||||||
| Total borrowings | ( | ( | |||||||||||||||||||||||||||
2023 | |||||||||||||||||||||||||||||
| Lease liabilities | ( | ( | ( | ||||||||||||||||||||||||||
| Eurobonds | |||||||||||||||||||||||||||||
| Bank overdrafts | ( | ( | ( | ||||||||||||||||||||||||||
| Total borrowings | ( | ( | ( | ||||||||||||||||||||||||||
| 1. Non-cash additions include additions from acquisitions of businesses. | |||||||||||||||||||||||||||||
| Issuance of Eurobonds | Nominal value in millions | |||||||||||||
| Interest | Issue date | Maturity | EUR | DKK | ||||||||||
| Mar 2022 | Mar 2025 | |||||||||||||
| May 2024 | May 2026 | |||||||||||||
| Mar 2022 | Sep 2027 | |||||||||||||
| Jun 2021 | Jun 2028 | |||||||||||||
| May 2024 | Jan 2029 | |||||||||||||
| Mar 2022 | Mar 2030 | |||||||||||||
| May 2024 | Jan 2031 | |||||||||||||
| May 2024 | May 2034 | |||||||||||||
| Consolidated financial statements / Notes to the Consolidated financial statement / 4.6 Borrowings | | |||||||||
| Contractual undiscounted cash flows | 2024 | |||||||||||||||||||
| DKK million | Leases | Eurobonds | Loans | Commercial papers | Bank overdrafts | Total | ||||||||||||||
2024 | ||||||||||||||||||||
| Within 1 year | ||||||||||||||||||||
| 1-3 years | ||||||||||||||||||||
| 3-5 years | ||||||||||||||||||||
| More than 5 years | ||||||||||||||||||||
| Total | ||||||||||||||||||||
| Carrying amount end of the year | ||||||||||||||||||||
| Non-current borrowings | ||||||||||||||||||||
| Current borrowings | ||||||||||||||||||||
2023 | ||||||||||||||||||||
| Within 1 year | ||||||||||||||||||||
| 1-3 years | ||||||||||||||||||||
| 3-5 years | ||||||||||||||||||||
| More than 5 years | ||||||||||||||||||||
| Total | ||||||||||||||||||||
| Carrying amount end of the year | ||||||||||||||||||||
| Non-current borrowings | ||||||||||||||||||||
| Current borrowings | ||||||||||||||||||||
| Consolidated financial statements / Notes to the Consolidated financial statement / 4.7 Cash flow statement specifications | | |||||||||
| Other non-cash items | |||||||||||||||||
| DKK million | 2024 | 2023 | 2022 | ||||||||||||||
Interest income and interest expenses, net (note 4.9) | ( | ( | |||||||||||||||
Capital gain/(loss) on investments, net (note 4.9) | |||||||||||||||||
Result of associated companies (note 4.9) | ( | ||||||||||||||||
Share-based payment costs (note 5.1) | |||||||||||||||||
| Increase/(decrease) in provisions and retirement benefit obligations | |||||||||||||||||
| Exchange rate effects on provisions and retirement benefit obligations | ( | ( | |||||||||||||||
| Adjustment for remeasurements of retirement benefit obligations | ( | ||||||||||||||||
| Adjustment of provisions and retirement benefit obligations related to acquisition of businesses | ( | ||||||||||||||||
Unrealised gain/(loss) on fair value hedge through profit or loss (note 4.9) | ( | ( | |||||||||||||||
| Other | ( | ||||||||||||||||
| Total other non-cash items | |||||||||||||||||
| Change in working capital | |||||||||||||||||
| DKK million | 2024 | 2023 | 2022 | ||||||||||||||
| Inventories | ( | ( | ( | ||||||||||||||
| Trade receivables | ( | ( | ( | ||||||||||||||
| Other receivables and prepayments | ( | ( | ( | ||||||||||||||
| Trade payables | |||||||||||||||||
| Other liabilities | |||||||||||||||||
| Adjustment for payables related to non-current assets | ( | ( | ( | ||||||||||||||
| Adjustment related to acquisition of businesses | ( | ||||||||||||||||
Other non-current receivables and prepayments1 | ( | ( | |||||||||||||||
Other non-current liabilities1 | ( | ( | |||||||||||||||
| Change in working capital including exchange rate adjustments | ( | ( | ( | ||||||||||||||
| Exchange rate adjustments | ( | ||||||||||||||||
| Cash flow change in working capital | ( | ( | ( | ||||||||||||||
| 1. Other non-current receivables and prepayments and Other non-current liabilities relating to 2023 and 2022 have been reclassified from Total other non-cash items to Cash flow changes in operating assets, net. | |||||||||||||||||
| Consolidated financial statements / Notes to the Consolidated financial statement / 4.8 Financial assets and liabilities | | |||||||||
| DKK million | 2024 | 2023 | ||||||||||||
| Financial assets by category | ||||||||||||||
| Other financial assets | ||||||||||||||
| Marketable securities | ||||||||||||||
| Financial assets at fair value through the income statement | ||||||||||||||
Derivative financial instruments (note 4.5) | ||||||||||||||
| Derivatives used as hedging instruments (assets) | ||||||||||||||
| Other financial assets | ||||||||||||||
| Trade receivables | ||||||||||||||
| Other receivables and prepayments (current and non-current) | ||||||||||||||
•less prepayments and VAT receivables | ( | ( | ||||||||||||
Cash at bank (note 4.4) | ||||||||||||||
| Financial assets at amortised cost | ||||||||||||||
| Trade receivables eligible for factoring | ||||||||||||||
| Financial assets at fair value through other comprehensive income | ||||||||||||||
| Total financial assets at the end of the year by category | ||||||||||||||
| Financial liabilities by category | ||||||||||||||
Derivative financial instruments (note 4.5) | ||||||||||||||
| Derivatives used as hedging instruments (liability) | ||||||||||||||
Borrowings (non-current) (note 4.6)1 | ||||||||||||||
Borrowings (current) (note 4.6)1 | ||||||||||||||
| Trade payables | ||||||||||||||
| Other liabilities (non-current) | ||||||||||||||
| Other liabilities (current) | ||||||||||||||
•less VAT and duties payable | ( | ( | ||||||||||||
| Financial liabilities measured at amortised cost | ||||||||||||||
| Total financial liabilities at the end of the year by category | ||||||||||||||
1. Refer to note 4.6 for a maturity analysis for non-current and current borrowings. | ||||||||||||||
| Fair value measurement hierarchy | ||||||||||||||
| DKK million | 2024 | 2023 | ||||||||||||
| Active market data (level 1) | ||||||||||||||
| Directly or indirectly observable market data (level 2) | ||||||||||||||
| Not based on observable market data (level 3) | ||||||||||||||
| Total financial assets at fair value | ||||||||||||||
| Active market data (level 1) | ||||||||||||||
| Directly or indirectly observable market data (level 2) | ||||||||||||||
| Not based on observable market data (level 3) | ||||||||||||||
| Total financial liabilities at fair value | ||||||||||||||
| Consolidated financial statements / Notes to the Consolidated financial statement / 4.9 Financial income and expenses | | |||||||||
| DKK million | 2024 | 2023 | 2022 | ||||||||||||||
| Financial income | |||||||||||||||||
Interest income1 | |||||||||||||||||
| Foreign exchange gain (net) | |||||||||||||||||
| Financial gain from forward contracts (net) | |||||||||||||||||
| Capital gain on marketable securities | |||||||||||||||||
| Result of associated companies | |||||||||||||||||
| Total financial income | |||||||||||||||||
| Financial expenses | |||||||||||||||||
| Interest expenses on debts and borrowings | |||||||||||||||||
| Foreign exchange loss (net) | |||||||||||||||||
| Financial loss from forward contracts (net) | |||||||||||||||||
| Capital loss on investments | |||||||||||||||||
| Capital loss on marketable securities | |||||||||||||||||
| Result of associated companies | |||||||||||||||||
| Other financial expenses | |||||||||||||||||
| Total financial expenses | |||||||||||||||||
1. Interest income include DKK | |||||||||||||||||
| Financial impact from forward contracts, specified | |||||||||||||||||
| DKK million | 2024 | 2023 | 2022 | ||||||||||||||
| Income/(loss) transferred from other comprehensive income | ( | ||||||||||||||||
| Realised fair value adjustment of transferred contracts | ( | ( | |||||||||||||||
Unrealised fair value adjustments of forward contracts2 | ( | ( | |||||||||||||||
| Realised foreign exchange gain/(loss) on forward contracts | |||||||||||||||||
| Financial income/(expense) from forward contracts | ( | ||||||||||||||||
| 2. Refer to note 4.5 for information on open fair value hedge contracts at 31 December. | |||||||||||||||||
| Consolidated financial statements / Notes to the Consolidated financial statement / 5.1 Share-based payment schemes | | |||||||||
| Share-based payment expensed in the income statement | ||||||||||||||
| DKK million | 2024 | 2023 | 2022 | |||||||||||
| Restricted stock units to employees | ||||||||||||||
| Long-term share-based incentive programme (Management Board) | ||||||||||||||
| Long-term share-based incentive programme (Management group below Management Board) | ||||||||||||||
| Restricted stock units to individual employees | ||||||||||||||
| Share-based payment expensed in the income statement | ||||||||||||||
| Consolidated financial statements / Notes to the Consolidated financial statement / 5.1 Share-based payment schemes | | |||||||||
| General terms and conditions of 2022-2024 programmes | |||||||||||||||||||||||||||||||||||||||||||||||||||||
| Employees' 100 year anniversary programme | Management Board | Management group below Management Board | Individual employees | ||||||||||||||||||||||||||||||||||||||||||||||||||
| Year of launch | 2023 | 2024 | 2023 | 2022 | 2024 | 2023 | 2022 | 2024 | 2023 | 2022 | |||||||||||||||||||||||||||||||||||||||||||
Preliminary number of shares to be allocated1 (million) | |||||||||||||||||||||||||||||||||||||||||||||||||||||
| Fair value per restricted stock unit at grant date (DKK) | |||||||||||||||||||||||||||||||||||||||||||||||||||||
| Performance and vesting period | 2023 to 2026 | 2024 to 2026 | 2023 to 2025 | 2022 to 2024 | 2024 to 2026 | 2023 to 2025 | 2022 to 2024 | 2024 to 2027 | 2023 to 2026 | 2022 to 2025 | |||||||||||||||||||||||||||||||||||||||||||
| Allocation date | Aug 2026 | Feb 2027 | Feb 2026 | Feb 2025 | Feb 2027 | Feb 2026 | Feb 2025 | 2027 | 2026 | 2025 | |||||||||||||||||||||||||||||||||||||||||||
| Amortisation period | |||||||||||||||||||||||||||||||||||||||||||||||||||||
1. The number of shares to be allocated under the LTIPs to Management Board and management group below Management Board, respectively, may potentially be reduced or increased depending on whether Novo Nordisk's performance during the | |||||||||||||||||||||||||||||||||||||||||||||||||||||
| Consolidated financial statements / Notes to the Consolidated financial statement / 5.2 Commitments | | |||||||||
Contractual obligations not recognised in the balance sheet | |||||||||||||||||
| DKK million (undiscounted) | Current | Non-current | Total | ||||||||||||||
| 2024 | |||||||||||||||||
Leases1 | |||||||||||||||||
| Research and development obligations | |||||||||||||||||
Research and development – potential milestone payments2 | |||||||||||||||||
Commercial product launch – potential milestone payments2 | |||||||||||||||||
| Purchase obligations relating to investments in property, plant and equipment | |||||||||||||||||
| Purchase obligations relating to contract manufacturers | |||||||||||||||||
| Other purchase obligations | |||||||||||||||||
| Total obligations not recognised in the balance sheet | |||||||||||||||||
| 2023 | |||||||||||||||||
Leases1 | |||||||||||||||||
| Research and development obligations | |||||||||||||||||
Research and development – potential milestone payments2 | |||||||||||||||||
Commercial product launch – potential milestone payments2 | |||||||||||||||||
| Purchase obligations relating to investments in property, plant and equipment | |||||||||||||||||
| Purchase obligations relating to contract manufacturers | |||||||||||||||||
| Other purchase obligations | |||||||||||||||||
| Total obligations not recognised in the balance sheet | |||||||||||||||||
| Fair value recognised at date of acquisition | |||||||||||
| 2024 | |||||||||||
| DKK million | Fill-finish sites (Catalent) | Other acquisitions | Total | ||||||||
| Know-how | |||||||||||
| Intellectual property rights and other intangible assets | |||||||||||
| Property, plant and equipment | |||||||||||
| Deferred tax assets (liabilities), net | ( | ||||||||||
| Provisions | ( | ( | |||||||||
| Other net assets | ( | ||||||||||
| Net identifiable assets acquired | |||||||||||
| Goodwill | |||||||||||
| Purchase price | |||||||||||
| Settlement of pre-existing relationships | ( | ( | |||||||||
| Cash consideration transferred | |||||||||||
| Cash acquired | ( | ( | |||||||||
| Cash used for acquisition of businesses; net of cash acquired | |||||||||||
| Consolidated financial statements / Notes to the Consolidated financial statement / 5.4 Related party transactions | | |||||||||
| Material transactions with related parties | ||||||||||||||
| DKK million | 2024 | 2023 | 2022 | |||||||||||
| Novo Holdings A/S | ||||||||||||||
| Purchase of Novo Nordisk B shares | ||||||||||||||
| Acquisition of fill-finish sites (note 5.3) | ||||||||||||||
| Dividend payment to Novo Holdings A/S | ||||||||||||||
| Services provided by Novo Nordisk | ( | ( | ( | |||||||||||
Novonesis Group | ||||||||||||||
| Services provided by Novo Nordisk | ( | ( | ( | |||||||||||
| Services provided by Novonesis | ||||||||||||||
| Altasciences Group | ||||||||||||||
| Services provided by Altasciences | ||||||||||||||
| Other subsidiaries of Novo Holding A/S | ||||||||||||||
| Services provided to Novo Nordisk | ||||||||||||||
| NNIT Group | ||||||||||||||
| Services provided by NNIT | ||||||||||||||
| Consolidated financial statements / Notes to the Consolidated financial statement / 5.5 Fees to statutory auditors | | |||||||||
| Remuneration to Executive Management and Board of Directors | |||||||||||||||||
| DKK million | 2024 | 2023 | 2022 | ||||||||||||||
| Salary and short-term incentive | |||||||||||||||||
| Pension | |||||||||||||||||
Benefits1 | |||||||||||||||||
Long-term incentive2 | |||||||||||||||||
Executive Management in total3 | |||||||||||||||||
Fees to Board of Directors4 | |||||||||||||||||
| Total | |||||||||||||||||
1. In 2024, an amount of DKK a conditional amount payable at the end of employment. 2. Refer to note 5.1 for further information on share-based payment schemes. 3. Total remuneration for persons registered as members of Executive Management with the Danish Business Authority amounts to DKK are registered with the Danish Business Authority. | |||||||||||||||||
| DKK million | 2024 | 2023 | 2022 | ||||||||||||||
Statutory audit1 | |||||||||||||||||
| Audit-related services | |||||||||||||||||
| Tax advisory services | |||||||||||||||||
| Other services | |||||||||||||||||
| Total fees to statutory auditors | |||||||||||||||||
1. Statutory audit fees in 2024 include DKK | |||||||||||||||||
| Consolidated financial statements / Notes to the Consolidated financial statement / 5.7 Companies in the Novo Nordisk Group | | |||||||||
| Activity: | • | Sales and marketing | • | Production | ||||||||||
| • | Research and development | • | Services/investments | |||||||||||
| Company and country | Activity | |||||||||||||||||||
| Parent company | ||||||||||||||||||||
| Novo Nordisk A/S, Denmark | • | • | • | • | ||||||||||||||||
| Subsidiaries by geographical area | ||||||||||||||||||||
| Company and country | Percentage of shares owned | Activity | ||||||||||||||||||
| North America Operations | ||||||||||||||||||||
| Inversago Pharma Inc., Canada | • | |||||||||||||||||||
| Novo Nordisk Canada Inc., Canada | • | |||||||||||||||||||
| Novo Nordisk North America Operations A/S, Denmark | • | |||||||||||||||||||
| Novo Nordisk Inc., US | • | |||||||||||||||||||
| Novo Nordisk Pharmaceutical Industries LP, US | • | |||||||||||||||||||
| Novo Nordisk Pharmatech US, Inc., US | • | |||||||||||||||||||
| Novo Nordisk Pharma, Inc., US | • | |||||||||||||||||||
| NN Corporate Development US, Inc., US | • | |||||||||||||||||||
| NN Research & Development US, Inc., US | • | |||||||||||||||||||
| Novo Nordisk US Bio Production, Inc., US | • | |||||||||||||||||||
| Novo Nordisk US Holdings Inc., US | • | |||||||||||||||||||
| Dicerna Pharmaceuticals, Inc., US | • | |||||||||||||||||||
| Emisphere Technologies, Inc., US | • | |||||||||||||||||||
| Forma Therapeutics, Inc., US | • | |||||||||||||||||||
| Catalent Indiana LLC, US | • | |||||||||||||||||||
| Region International Operations | ||||||||||||||||||||
| Novo Nordisk Pharmaceuticals A/S, Denmark | • | |||||||||||||||||||
| Novo Nordisk Pharma Operations A/S, Denmark | • | • | ||||||||||||||||||
| Novo Nordisk Region AAMEO and LATAM A/S, Denmark | • | |||||||||||||||||||
| Novo Nordisk Region Europe A/S, Denmark | • | |||||||||||||||||||
| Novo Nordisk Region Japan & Korea A/S, Denmark | • | |||||||||||||||||||
| Region EMEA | ||||||||||||||||||||
| Aldaph SpA, Algeria | • | • | ||||||||||||||||||
| Novo Nordisk Pharma GmbH, Austria | • | |||||||||||||||||||
| S.A. Novo Nordisk Pharma N.V., Belgium | • | |||||||||||||||||||
| Catalent Belgium S.A, Belgium | • | |||||||||||||||||||
| Novo Nordisk Pharma d.o.o., Bosnia and Herzegovina | • | |||||||||||||||||||
| Novo Nordisk Pharma EAD, Bulgaria | • | |||||||||||||||||||
| Novo Nordisk Hrvatska d.o.o., Croatia | • | |||||||||||||||||||
| Novo Nordisk s.r.o., Czech Republic | • | |||||||||||||||||||
| Novo Nordisk Production Czech s.r.o, Czech Republic | • | |||||||||||||||||||
| Novo Nordisk Denmark A/S, Denmark | • | |||||||||||||||||||
| Novo Nordisk Pharmatech A/S, Denmark | • | • | ||||||||||||||||||
| Novo Nordisk Egypt LLC, Egypt | • | |||||||||||||||||||
| Novo Nordisk Egypt Pharmaceuticals Ltd., Egypt | • | |||||||||||||||||||
| Company and country | Percentage of shares owned | Activity | ||||||||||||||||||
| Novo Nordisk Estonia OÜ, Estonia | • | |||||||||||||||||||
| Novo Nordisk Farma OY, Finland | • | |||||||||||||||||||
| Biocorp Production S.A., France | • | • | ||||||||||||||||||
| Novo Nordisk, France | • | |||||||||||||||||||
| Novo Nordisk Production SAS, France | • | |||||||||||||||||||
| Novo Nordisk Pharma GmbH, Germany | • | |||||||||||||||||||
| Cardior Pharmaceuticals GmbH, Germany | • | |||||||||||||||||||
| Novo Nordisk Hellas Epe., Greece | • | |||||||||||||||||||
| Novo Nordisk Hungária Kft., Hungary | • | |||||||||||||||||||
| Novo Nordisk Limited, Ireland | • | |||||||||||||||||||
| Novo Nordisk Production Ireland Ltd., Ireland | • | |||||||||||||||||||
| Novo Nordisk Ltd, Israel | • | |||||||||||||||||||
| Novo Nordisk S.P.A., Italy | • | |||||||||||||||||||
| Catalent Anagni S.R.L, Italy | • | |||||||||||||||||||
| Novo Nordisk Kazakhstan LLP, Kazakhstan | • | |||||||||||||||||||
| Novo Nordisk Kenya Ltd., Kenya | • | |||||||||||||||||||
| Novo Nordisk Latvia SIA, Latvia | • | |||||||||||||||||||
| Novo Nordisk Pharma SARL, Lebanon | • | |||||||||||||||||||
| UAB Novo Nordisk Pharma, Lithuania | • | |||||||||||||||||||
| Novo Nordisk Farma dooel, North Macedonia | • | |||||||||||||||||||
| Novo Nordisk Pharma SAS, Morocco | • | |||||||||||||||||||
| Novo Nordisk B.V., Netherlands | • | |||||||||||||||||||
| Novo Nordisk Finance (Netherlands) B.V., Netherlands | • | |||||||||||||||||||
| Novo Nordisk Pharma Limited, Nigeria | • | |||||||||||||||||||
| Novo Nordisk Norway AS, Norway | • | |||||||||||||||||||
| Novo Nordisk Pharmaceutical Services Sp. z.o.o., Poland | • | |||||||||||||||||||
| Novo Nordisk Pharma Sp.z.o.o., Poland | • | |||||||||||||||||||
| Novo Nordisk Portugal, Lda., Portugal | • | |||||||||||||||||||
| Novo Nordisk Farma S.R.L., Romania | • | |||||||||||||||||||
| Novo Nordisk Limited Liability Company, Russia | • | • | ||||||||||||||||||
| Novo Nordisk Production Support LLC, Russia | • | |||||||||||||||||||
| Novo Nordisk Saudi for Trading, Saudi Arabia | • | |||||||||||||||||||
| Novo Nordisk Pharma d.o.o. Belgrade (Serbia), Serbia | • | |||||||||||||||||||
| Novo Nordisk Slovakia s.r.o., Slovakia | • | |||||||||||||||||||
| Novo Nordisk, d.o.o., Slovenia | • | |||||||||||||||||||
| Novo Nordisk (Pty) Limited, South Africa | • | |||||||||||||||||||
| Novo Nordisk Pharma S.A., Spain | • | |||||||||||||||||||
| Novo Nordisk Scandinavia AB, Sweden | • | |||||||||||||||||||
| Novo Nordisk Health Care AG, Switzerland | • | • | • | |||||||||||||||||
| Novo Nordisk Pharma AG, Switzerland | • | |||||||||||||||||||
| Novo Nordisk Tunisie SARL, Tunisia | • | |||||||||||||||||||
| Novo Nordisk Saglik Ürünleri Tic. Ltd. Sti., Turkey | • | |||||||||||||||||||
| Novo Nordisk Ukraine, LLC, Ukraine | • | |||||||||||||||||||
| Novo Nordisk Pharma Gulf FZE, United Arab Emirates | • | |||||||||||||||||||
| Novo Nordisk Limited, UK | • | |||||||||||||||||||
| Novo Nordisk Research Centre Oxford Limited, UK | • | |||||||||||||||||||
| Company and country | Percentage of shares owned | Activity | ||||||||||||||||||
| Region China | ||||||||||||||||||||
| Novo Nordisk (China) Pharmaceuticals Co. Ltd., China | • | • | ||||||||||||||||||
| Novo Nordisk (Shanghai) Pharma Trading Co., Ltd., China | • | |||||||||||||||||||
| Novo Nordisk Region China A/S, Denmark | • | |||||||||||||||||||
| Novo Nordisk Hong Kong Limited, Hong Kong | • | |||||||||||||||||||
| Novo Nordisk Pharma (Taiwan) Ltd., Taiwan | • | |||||||||||||||||||
| Beijing Novo Nordisk Pharmaceuticals Science & Technology Co., Ltd., China | • | |||||||||||||||||||
| Region Rest of World | ||||||||||||||||||||
| Novo Nordisk Pharma Argentina S.A., Argentina | • | |||||||||||||||||||
| Novo Nordisk Pharmaceuticals Pty. Ltd., Australia | • | |||||||||||||||||||
| Novo Nordisk Pharma (Private) Limited, Bangladesh | • | |||||||||||||||||||
| Novo Nordisk Produção Farmacêutica do Brasil Ltda., Brazil | • | |||||||||||||||||||
| Novo Nordisk Farmacêutica do Brasil Ltda., Brazil | • | |||||||||||||||||||
| Novo Nordisk Farmacéutica Limitada, Chile | • | |||||||||||||||||||
| Novo Nordisk Colombia SAS, Colombia | • | |||||||||||||||||||
| Novo Nordisk India Private Limited, India | • | |||||||||||||||||||
| Novo Nordisk Service Centre (India) Pvt. Ltd., India | • | |||||||||||||||||||
| PT. Novo Nordisk Indonesia, Indonesia | • | |||||||||||||||||||
| Novo Nordisk Pars Co. (PJS), Iran | • | • | ||||||||||||||||||
| Novo Nordisk Pharma Ltd., Japan | • | • | ||||||||||||||||||
| Novo Nordisk Pharma (Malaysia) Sdn Bhd, Malaysia | • | |||||||||||||||||||
| Novo Nordisk Pharma Operations Sdn Bhd, Malaysia | • | |||||||||||||||||||
| Novo Nordisk Mexico S.A. de C.V., Mexico | • | |||||||||||||||||||
| Novo Nordisk Service Centre Mexico, Sociedad Anonim, Mexico | • | |||||||||||||||||||
| Novo Nordisk Pharmaceuticals Ltd., New Zealand | • | |||||||||||||||||||
| Novo Nordisk Pharma (Private) Limited, Pakistan | • | |||||||||||||||||||
| Novo Nordisk Panama S.A., Panama | • | |||||||||||||||||||
| Novo Nordisk Peru S.A.C., Peru | • | |||||||||||||||||||
| Novo Nordisk Pharmaceuticals (Philippines) Inc., Philippines | • | |||||||||||||||||||
| Novo Nordisk Pharma (Singapore) Pte Ltd., Singapore | • | |||||||||||||||||||
| Novo Nordisk Pharma Korea Ltd., South Korea | • | |||||||||||||||||||
| Novo Nordisk Lanka (PVT) Ltd, Sri Lanka | • | |||||||||||||||||||
| Novo Nordisk Pharma (Thailand) Ltd., Thailand | • | |||||||||||||||||||
| Novo Nordisk Vietnam Ltd., Vietnam | • | |||||||||||||||||||
| Other subsidiaries and associated companies | ||||||||||||||||||||
| NNE A/S, Denmark | • | |||||||||||||||||||
| NNIT A/S, Denmark | • | |||||||||||||||||||
| CS Solar Fund XIV, LLC, US | • | |||||||||||||||||||
| Part of the Annual review – not audited | | |||||||||
| Part of the Annual review – not audited | | |||||||||
| Net sales in constant exchange rates | |||||||||||||||||
| DKK million | 2024 | 2023 | 2022 | ||||||||||||||
Net sales IFRS | 290,403 | 232,261 | 176,954 | ||||||||||||||
| Effect of exchange rate | 1,575 | 7,658 | (13,024) | ||||||||||||||
| Net sales in constant exchange rates | 291,978 | 239,919 | 163,930 | ||||||||||||||
| Net sales previous year | 232,261 | 176,954 | 140,800 | ||||||||||||||
| % increase/(decrease) in reported currencies | 25.0 | % | 31.3 | % | 25.7 | % | |||||||||||
| % increase/(decrease) in constant exchange rates | 25.7 | % | 35.6 | % | 16.4 | % | |||||||||||
| Operating profit in constant exchange rates | |||||||||||||||||
| DKK million | 2024 | 2023 | 2022 | ||||||||||||||
Operating profit IFRS | 128,339 | 102,574 | 74,809 | ||||||||||||||
| Effect of exchange rate | 1,096 | 4,898 | (7,578) | ||||||||||||||
| Operating profit in constant exchange rates | 129,435 | 107,472 | 67,231 | ||||||||||||||
| Operating profit previous year | 102,574 | 74,809 | 58,644 | ||||||||||||||
| % increase/(decrease) in reported currencies | 25.1 | % | 37.1 | % | 27.6 | % | |||||||||||
| % increase/(decrease) in constant exchange rates | 26.2 | % | 43.7 | % | 14.6 | % | |||||||||||
| EBITDA and EBITDA at constant exchange rates | |||||||||||||||||
| DKK million | 2024 | 2023 | 2022 | ||||||||||||||
Net profit IFRS | 100,988 | 83,683 | 55,525 | ||||||||||||||
Income taxes IFRS | 26,203 | 20,991 | 13,537 | ||||||||||||||
Financial income IFRS | (6,198) | (2,945) | (239) | ||||||||||||||
Financial expenses IFRS | 7,346 | 845 | 5,986 | ||||||||||||||
Operating profit (EBIT) IFRS | 128,339 | 102,574 | 74,809 | ||||||||||||||
| Depreciation and amortisations | 8,545 | 7,289 | 6,553 | ||||||||||||||
| Impairment losses and reversals | 10,562 | 2,124 | 809 | ||||||||||||||
| EBITDA | 147,446 | 111,987 | 82,171 | ||||||||||||||
| Effect of exchange rate | 1,146 | 5,043 | (7,841) | ||||||||||||||
| EBITDA in constant exchange rates | 148,592 | 117,030 | 74,330 | ||||||||||||||
| EBITDA previous year | 111,987 | 82,171 | 64,669 | ||||||||||||||
| % increase/(decrease) in reported currencies | 31.7 | % | 36.3 | % | 27.1 | % | |||||||||||
| % increase/(decrease) in constant exchange rates | 32.7 | % | 42.4 | % | 14.9 | % | |||||||||||
| Part of the Annual review – not audited | | |||||||||
| Operating profit/equity in % | |||||||||||||||||
| DKK million | 2024 | 2023 | 2022 | ||||||||||||||
Operating profit IFRS | 128,339 | 102,574 | 74,809 | ||||||||||||||
/ Equity IFRS | 143,486 | 106,561 | 83,486 | ||||||||||||||
| Operating profit/equity in % | 89.4 | % | 96.3 | % | 89.6 | % | |||||||||||
| ROIC | |||||||||||||||||
| DKK million | 2024 | 2023 | 2022 | ||||||||||||||
| Operating profit after tax | 101,901 | 81,957 | 60,146 | ||||||||||||||
| / Average net operating assets | 159,548 | 92,566 | 81,744 | ||||||||||||||
| ROIC in % | 63.9 | % | 88.5 | % | 73.6 | % | |||||||||||
| DKK million | 2024 | 2023 | 2022 | ||||||||||||||
Operating profit IFRS | 128,339 | 102,574 | 74,809 | ||||||||||||||
| Tax on operating profit (using effective tax rate) | (26,438) | (20,617) | (14,663) | ||||||||||||||
| Operating profit after tax | 101,901 | 81,957 | 60,146 | ||||||||||||||
| DKK million | 2024 | 2023 | 2022 | ||||||||||||||
| Intangible assets | 111,090 | 60,406 | 50,939 | ||||||||||||||
| Property, plant and equipment | 162,488 | 90,961 | 66,671 | ||||||||||||||
| Deferred income tax assets | 24,627 | 20,380 | 13,904 | ||||||||||||||
| Other receivables and prepayments (non-current) | 4,016 | 1,430 | 206 | ||||||||||||||
| Inventories | 40,849 | 31,811 | 24,388 | ||||||||||||||
| Trade receivables | 71,949 | 64,770 | 50,560 | ||||||||||||||
| Tax receivables | 2,853 | 2,423 | 940 | ||||||||||||||
| Other receivables and prepayments (current) | 12,612 | 8,068 | 6,005 | ||||||||||||||
| Deferred income tax liabilities | (5,426) | (10,162) | (7,061) | ||||||||||||||
| Retirement benefit obligations | (903) | (742) | (762) | ||||||||||||||
| Other liabilities (non-current) | (23) | (189) | (100) | ||||||||||||||
| Provisions (non-current) | (8,755) | (6,649) | (4,590) | ||||||||||||||
| Trade payables | (28,846) | (25,606) | (15,587) | ||||||||||||||
| Tax payables | (9,716) | (7,116) | (7,091) | ||||||||||||||
| Other liabilities (current) | (37,993) | (28,705) | (23,606) | ||||||||||||||
| Provisions (current) | (120,329) | (100,478) | (70,287) | ||||||||||||||
| Net operating assets | 218,493 | 100,602 | 84,529 | ||||||||||||||
| Average net operating assets | 159,548 | 92,566 | 81,744 | ||||||||||||||
| DKK million | 2024 | 2023 | 2022 | ||||||||||||||
Equity IFRS | 143,486 | 106,561 | 83,486 | ||||||||||||||
| Investment in associated companies | (400) | (410) | (327) | ||||||||||||||
| Other financial assets | (2,277) | (1,253) | (1,016) | ||||||||||||||
| Marketable securities | (10,653) | (15,838) | (10,921) | ||||||||||||||
| Derivative financial instruments | (6,326) | (2,344) | (2,727) | ||||||||||||||
| Cash at bank | (15,655) | (14,392) | (12,653) | ||||||||||||||
| Borrowings – non-current | 89,674 | 20,528 | 24,318 | ||||||||||||||
| Borrowings – current | 13,113 | 6,478 | 1,466 | ||||||||||||||
| Derivative financial instruments | 7,531 | 1,272 | 2,903 | ||||||||||||||
| Net operating assets | 218,493 | 100,602 | 84,529 | ||||||||||||||
| Part of the Annual review – not audited | | |||||||||
| Free cash flow | |||||||||||||||||
| DKK million | 2024 | 2023 | 2022 | ||||||||||||||
Net cash generated from operating activities IFRS | 120,968 | 108,908 | 78,887 | ||||||||||||||
Net cash used in investing activities IFRS | (128,895) | (43,892) | (24,918) | ||||||||||||||
Net purchase/(net sale) of marketable securities IFRS | (5,363) | 4,758 | 2,921 | ||||||||||||||
Addition on marketable securities through acquisition of business IFRS | — | — | 1,470 | ||||||||||||||
Repayment on lease liabilities IFRS | (1,417) | (1,448) | (998) | ||||||||||||||
| Free cash flow | (14,707) | 68,326 | 57,362 | ||||||||||||||
| Cash flow from operating activities/net profit in % | |||||||||||||||||
| DKK million | 2024 | 2023 | 2022 | ||||||||||||||
Net cash generated from operating activities IFRS | 120,968 | 108,908 | 78,887 | ||||||||||||||
/ Net profit IFRS | 100,988 | 83,683 | 55,525 | ||||||||||||||
| Cash flow from operating activities/net profit in % | 119.8 | % | 130.1 | % | 142.1 | % | |||||||||||
| Cash to earnings | |||||||||||||||||
| DKK million | 2024 | 2023 | 2022 | ||||||||||||||
| Free cash flow | (14,707) | 68,326 | 57,362 | ||||||||||||||
/ Net profit IFRS | 100,988 | 83,683 | 55,525 | ||||||||||||||
| Cash to earnings | (14.6%) | 81.6 | % | 103.3 | % | ||||||||||||
| Statements and Auditor´s Report / Statement by the Board of Directors and Executive Management | | |||||||||
| Registered Executive Management | Board of Directors | |||||||||||||||||||||||||||||||
| Lars Fruergaard Jørgensen President and CEO | Karsten Munk Knudsen CFO | Helge Lund Chair | Henrik Poulsen Vice Chair | Elisabeth Dahl Christensen | Laurence Debroux | |||||||||||||||||||||||||||
| Andreas Fibig | Sylvie Grégoire | Liselotte Hyveled | Mette Bøjer Jensen | |||||||||||||||||||||||||||||
| Kasim Kutay | Christina Law | Martin Mackay | Thomas Rantzau | |||||||||||||||||||||||||||||
| Financial statements and additional information | | |||||||||
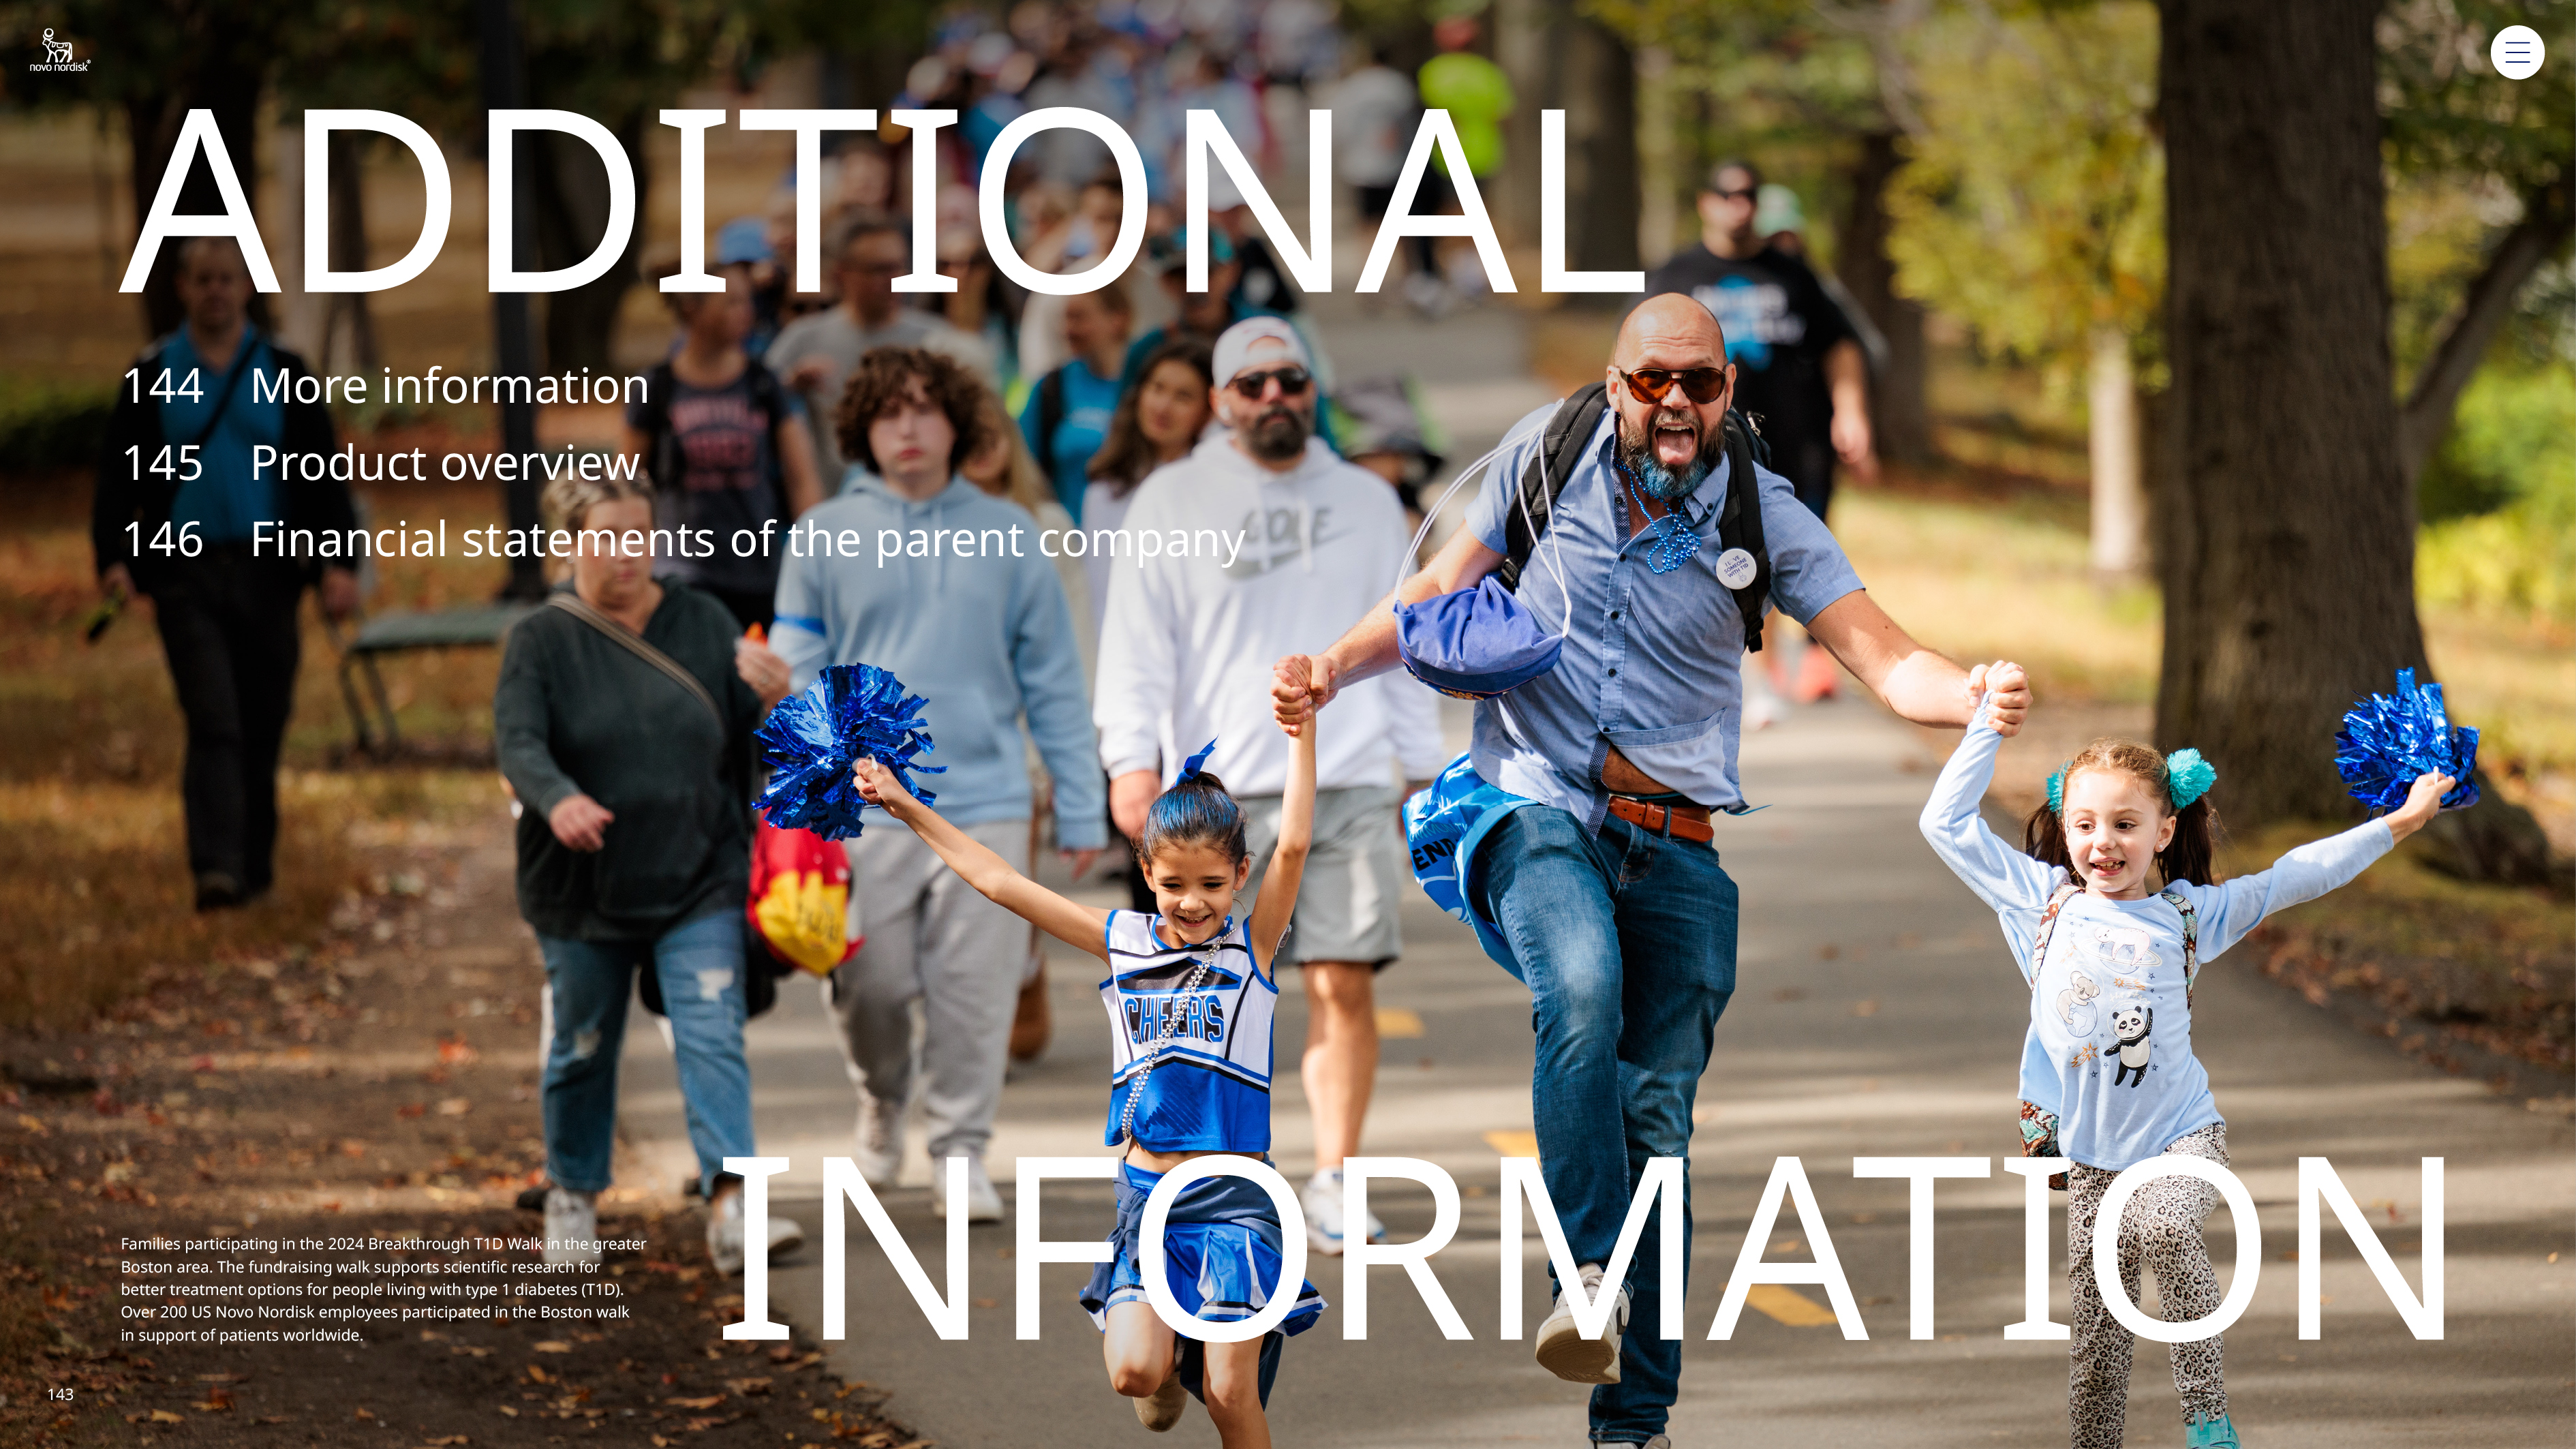
| Financial statements and additional information / Additional information / More information | | |||||||||
| Financial statements and additional information / Additional information / Product overview | | |||||||||
Product overview1 | |||||||||||
| | | |||||||||
Once-weekly insulin •Awiqli®, insulin icodec New generation insulin and combinations •Tresiba®, insulin degludec •Ryzodeg®, insulin degludec/insulin aspart •Fiasp®, fast-acting insulin aspart •Xultophy®2, insulin degludec/liraglutide Modern insulin •Levemir®, insulin detemir •NovoRapid®3, insulin aspart •NovoMix® 30, biphasic insulin aspart •NovoMix® 50, biphasic insulin aspart Human insulin •Insulatard® isophane (NPH) insulin •Actrapid®, regular human insulin •Mixtard® 30, biphasic human insulin •Mixtard® 50, biphasic human insulin Glucagon-like peptide-1 •Victoza®, liraglutide •Ozempic®, semaglutide •Rybelsus®, oral semaglutide Pre-filled delivery systems •FlexTouch®, U100, U200 •FlexPen® •InnoLet® •Ozempic®, FlexTouch® | Durable delivery systems •NovoPen® 6 •NovoPen® 5 •NovoPen® 4 •NovoPen Echo® Plus •NovoPen Echo® Other delivery systems •PumpCart®, NovoRapid® and Fiasp® cartridge to be used in pump •Penfill® cartridge •Mallya® Oral antidiabetic agents •NovoNorm®, repaglinide Glucagon •GlucaGen®, glucagon (vial and Hypokit®) •Zegalogue®, dasiglucagon Needles •NovoFine® Plus •NovoFine® •NovoTwist® •NovoFine® AutoCover® | Glucagon-like peptide-1 •Saxenda®, liraglutide 3.0 mg •Wegovy®, semaglutide 2.4 mg Obesity delivery systems •Saxenda®, FlexTouch® •Wegovy®, Single Dose Device and FlexTouch® | Rare blood disorders •NovoSeven®, eptacog alfa (recombinant activated factor VII) •NovoEight®4, turoctocog alfa (recombinant factor VIII) •Esperoct®, turoctocog alfa pegol, N8-GP (recombinant factor VIII) •Alhemo®, concizumab (anti-TFPI monoclonal antibody) •Refixia®5, nonacog beta pegol, N9-GP (recombinant factor IX) •NovoThirteen®6, catridecacog (recombinant factor XIII) Rare haemato-renal disorders •Rivfloza™, nedosiran (small interfering RNA) Rare endocrine disorders •Norditropin®, somatropin (rDNA origin) •Sogroya®, somapacitan (rDNA origin) Pre-filled human growth hormone delivery systems •FlexPro® •NordiFlex® Other delivery systems •PenMate®, automatic needle inserter for FlexPro® Hormone replacement therapies •Vagifem®7, estradiol hemihydrate •Activelle®, estradiol/norethisterone acetate •Kliogest®, estradiol/norethisterone acetate •Novofem®, estradiol/norethisterone acetate •Trisequens®, estradiol/norethisterone acetate •Estrofem®, estradiol | ||||||||
1. Products listed may not be available or approved in all markets. 2. In the US approved under the brand name Xultophy® 100/3.6. 3. In the US called NovoLog®. 4. In the US written Novoeight®. 5. In the US approved under the name of REBINYN®. 6. In the US approved under the name tretten®. 7. In the UK also called gina®. | |||||||||||
| Financial statements and additional information / Financial statements of the parent company 2024 | | |||||||||
| DKK million | Note | 2024 | 2023 | ||||||||||||||
| Net sales | 2 | 261,712 | 198,078 | ||||||||||||||
| Cost of goods sold | 3 | (48,930) | (38,433) | ||||||||||||||
| Gross profit | 212,782 | 159,645 | |||||||||||||||
| Sales and distribution costs | 3 | (48,921) | (42,291) | ||||||||||||||
| Research and development costs | 3 | (40,296) | (28,731) | ||||||||||||||
| Administrative costs | 3 | (1,905) | (2,002) | ||||||||||||||
| Other operating income and expenses | 692 | 1,315 | |||||||||||||||
| Operating profit | 122,352 | 87,936 | |||||||||||||||
| Profit in subsidiaries, net of tax | 8 | 8,578 | 15,973 | ||||||||||||||
| Financial income | 4 | 6,230 | 3,636 | ||||||||||||||
| Financial expenses | 4 | (12,568) | (4,581) | ||||||||||||||
| Profit before income taxes | 124,592 | 102,964 | |||||||||||||||
| Income taxes | (22,908) | (19,557) | |||||||||||||||
| Net profit | 101,684 | 83,407 | |||||||||||||||
| DKK million | Note | 2024 | 2023 | ||||||||||||||
| Assets | |||||||||||||||||
| Intangible assets | 6 | 93,202 | 28,755 | ||||||||||||||
| Property, plant and equipment | 7 | 86,376 | 53,822 | ||||||||||||||
| Financial assets | 8 | 116,186 | 87,543 | ||||||||||||||
| Other receivables and prepayments | 9 | 3,429 | 1,238 | ||||||||||||||
| Total non-current assets | 299,193 | 171,358 | |||||||||||||||
| Raw materials | 11,075 | 8,415 | |||||||||||||||
| Work in progress | 20,439 | 16,211 | |||||||||||||||
| Finished goods | 5,038 | 4,311 | |||||||||||||||
| Inventories | 36,552 | 28,937 | |||||||||||||||
| Trade receivables | 3,289 | 2,348 | |||||||||||||||
| Amounts owed by affiliated companies | 47,106 | 30,398 | |||||||||||||||
| Tax receivables | 7 | 8 | |||||||||||||||
| Other receivables and prepayments | 9 | 6,402 | 5,494 | ||||||||||||||
| Receivables | 56,804 | 38,248 | |||||||||||||||
| Marketable securities | 10,653 | 15,838 | |||||||||||||||
| Derivative financial instruments | 11 | 6,326 | 2,344 | ||||||||||||||
| Cash at bank | 11,750 | 10,623 | |||||||||||||||
| Total current assets | 122,085 | 95,990 | |||||||||||||||
| Total assets | 421,278 | 267,348 | |||||||||||||||
| DKK million | Note | 2024 | 2023 | ||||||||||||||
| Equity and liabilities | |||||||||||||||||
| Share capital | 10 | 446 | 451 | ||||||||||||||
| Net revaluation reserve | 18,952 | 24,696 | |||||||||||||||
| Development costs reserve | 1,994 | 1,756 | |||||||||||||||
| Reserve for cash flow hedges and exchange rate adjustments | (4,243) | 1,594 | |||||||||||||||
| Retained earnings | 126,174 | 77,185 | |||||||||||||||
| Total equity | 143,323 | 105,682 | |||||||||||||||
| Borrowings | 12 | 85,368 | 16,855 | ||||||||||||||
| Deferred income tax liabilities | 5 | 4,886 | 6,282 | ||||||||||||||
| Other provisions | 13 | 1,576 | 1,280 | ||||||||||||||
| Total non-current liabilities | 91,830 | 24,417 | |||||||||||||||
| Borrowings | 12 | 11,557 | 5,072 | ||||||||||||||
| Derivative financial instruments | 11 | 7,531 | 1,272 | ||||||||||||||
| Trade payables | 9,099 | 6,778 | |||||||||||||||
| Amounts owed to affiliated companies | 137,678 | 108,865 | |||||||||||||||
| Tax payables | 3,883 | 3,046 | |||||||||||||||
| Other liabilities | 16,377 | 12,216 | |||||||||||||||
| Total current liabilities | 186,125 | 137,249 | |||||||||||||||
| Total liabilities | 277,955 | 161,666 | |||||||||||||||
| Total equity and liabilities | 421,278 | 267,348 | |||||||||||||||
| Financial statements and additional information / Financial statements of the parent company 2024 | | |||||||||
| DKK million | Share capital | Net revaluation reserve | Development costs reserve | Reserve for cash flow hedges and exchange rate adjustments | Retained earnings | 2024 | 2023 | ||||||||||||||||||||||
| Balance at the beginning of the year | 451 | 24,696 | 1,756 | 1,594 | 77,185 | 105,682 | 82,901 | ||||||||||||||||||||||
| Appropriated from net profit | 59,946 | 59,946 | 33,116 | ||||||||||||||||||||||||||
| Appropriated from net profit to net revaluation reserve | (8,945) | (8,945) | 8,304 | ||||||||||||||||||||||||||
| Exchange rate adjustments of investments in subsidiaries | 3,201 | (135) | 3,066 | (1,393) | |||||||||||||||||||||||||
| Realisation of previously deferred (gains)/losses on cash flow hedges | (1,547) | (1,547) | (998) | ||||||||||||||||||||||||||
| Deferred gains/(losses) on cash flow hedges incurred during the period | (5,763) | (5,763) | 1,547 | ||||||||||||||||||||||||||
| Tax related to cash flow hedges | 1,608 | 1,608 | (121) | ||||||||||||||||||||||||||
| Development costs | 238 | (238) | — | — | |||||||||||||||||||||||||
| Other adjustments | 155 | 155 | (496) | ||||||||||||||||||||||||||
| Transactions with owners: | |||||||||||||||||||||||||||||
| Total dividend for the year | 50,683 | 50,683 | 41,987 | ||||||||||||||||||||||||||
| Interim dividends paid during the year | (15,583) | (15,583) | (13,430) | ||||||||||||||||||||||||||
| Dividends paid for prior year | (28,557) | (28,557) | (18,337) | ||||||||||||||||||||||||||
| Reduction of the B share capital | (5) | 5 | — | — | |||||||||||||||||||||||||
| Purchase of treasury shares | (20,181) | (20,181) | (29,924) | ||||||||||||||||||||||||||
| Share-based payments (note 3) | 626 | 626 | 562 | ||||||||||||||||||||||||||
| Share-based payments in subsidiaries | 1,663 | 1,663 | 1,587 | ||||||||||||||||||||||||||
| Tax related to share-based payments | 470 | 470 | 377 | ||||||||||||||||||||||||||
| Balance at the end of the year | 446 | 18,952 | 1,994 | (4,243) | 126,174 | 143,323 | 105,682 | ||||||||||||||||||||||
| Proposed appropriation of net profit: | |||||||||||||||||||||||||||||
| Interim dividend for the year | 15,583 | 13,430 | |||||||||||||||||||||||||||
| Final dividend for the year | 35,100 | 28,557 | |||||||||||||||||||||||||||
| Appropriated to net revaluation reserve | (8,945) | 8,304 | |||||||||||||||||||||||||||
| Transferred to retained earnings | 59,946 | 33,116 | |||||||||||||||||||||||||||
| Distribution of net profit | 101,684 | 83,407 | |||||||||||||||||||||||||||
Refer to note 4.3 in the Consolidated financial statements for details on the number of shares, treasury shares and total number of A and B shares in Novo Nordisk A/S. | |||||||||||||||||||||||||||||
| Financial statements and additional information / Financial statements of the parent company 2024 | | |||||||||
| DKK million | 2024 | 2023 | ||||||||||||
| Sales by segment | ||||||||||||||
| Diabetes and Obesity care | 261,556 | 197,969 | ||||||||||||
| Rare disease | 156 | 109 | ||||||||||||
| Total sales | 261,712 | 198,078 | ||||||||||||
| Sales by geographical segment | ||||||||||||||
| North America Operations | 165,689 | 124,860 | ||||||||||||
| International Operations: | ||||||||||||||
| EMEA | 47,810 | 40,038 | ||||||||||||
| Region China | 23,356 | 12,800 | ||||||||||||
| Rest of World | 24,857 | 20,380 | ||||||||||||
| Total sales | 261,712 | 198,078 | ||||||||||||
| DKK million | 2024 | 2023 | ||||||||||||
| Wages and salaries | 25,252 | 19,525 | ||||||||||||
| Share-based payment costs | 626 | 562 | ||||||||||||
| Pensions | 2,211 | 1,709 | ||||||||||||
| Other social security contributions | 417 | 301 | ||||||||||||
| Other employee costs | 1,371 | 1,039 | ||||||||||||
| Total employee costs | 29,877 | 23,136 | ||||||||||||
| Average number of full-time employees | 29,288 | 23,754 | ||||||||||||
| Year-end number of full-time employees | 31,096 | 26,111 | ||||||||||||
| DKK million | 2024 | 2023 | ||||||||||||
| Interest income relating to subsidiaries | 227 | 487 | ||||||||||||
| Interest income relating to external counterparties | 1,589 | 936 | ||||||||||||
| Foreign exchange gain (net) | — | 772 | ||||||||||||
| Financial gain from forward contracts (net) | 4,355 | 1,263 | ||||||||||||
| Capital gain from marketable securities (net) | 2 | 144 | ||||||||||||
| Other financial income | 57 | 34 | ||||||||||||
| Total financial income | 6,230 | 3,636 | ||||||||||||
| Interest expenses relating to subsidiaries | 6,763 | 4,225 | ||||||||||||
| Interest expense relating to external counterparties | 529 | 148 | ||||||||||||
| Result of associated company | 4 | 38 | ||||||||||||
| Foreign exchange loss (net) | 5,076 | — | ||||||||||||
| Other financial expenses | 196 | 170 | ||||||||||||
| Total financial expenses | 12,568 | 4,581 | ||||||||||||
| DKK million | 2024 | 2023 | ||||||||||||
| Net deferred tax asset/(liability) at the beginning of the year | (6,282) | (2,967) | ||||||||||||
| Income/(charge) to the income statement | (349) | (2,797) | ||||||||||||
| Additions from acquisitions | 254 | — | ||||||||||||
| Income/(charge) to equity | 1,491 | (518) | ||||||||||||
| Net deferred tax asset/(liability) at the end of the year | (4,886) | (6,282) | ||||||||||||
| Financial statements and additional information / Financial statements of the parent company 2024 | | |||||||||
| DKK million | Intellectual property rights and similar rights | Software and other intangibles | 2024 | 2023 | |||||||||||||||||||
| Cost at the beginning of the year | 31,514 | 4,143 | 35,657 | 23,820 | |||||||||||||||||||
| Additions during the year | 72,095 | 597 | 72,692 | 11,837 | |||||||||||||||||||
| Disposals during the year | (949) | (70) | (1,019) | — | |||||||||||||||||||
| Cost at the end of the year | 102,660 | 4,670 | 107,330 | 35,657 | |||||||||||||||||||
| Amortisation at the beginning of the year | 5,011 | 1,891 | 6,902 | 4,371 | |||||||||||||||||||
| Amortisation during the year | 1,178 | 221 | 1,399 | 1,011 | |||||||||||||||||||
| Impairment losses for the year | 5,985 | 71 | 6,056 | 1,520 | |||||||||||||||||||
| Amortisation and impairment losses reversed on disposals during the year | (159) | (70) | (229) | — | |||||||||||||||||||
| Amortisation at the end of the year | 12,015 | 2,113 | 14,128 | 6,902 | |||||||||||||||||||
| Carrying amount at the end of the year | 90,645 | 2,557 | 93,202 | 28,755 | |||||||||||||||||||
Intangible assets primarily relate to intellectual property rights, access to capacity asset amounting to DKK 57,496 million (acquired in 2024), internally developed software and costs related to major IT projects. Intangible assets which are not yet available for use amount to DKK 17,610 million (DKK 19,993 million in 2023). For further information on impairments, refer to note 3.1 in the Consolidated financial statements. | |||||||||||||||||||||||
| DKK million | Land and buildings | Plant and machinery | Other equipment | Assets under construction | 2024 | 2023 | ||||||||||||||||||||
| Cost at the beginning of the year | 24,890 | 25,554 | 4,882 | 31,025 | 86,351 | 65,692 | ||||||||||||||||||||
| Additions during the year | 1,127 | 337 | 171 | 34,184 | 35,819 | 22,420 | ||||||||||||||||||||
| Disposals during the year | (135) | (375) | (180) | (244) | (934) | (1,761) | ||||||||||||||||||||
| Transfer from/(to) other items | 1,286 | 2,388 | 261 | (3,935) | — | — | ||||||||||||||||||||
| Cost at the end of the year | 27,168 | 27,904 | 5,134 | 61,030 | 121,236 | 86,351 | ||||||||||||||||||||
| Depreciation and impairment losses at the beginning of the year | 12,149 | 17,310 | 3,070 | — | 32,529 | 31,145 | ||||||||||||||||||||
| Depreciation for the year | 1,297 | 1,248 | 393 | — | 2,938 | 2,748 | ||||||||||||||||||||
| Impairment losses for the year | 22 | 50 | 6 | 244 | 322 | 409 | ||||||||||||||||||||
| Depreciation reversed on disposals during the year | (130) | (378) | (177) | (244) | (929) | (1,773) | ||||||||||||||||||||
| Depreciation and impairment losses at the end of the year | 13,338 | 18,230 | 3,292 | — | 34,860 | 32,529 | ||||||||||||||||||||
| Carrying amount at the end of the year | 13,830 | 9,674 | 1,842 | 61,030 | 86,376 | 53,822 | ||||||||||||||||||||
| Of which related to leased property, plant and equipment | 1,377 | — | 84 | — | 1,461 | 1,083 | ||||||||||||||||||||
| Leased property, plant and equipment primarily relates to lease of office buildings, warehouses, laboratories and vehicles. | ||||||||||||||||||||||||||
| Financial statements and additional information / Financial statements of the parent company 2024 | | |||||||||
| DKK million | Investments in subsidiaries | Amounts owed by affiliated companies | Investment in associated company | Other securities and investments | 2024 | 2023 | ||||||||||||||||||||
| Cost at the beginning of the year | 59,801 | 2,447 | 105 | 818 | 63,171 | 60,497 | ||||||||||||||||||||
| Investments during the year | 33,977 | 868 | 145 | 34,990 | 6,094 | |||||||||||||||||||||
| Divestments and repayments during the year | — | (476) | — | (476) | (3,420) | |||||||||||||||||||||
| Cost at the end of the year | 93,778 | 2,839 | 105 | 963 | 97,685 | 63,171 | ||||||||||||||||||||
| Value adjustments at the beginning of the year | 41,271 | 21 | 52 | (345) | 40,999 | 34,521 | ||||||||||||||||||||
| Profit/(loss) before tax | 20,823 | 20,823 | 18,112 | |||||||||||||||||||||||
| Share of result after tax in associated company | (4) | (4) | (38) | |||||||||||||||||||||||
| Income taxes on profit for the year | (3,377) | (3,377) | (1,332) | |||||||||||||||||||||||
| Market value adjustment | (34) | (34) | (6) | |||||||||||||||||||||||
| Dividends received | (21,762) | (21,762) | (9,127) | |||||||||||||||||||||||
| Divestments during the year | — | — | — | 54 | ||||||||||||||||||||||
| Effect of exchange rate adjustment charged to the income statement | 24 | 18 | 42 | (367) | ||||||||||||||||||||||
| Effect of exchange rate adjustment charged to equity | 2,920 | (135) | 2,785 | (2,285) | ||||||||||||||||||||||
| Other adjustments | 4,243 | 4,243 | 1,467 | |||||||||||||||||||||||
| Value adjustments at the end of the year | 44,118 | (90) | 48 | (361) | 43,715 | 40,999 | ||||||||||||||||||||
| Unrealised internal profit at the beginning of the year | (16,627) | (16,627) | (16,712) | |||||||||||||||||||||||
| Unrealised internal profit movements in the year | (8,868) | (8,868) | (807) | |||||||||||||||||||||||
| Effect of exchange rate adjustment charged to equity | 281 | 281 | 892 | |||||||||||||||||||||||
| Unrealised internal profit at the end of the year | (25,214) | — | — | — | (25,214) | (16,627) | ||||||||||||||||||||
| Carrying amount at the end of the year | 112,682 | 2,749 | 153 | 602 | 116,186 | 87,543 | ||||||||||||||||||||
For a list of companies in the Novo Nordisk Group, refer to note 5.7 in the Consolidated financial statements. | ||||||||||||||||||||||||||
| DKK million | 2024 | 2023 | ||||||||||||
| Within 1 year | 11,557 | 5,072 | ||||||||||||
| 1-5 years | 63,815 | 12,889 | ||||||||||||
| More than 5 years | 21,553 | 3,966 | ||||||||||||
| Total borrowings | 96,925 | 21,927 | ||||||||||||
| Financial statements and additional information / Financial statements of the parent company 2024 | | |||||||||
| DKK million | 2024 | 2023 | ||||||||||||
Statutory audit1 | 14 | 9 | ||||||||||||
| Audit-related services | 3 | 2 | ||||||||||||
| Tax advisory services | 4 | 4 | ||||||||||||
| Other services | 13 | 15 | ||||||||||||
| Total fee to statutory auditors | 34 | 30 | ||||||||||||
1. 2024 statutory audit fee includes DKK 5 million of additional fees mainly related to business acquisitions | ||||||||||||||
| DKK million | 2024 | 2023 | ||||||||||||
| Commitments | ||||||||||||||
Leases1 | 2,657 | 804 | ||||||||||||
| Research and development obligations | 31,511 | 18,448 | ||||||||||||
Research and development - potential milestones2 | 33,614 | 25,218 | ||||||||||||
Commercial product launch - potential milestones2 | 15,749 | 11,780 | ||||||||||||
| Purchase obligations relating to investments in property plant and equipment | 4,956 | 1,072 | ||||||||||||
| Purchase obligation relating to contract manufacturers | 71,061 | 33,107 | ||||||||||||
| Other purchase obligations | 5,027 | 2,742 | ||||||||||||
Guarantees given for subsidiaries3 | 68,081 | 35,608 | ||||||||||||
| Other guarantees | 1,003 | 993 | ||||||||||||
| 1. Lease commitments predominantly relate to lease agreements executed but not commenced and estimated variable property taxes and low value assets. 2. Potential milestone payments are associated with uncertainty as they are linked to successful achievements in research activities; refer to note 5.2 in the Consolidated financial statements. 3. Guarantees given for subsidiaries mainly relate to guarantees towards Novo Nordisk Finance (Netherlands) B.V. related to issuance of Eurobonds. | ||||||||||||||