Management’s
Discussion and
Analysis
For the year ended December 31, 2024
Management’s
Discussion and
Analysis
For the year ended December 31, 2024
| Page |
1 | |
2 | |
3 | |
4 | |
9 | |
9 | |
10 | |
10 | |
11 | |
11 | |
12 | |
14 | |
14 | |
14 | |
14 | |
15 | |
15 | |
15 | |
16 | |
16 | |
16 | |
17 | |
17 | |
17 | |
17 | |
19 | |
20 | |
20 | |
21 | |
21 | |
34 | |
34 | |
35 | |
35 | |
35 | |
36 | |
40 | |
40 | |
41 | |
42 | |
42 | |
43 | |
43 | |
43 | |
44 | |
44 | |
44 | |
46 | |
46 | |
48 | |
Free Cash Flow and Free Cash Flow before Changes in Non-Cash Components of Working Capital | 49 |
Total Cash Costs per Ounce of Gold Produced and Minesite Costs per Tonne | 49 |
56 | |
58 | |
58 | |
59 | |
61 |
This Management’s Discussion and Analysis (“MD&A”) dated February 13, 2025 of Agnico Eagle Mines Limited (“Agnico Eagle” or the “Company”) should be read in conjunction with the Company’s consolidated annual financial statements for the year ended December 31, 2024 that were prepared in accordance with International Financial Reporting Standards (“IFRS”) as issued by the International Accounting Standards Board (“IASB”) (the “Annual Financial Statements”). The Annual Financial Statements and this MD&A are presented in United States dollars (“US dollars”, “$” or “US$”) and all units of measurement are expressed using the metric system unless otherwise specified. Certain information in this MD&A is presented in Canadian dollars (“C$”), Mexican pesos, European Union euros (“Euros” or “€”) or Australian dollars (“A$”). Additional information relating to the Company, including the Company’s Annual Information Form for the year ended December 31, 2023 (the ”AIF”), is available on the Canadian Securities Administrators’ (the ”CSA”) SEDAR+ website at www.sedarplus.ca and the Form 40-F is on file with the Securities and Exchange Commission (“SEC”) at www.sec.gov/edgar.
Certain statements contained in this MD&A, referred to herein as “forward-looking statements”, constitute “forward-looking information” under the provisions of Canadian provincial securities laws and constitute “forward-looking statements” within the meaning of the United States Private Securities Litigation Reform Act of 1995. See “Forward-Looking Statements” in this MD&A.
This MD&A discloses certain financial performance measures, including “total cash costs per ounce”, “all-in sustaining costs per ounce” (also referred to as “AISC per ounce”), “minesite costs per tonne”, “adjusted net income”, “adjusted net income per share”, “earnings before interest, taxes, depreciation and amortization” (also referred to as “EBITDA”), “adjusted earnings before interest, taxes, depreciation and amortization” (also referred to as “adjusted EBITDA”), “free cash flow”, “free cash flow before changes in non-cash components of working capital”, “sustaining capital expenditures”, “development capital expenditures” and “operating margin” that are not standardized measures under IFRS. These measures may not be comparable to similar measures reported by other gold producers. For a discussion of the composition and usefulness of these measures and reconciliation of each of them to the most directly comparable financial information presented in the annual consolidated financial statements prepared in accordance with IFRS, see “Non-GAAP Financial Performance Measures” in this MD&A.
This MD&A also contains information as to estimated future total cash costs per ounce, AISC per ounce and minesite costs per tonne. The estimates are based upon the total cash costs per ounce, AISC per ounce and minesite costs per tonne that the Company expects to incur to mine gold at its mines and projects and, consistent with the reconciliation of these actual costs referred to below under “Non-GAAP Financial Performance Measures”, do not include production costs attributable to accretion expense and other asset retirement costs, which will vary over time as each project is developed and mined. It is therefore not practicable to reconcile these forward-looking non-GAAP financial measures to the most comparable IFRS measure.
Payable production (a non-GAAP non-financial performance measure) is the quantity of mineral produced during a period contained in products that have been or will be sold by the Company, whether such products are sold during the period or held as inventories at the end of the period. Unless otherwise stated per ounce measures such as “production costs per ounce”, “total cash costs per ounce” and “AISC per ounce” are reported on a “per ounce of gold produced” basis.
The mineral reserve and mineral resource estimates contained in this MD&A have been prepared in accordance with the Canadian Securities Administrators’ (the “CSA”) National Instrument 43-101 “Standards of Disclosure for Mineral Projects” (“NI 43-101”). See “Note to Investors Concerning Estimates of Mineral Reserves and Mineral Resources”.
Unless otherwise stated, references to “LaRonde”, “Canadian Malartic”, “Meadowbank” and “Goldex” are to the Company’s operations at the LaRonde complex, the Canadian Malartic complex, the Meadowbank complex and the Goldex complex, respectively. The LaRonde complex consists of the mill and processing operations at the LaRonde mine and the LaRonde Zone 5 mine (“LZ5”). The Canadian Malartic complex consists of the mill and processing operations at the Canadian Malartic mine and the Odyssey mine. The Meadowbank complex consists of the mill and processing operations at the Meadowbank mine and the Amaruq mine. The Goldex complex consists of the mill and processing operations at the Goldex mine and the Akasaba West open pit mine (the “Akasaba West mine”). References to other operations are to the relevant mines, projects or properties, as applicable.
On March 31, 2023, Agnico Eagle closed the transaction (the “Yamana Transaction”) with Pan American Silver Corp. and Yamana Gold Inc. (“Yamana”) pursuant to which, among other things, Agnico Eagle acquired all of Yamana’s Canadian assets including the 50% of the Canadian Malartic that Agnico Eagle did not then hold. Accordingly, contributions from the 100% interest in Canadian Malartic have been included in the consolidated statements of income for the year ended December 31, 2024 while the comparative period reflects the previously held 50% interest in Canadian Malartic up to and including March 30, 2023.
Meaning of ‘‘including’’ and ‘‘such as’’: When used in this MD&A the terms ‘‘including’’ and ‘‘such as’’ mean including and such as, without limitation, respectively.
Agnico Eagle is a senior Canadian gold mining company that has produced precious metals since its formation in 1972. The Company’s mines are located in Canada, Australia, Finland and Mexico, with exploration and development activities in these countries as well as the United States. The Company and its shareholders have full exposure to gold prices due to the Company’s long-standing policy of no forward gold sales. Agnico Eagle has declared a cash dividend every year since 1983.
Agnico Eagle earns a significant proportion of its revenue and cash flow from the production and sale of gold in both doré bar and concentrate form. The remainder of revenue and cash flow is generated by the production and sale of by-product metals, primarily silver, zinc and copper. In 2024, Agnico Eagle recorded production costs per ounce of $885 and total cash costs per ounce(i) of $903 on a by-product basis and $940 on a co-product basis on payable production of 3,485,336 ounces of gold. The average realized price of gold increased by 22.5% from $1,946 per ounce in 2023 to $2,384 per ounce of payable production in 2024.
Agnico Eagle’s operating mines and development projects are located in what the Company believes to be politically stable countries that are supportive of the mining industry. The political stability of the regions in which Agnico Eagle operates helps to provide confidence in its current and future prospects and profitability. This is important for Agnico Eagle as it believes that many of its new mines and recently acquired mining projects have long-term mining potential.
Highlights
| ● | Strong operational performance with payable production of 3,485,336 ounces of gold and production costs per ounce of gold of $885 during 2024. |
| ● | Total cash costs per ounce in 2024 of $903 on a by-product basis and $940 on a co-product basis. |
| ● | All-in sustaining costs(ii) in 2024 of $1,239 on a by-product basis and $1,276 on a co-product basis. |
| ● | Proven and probable gold mineral reserves totaled 54.3 million ounces at December 31, 2024, a 0.9% increase compared with 53.8 million ounces at December 31, 2023. |
| ● | As at December 31, 2024, Agnico Eagle had strong liquidity with $933.7 million in cash and cash equivalents and short-term investments along with approximately $2.0 billion in undrawn credit lines. |
| ● | During the year ended December 31, 2024, the Company repaid $700.0 million in debt. As at December 31, 2024, total debt was $1,143.0 million compared with total debt of $1,843.1 million as at December 31, 2023. |
| ● | The Company’s operations are located in mining-friendly regions that the Company believes have low political risk and long-term mining potential. |
| ● | The Company continues to maintain its investment grade credit rating and believes it has adequate financial flexibility to finance capital requirements at its mines and development projects from operating cash flow, cash and cash equivalents, short-term investments and undrawn credit lines. |
| ● | In February 2024, the Company replaced its $1.2 billion unsecured revolving bank credit facility (the “Old Credit Facility”) with a new $2.0 billion unsecured revolving bank credit facility, including an increased uncommitted accordion feature of $1.0 billion, and having a maturity date of February 12, 2029 (the “Credit Facility”). |
1
| ● | On January 23, 2025, the Company, indirectly through a wholly-owned subsidiary, took-up and acquired 110,424,431 common shares (“O3 Shares”) of O3 Mining Inc. (“O3 Mining”) under the Company’s take-over bid for O3 Mining (the “O3 Offer”) for aggregate consideration of C$184.4 million. The Company also extended the O3 Offer until February 3, 2025 to allow remaining shareholders of O3 Mining to tender to the O3 Offer. The O3 Shares taken up represented approximately 94.1% of the outstanding O3 Shares on an undiluted basis. On February 3, 2025, the Company, indirectly through a wholly-owned subsidiary, took-up and acquired an additional 4,360,806 O3 Shares during the extension period of the O3 Offer, resulting an aggregate of 114,784,237 O3 Shares being taken up and acquired under the O3 Offer, representing 96.5% of the outstanding O3 Shares on an undiluted basis, for aggregate consideration of C$193.7 million. The Company also announced that O3 Mining and one of the Company’s wholly-owned subsidiaries would amalgamate under the Business Corporations Act (Ontario) (the “OBCA”), which will result in the Company owning 100% of the O3 Shares. The amalgamation is expected to close in the first quarter of 2025. |
| ● | As at December 31, 2024 and January 31, 2025, the Company’s issued and outstanding common shares were 502,440,336 and 502,936,915, respectively. |
| ● | On February 13, 2025, the Company declared a quarterly cash dividend of $0.40 per common share. Agnico Eagle has declared a cash dividend every year since 1983. |
Notes:
| (i) | Total cash costs per ounce are non-GAAP measures that are not standardized financial measures under IFRS. For a reconciliation to production costs on both a by-product and co-product basis see “Non-GAAP Financial Performance Measures” below. Unless otherwise stated, in this MD&A, total cash costs per ounce is reported on a by-product basis. |
| (ii) | All-in sustaining costs per ounce is a non-GAAP measure that is not a standardized financial measure under IFRS. For a reconciliation to production costs on both a by-product and co-product basis and a discussion of the composition and usefulness of this non-GAAP measure see “Non-GAAP Financial Performance Measures”. Unless otherwise stated, in this MD&A, all-in sustaining cost per ounce is reported on a by-product basis. |
Agnico Eagle’s ability to consistently execute its business strategy has provided a solid foundation for growth.
The Company’s goals are to:
| ● | Deliver on performance and growth expectations: Ensure our existing portfolio delivers on expectations, lowers operational risk and generates free cash flow; |
| ● | Build and maintain a high-quality project pipeline: Ensure we develop a best-in-class project pipeline to replenish reserves and production, while maintaining the quality, manageability and fit of our future portfolio; |
| ● | Develop our people: Develop and provide growth opportunities for our people and provide the skills infrastructure to support the development of our operations and projects; |
| ● | Operate in a safe, socially and environmentally responsible manner: Create value for our shareholders while operating in a safe, socially and environmentally responsible manner, as we contribute to the prosperity of our people, their families and the communities in which we operate. |
The three pillars - performance, pipeline, people - form the basis of Agnico Eagle’s success and competitive advantage. By delivering on these pillars, the Company strives to continue to build its production base and generate increased value for shareholders, while operating in a safe, socially and environmentally responsible manner, as we contribute to the prosperity of our people, their families and the communities in which we operate.
2
Tariffs
On February 1, 2025, an executive order was signed by the President of the United States, which introduced tariffs on imports from countries including Canada. In response, the Canadian government announced retaliatory tariffs on imports from the United States. Subsequently, both countries postponed their previously announced tariffs for 30 days. The Company believes its revenue structure will be largely unaffected by the tariffs as its gold production is mostly refined in Canada, Australia or Europe. The Company is reviewing its exposure to the potential tariffs and alternatives to inputs sourced from suppliers that may be subject to the tariffs, if implemented. However, approximately 60% of the Company’s cost structure relates to labour, contractors, energy and royalties, which are not expected to be directly affected by any of the tariffs. While there is uncertainty as to whether the tariffs or retaliatory tariffs will be implemented, the quantum of such tariffs, the goods on which they may be applied and the ultimate effect on the Company’s supply chains, the Company will continue to monitor developments and may take steps to limit the impact of any tariffs as may be appropriate in the circumstances.
Acquisition of O3 Mining Inc.
On December 12, 2024, the Company announced that it had entered into a definitive support agreement with O3 Mining, pursuant to which the Company agreed to offer to acquire, directly or indirectly, all of the outstanding common shares of O3 Mining at C$1.67 per share in cash by way of the O3 Offer. The O3 Offer was valued at approximately C$204.0 million on a fully diluted in-the-money basis.
On January 23, 2025, the Company, indirectly through a wholly-owned subsidiary, took-up and acquired 110,424,431 common shares of O3 Mining under the O3 Offer for aggregate consideration of C$184.4 million. The Company also extended the O3 Offer until February 3, 2025 to allow remaining shareholders of O3 Mining to tender to the O3 Offer. The O3 Shares taken up represented approximately 94.1% of the outstanding O3 Shares on an undiluted basis. On February 3, 2025, the Company, indirectly through a wholly-owned subsidiary, took up and acquired an additional 4,360,803 O3 Shares during the extension period of the O3 Offer, resulting an aggregate of 114,785,237 O3 Shares being taken up and acquired under the O3 Offer, representing approximately 96.5% of the outstanding O3 Shares on an undiluted basis, for aggregate consideration of C$193.5 million. The Company also announced that O3 Mining and one of the Company’s wholly-owned subsidiaries would amalgamate under the OBCA, which will result in the Company owning 100% of the O3 Shares. The amalgamation is expected to close in the first quarter of 2025.
O3 Mining’s primary asset is its 100%-owned Marban Alliance property located near Val d’Or, in the Abitibi region of Québec, and is adjacent to Canadian Malartic. The Marban Alliance property includes the Marban deposit, which is an advanced exploration project with potential to support an open pit mining operation similar to those at the Barnat open pit at Canadian Malartic.
Repayment of Long-term Debt
On July 24, 2024, Agnico Eagle repaid $100.0 million of its 2012 Series B senior 5.02% guaranteed senior unsecured notes on maturity.
During the year ended December 31, 2024, Agnico Eagle fully repaid its $600.0 million unsecured term credit facility (the “Term Loan Facility”).
Reconciliation Action Plan and 2023 Climate Action Report
On July 10, 2024, the Company released its first Reconciliation Action Plan, reinforcing its commitment to reconciliation with Indigenous Peoples and communities. On July 31, 2024, the Company released its 2023 Climate Action Report. In line with the recommendations of the Task Force on Climate-related Financial Disclosures and Towards Sustainable Mining Climate Change protocol, the 2023 Climate Action Report outlines how the Company is addressing climate change risks and opportunities.
3
Additional Investments at Detour Lake Underground and Upper Beaver
The Company has approved expenditures of $200.0 million and $100.0 million at its Upper Beaver and Detour Lake underground projects, respectively, to further study the projects over approximately three years. At Detour Lake, a 2.0-kilometre exploration ramp will be developed to collect a bulk sample and to facilitate infill and expansion drilling of the current underground mineral resource. At Upper Beaver, an exploration ramp and an exploration shaft will be developed at depth to establish underground drilling platforms and collect bulk samples.
Canada - LaRonde
The 100% owned LaRonde, located in northwestern Quebec includes the LaRonde mine and the LZ5 mine. The LaRonde mine is the Company’s oldest operating mine and achieved commercial production in 1988. In 2003, the Company acquired LZ5, which lies adjacent to and west of the LaRonde mine and was an open pit operation under a previous owner. The LZ5 mine achieved commercial production in June 2018 as an underground operation with ore processed at LaRonde’s processing facilities.
Ore is processed at the LaRonde mill, which includes copper and zinc flotation circuits as well as precious metals recovery and refining facilities. The mill produces doré bars containing gold and silver, as well as zinc and copper concentrates with additional gold and silver. The plant has a daily capacity of 7,000 tonnes of ore and has been expanded four times since it opened in 1988. In addition, a dedicated 2,000-tonnes per day carbon-in-leach (“CIL”) processing facility has the capacity to treat ore and refine concentrates into doré bars.
LaRonde mine
The LaRonde mine extension, the portion of the mine below level 245, achieved commercial production in December 2011, and under current mine plans is expected to be in production through 2034. Access to LaRonde’s underground mining operation is through the 2,250-metre-deep Penna Shaft, which was completed in 2000. An internal winze is used to hoist materials from depth to facilities on level 215, approximately 2,150 metres below surface.
The LaRonde mine has gradually been implementing automation for its production activities and is increasingly relying on automated technology.
The risk of more frequent and larger seismic events has increased as the Company mines deeper at the LaRonde mine. The Company continues to adjust its mining methods, ground support and protocols to address seismic activity in the deeper portions of the mine, refer to the operations outlook section below for additional details.
LaRonde’s proven and probable mineral reserves were approximately 2.1 million ounces at December 31, 2024.
LZ5
In 2003, the Company acquired the Bousquet property, which adjoins the LaRonde mine to the west and hosts the Bousquet Zone 5 deposit. Commercial production at LZ5 was achieved in June 2018 and, under current mine plans, is expected to be in production through 2034. LZ5 is mined from underground ramp access.
LZ5 has gradually been implementing automation for its production activities and is increasingly relying on automated technology.
LZ5 proven and probable mineral reserves were approximately 0.7 million ounces at December 31, 2024.
Canada - Canadian Malartic
Canadian Malartic is 100% owned and is located within the town of Malartic, Quebec, approximately 25 kilometres west of the City of Val-d’Or and 80 kilometres east of City of Rouyn-Noranda. In 2014, Agnico Eagle acquired 50% of Canadian Malartic, which was held jointly with Yamana through the Canadian Malartic General Partnership. On March 31, 2023, following the completion of the Yamana Transaction, Agnico Eagle now owns 100% of Canadian Malartic.
4
Canadian Malartic is comprised of the open-pit Canadian Malartic mine and the underground Odyssey mine and a processing plant and related facilities. Under current mine plans, the Company expects Canadian Malartic will be in production through 2042.
Canadian Malartic has historically been a large open-pit operation using large-scale excavators and trucks. The Canadian Malartic pit was depleted in 2023 and open pit operations continue at the Barnat pit. Mining at the Odyssey project is done using underground methods. The mine design at the Odyssey project includes a 1,800 metre deep production-services shaft with an expected capacity of approximately 20,000 tonnes of ore per day once commissioned. During the second quarter of 2023, production using the ramp at the Odyssey South deposit commenced.
Ore is processed at the Canadian Malartic mineral processing complex, which has a 60,000 tonnes per day nominal throughput capacity.
Canadian Malartic’s proven and probable mineral reserves at December 31, 2024 were approximately 7.5 million ounces, including 5.2 million ounces at the East Gouldie deposit.
Canada - Goldex
Goldex is 100% owned by the Company and consists of the mining and processing facilities at the Goldex mine and the open pit operations at the Akasaba West mine.The Goldex mine is located in the city of Val d’Or in northwestern Quebec, approximately 60 kilometres and 25 kilometres east of LaRonde and Canadian Malartic, respectively, and achieved commercial production from the M and E satellite zones in October 2013. The Deep 1 Zone achieved commercial production in July 2017. Production from the Deep 1 Zone is expected to extend Goldex’s mine life through 2032 under current mine plans.
Ore from the Goldex mine is treated using a two-stage crushing process, followed by a two-stage grinding circuit that consists of a semi-autogenous grinding mill and a ball mill.
During the second quarter of 2022, the Company approved the development of the Akasaba West mine. Akasaba West is located approximately 30 kilometres from the Goldex mine and in 2024 contributed approximately 1,500 tonnes of ore per day to throughput at the mill. Shipment of ore for processing commenced during the fourth quarter of 2023. Ore from Akasaba West is processed at the Goldex mill.
Goldex’s proven and probable mineral reserves were approximately 0.9 million ounces at December 31, 2024, approximately 0.1 million ounces at Akasaba West.
Canada - Meliadine
In 2010, Agnico Eagle acquired its 100% interest Meliadine through its acquisition of Comaplex Minerals Corp. Meliadine is located near the western shore of Hudson Bay in the Kivalliq region of Nunavut, approximately 25 kilometres north of the hamlet of Rankin Inlet and 290 kilometres southeast of Meadowbank.
Commercial production was achieved at Meliadine in May 2019. In 2020, the Company’s Board of Directors (‘‘Board’’) approved the Phase 2 expansion at Meliadine which accelerated the development of the Tiriganiaq open pit, where commercial production was achieved in 2021. Under current mine plans, the Meliadine mine is expected to be in production through 2032.
Over the course of its planned operations, mining at Meliadine will be carried out through thirteen open pits and two underground mining operations. Underground access is by decline, with long-hole mining methods. The mill employs a conventional gold circuit comprising crushing, grinding, gravity separation and cyanide leaching with a carbon-in-leach circuit, followed by cyanide destruction and filtration of the tailings for dry stacking. In 2024, milling rates averaged 5,372 tonnes per day. The Phase 2 mill expansion project was commissioned during the fourth quarter of 2024 and increased the throughput to 6,500 tonnes per day after commissioning.
Meliadine’s proven and probable mineral reserves were approximately 3.4 million ounces at December 31, 2024.
Canada - Meadowbank
In 2007, the Company acquired Cumberland Resources Ltd., which held a 100% interest in Meadowbank. Commercial production was achieved at Meadowbank in March 2010. Mining operations at the Meadowbank minesite ceased in 2019 but the Meadowbank mill and other infrastructure remain active in support of operations at the Amaruq mine.
5
The 100% owned Amaruq mine is located approximately 50 kilometres northwest of Meadowbank and was approved for development in 2016. A 64-kilometre road from the Meadowbank minesite to Amaruq was completed in August 2017 and widened for ore haulage in November 2018. Ore from Amaruq is hauled to the Meadowbank mill using long haul off-road type trucks. Commercial production was achieved at Amaruq open pit in September 2019 and at Amaruq underground in August 2022. Under current mine plans, Amaruq is expected to be in production through 2028.
The Amaruq mine uses the existing infrastructure at Meadowbank, including the mill, tailings facilities, camp and airstrip. The process design at the Meadowbank mill consists of two-stage crushing, grinding, gravity concentration, cyanide leaching and gold recovery in a carbon-in-pulp circuit with a current capacity of 9,840 tonnes processed per day.
Meadowbank’s proven and probable mineral reserves were approximately 1.6 million ounces at December 31, 2024.
Canada - Hope Bay
On February 2, 2021, Agnico Eagle completed the acquisition of TMAC Resources Inc. (“TMAC”) comprising a 100% interest in Hope Bay, which is located in the Kitikmeot region of Nunavut. The 80-kilometre long Hope Bay greenstone belt hosts three gold deposits (Doris, Madrid and Boston), with historical mineral reserves and mineral resources and over 90 regional exploration targets.
The Company suspended mining activities at the Hope Bay project in February 2022 and since that time the Company’s primary focus on the project is to accelerate exploration activities and the evaluation of larger production scenarios.
Hope Bay’s proven and probable mineral reserves were approximately 3.4 million ounces at December 31, 2024.
Finland - Kittila
The 100% owned Kittila mine in northern Finland was acquired by the Company through the acquisition of Riddarhyttan Resources AB in 2005. Kittila is located in the Lapland region of northern Finland, approximately 900 kilometres north of Helsinki and 150 kilometres north of the Arctic Circle. Construction at Kittila was completed in 2008 and commercial production was achieved in May 2009. Under current mine plans, Kittila is expected to be in production through 2036.
Ore is treated by grinding, flotation, pressure oxidation, and carbon-in-leach circuits. Ore is processed in a surface processing plant with a current capacity of 6,000 tonnes per day.
In 2020, Agnico Eagle Finland Oy (“Agnico Finland”) was granted environmental and water permits necessary to enlarge the CIL2 tailings storage facility, expand the operations to a size that would permit a mining rate of 2.0 million tonnes per annum (“mtpa”) and build a new discharge waterline. These permits were subsequently appealed by third party non-governmental organizations to various levels of superior courts but, in October 2023, were ultimately found upheld by the Supreme Administrative Court of Finland (“SAC”). Prior to the SAC’s final decision, the Company had reduced its production levels to comply with the mining volume requirements, operating under the previous mining permit at a 1.6 mtpa rate though maintaining operational flexibility to reach the 2.0 mtpa rate if permitted. The mining rate for the full year of 2023 was 2.0 mtpa.
Proven and probable mineral reserves at Kittila were approximately 3.4 million ounces at December 31, 2024.
Canada - Detour Lake
Detour Lake is located in northeastern Ontario, approximately 300 kilometres northeast of Timmins and 185 kilometres by road northeast of Cochrane, within the northernmost portion of the Abitibi Greenstone Belt. The Company acquired its 100% interest in Detour Lake on February 8, 2022 as a result of the merger of equals (the “Merger”) by way of plan of arrangement with Kirkland Lake Gold Ltd., and, under current mine plans, it is expected to be in production through 2052.
Conventional truck-shovel open pit mining methods are used to mine the Detour Lake deposit, using large scale equipment. The milling operation uses a conventional crushing, grinding, gravity, cyanidation and carbon-in-pulp processing facility currently operating at approximately 24 million tonnes per year, with the Company achieving an annualized rate of 28 million tonnes per year late in the second half of 2024.
6
The West Detour project is a proposed expansion of Detour Lake. The project is intended to provide additional ore to feed the existing Detour Lake processing plant by developing two satellite open pits and the additional westward expansion of the currently operating open pit.
In 2024, the Company approved expenditure of $100.0 million at its Detour Lake Underground project to further study the project over approximately three years. A 2.0-kilometre exploration ramp will be developed at depth to collect a bulk sample and to facilitate infill and expansion drilling of the current underground mineral resource.
Detour Lake’s proven and probable mineral reserves were approximately 19.1 million ounces at December 31, 2024.
Canada - Macassa
The 100% owned Macassa mine, located in the historic gold mining region of Kirkland Lake, Ontario, was acquired as a result of the Merger. Production at Macassa first commenced in 1933, with the mine being operated continuously until 1999, when operations were suspended due to low gold prices. Production resumed in 2002 and in 2005, the South Mine Complex (“SMC”) was discovered. The SMC is a high-grade zone that resulted in significant grade improvement at the mine and an increase in production levels above historic averages. Macassa was among the first mines globally to introduce battery-electric vehicles. Under current mine plans, Macassa is expected to be in production through 2031.
Macassa is primarily mined from underground shaft access. In 2023, as part of the optimization efforts, the Company incorporated the sourcing of additional production from near surface deposits at Macassa and the neighbouring Amalgamated Kirkland deposits to its production profile and guidance. Both of these areas are accessible from a shallow ramp at Macassa.
Since the completion of #4 Shaft and the new ventilation infrastructure in 2023, the operational constraint at Macassa has shifted from the mine to the mill – with a continued focus on asset optimization, the Company is working on improving the ore grind size and load in the grinding circuit to further improve mill throughput.
Ore is processed on-site at the Macassa mill which has capacity to process 1,650 tonnes of ore per day.
Macassa’s proven and probable mineral reserves were approximately 2.1 million ounces at December 31, 2024.
Canada - Kirkland Lake
The Company acquired 50% of the Kirkland Lake project in 2014 as part of its initial acquisition of Canadian Malartic and, in 2018, acquired the remaining 50% that it did not already own, resulting in Agnico Eagle’s 100% ownership of the project.
The Kirkland Lake project is comprised of the Upper Canada and Upper Beaver properties. The Upper Beaver deposit is located approximately 27 kilometres from Macassa. The Upper Canada deposit lies approximately 6 kilometres southwest of the Upper Beaver property, and 1.6 kilometres north of the main Larder Lake-Cadillac Deformation Zone, within a 300 to 400-metre-wide strongly altered deformation corridor. The properties lie within the southern Abitibi Greenstone Belt of the Superior Province of the Canadian Shield, approximately 110 kilometres west of Agnico Eagle’s LaRonde mine.
In 2024, the Company approved expenditures of $200.0 million at its Upper Beaver project to further study the project over approximately three years. An exploration ramp and an exploration shaft are expected to be developed to a depth of 250 metres and 760 metres, respectively, to establish underground drilling platforms and collect bulk samples.
The Upper Beaver deposit’s proven and probable mineral reserves were approximately 2.8 million ounces at December 31, 2024. No proven and probable mineral reserves have been declared at the Upper Canada project.
Canada - Hammond Reef
The Company acquired 50% of Hammond Reef in 2014 as part of its initial acquisition of Canadian Malartic and, in 2018, acquired the remaining 50% that it did not already own, resulting in Agnico Eagle’s 100% ownership of Hammond Reef. The property covers approximately 32,070 hectares and is located in Northwestern Ontario approximately 260 kilometres west of Thunder Bay. The property is accessible via secondary gravel roads from the town of Atikokan, which is located approximately 30 kilometres to the southwest.
7
The Hammond Reef deposit is a high tonnage, low grade gold deposit that is primarily hosted in variably sheared and altered granitoid rocks. Gold mineralization is typically associated with fine grained pyrite mineralization that is often associated with fractures, veinlets and veins filled with various combinations of chlorite, calcite and quartz.
In January 2020, the Company purchased a 2% net smelter royalty (“NSR”) on the Hammond Reef project from Kinross Gold Corporation for $12.0 million. The property remains subject to a 2% NSR held by Osisko Royalties.
The Hammond Reef deposit’s proven and probable mineral reserves were approximately 3.3 million ounces at December 31, 2024.
Canada - Wasamac
The Wasamac project was acquired in March 2023 as part of the Yamana Transaction.
The Wasamac property is comprised of six mining concessions, covering approximately 10,547 hectares. The property is adjacent to the Trans-Canada Highway and Ontario Northland rail line, and approximately 100 km west of Canadian Malartic. A secondary road leads directly to the Wasamac deposit from the Trans-Canada Highway.
Wasamac’s proven and probable mineral reserves were approximately 1.4 million ounces at December 31, 2024. .
Australia - Fosterville
Fosterville is located approximately 20 kilometres northeast of the city of Bendigo and 130 kilometres north of the city of Melbourne in Victoria, Australia. The Company acquired its 100% interest in Fosterville on February 8, 2022 as a result of the Merger and, under current mine plans, it is expected to be in production through 2036.
The mine is located in an area with well-developed infrastructure and is accessible by paved roads. Access to the underground workings is through two portals, located in the Ellesmere and Falcon open pits. Underground mining is conducted using a conventional fleet including jumbo trucks, production drills, loaders, trucks and ancillary equipment. Ore is processed at the Fosterville mill which has a capacity of 2,275 tonnes per day.
The Fosterville property includes approximately 1,400 sq. kilometres of land with numerous brownfield and greenfield exploration targets that are a key focus of the Company’s ongoing exploration efforts.
Fosterville’s proven and probable mineral reserves were approximately 1.6 million ounces at December 31, 2024.
Mexico - Pinos Altos
In 2006, the Company completed the acquisition of the Pinos Altos property in northern Mexico, which was then an advanced stage exploration property. Commercial production was achieved at Pinos Altos in November 2009 and, under current mine plans, the mine is expected to be in production through 2028. A shaft sinking project was completed in June 2016 at the Pinos Altos mine and, during 2018, the site transitioned into a predominantly underground mining operation.
In 2020, the Company started underground and open pit production at Sinter, located approximately 2 kilometres northwest of the Pinos Altos minesite and depleted the Bravo pit at Creston Mascota in the third quarter of 2020, with residual gold leaching continuing through 2023.
At Reyna de Plata, open pit pre-stripping activities at Pit 1 were completed in the fourth quarter of 2022, operations were ceased in the fourth quarter of 2024, now focus has shifted to underground operations at the Cubiro and Sinter underground deposits. Initial production at Cubiro commenced in the fourth quarter of 2024.
Ore from Pinos Altos is treated by one of two processes: conventional processing in a mill for higher-grade ore; and heap-leaching for lower grade ore. The conventional, 5,500 tonnes per day processing plant includes circuits for crushing, grinding, gravity concentration and agitated leaching followed by counter-current decantation.
Pinos Altos’s proven and probable mineral reserves were approximately 0.4 million ounces at December 31, 2024.
8
Mexico - La India
Agnico Eagle acquired 100% of La India project, which is located approximately 70 kilometres northwest of the Pinos Altos mine and approximately 200 kilometres east of Hermosillo in Sonora, northern Mexico in January 2012. Commercial production was achieved in February 2014. Mining operation ceased during the fourth quarter of 2023 and processing activities of ore currently stacked on the heap leach pads continued through 2024. During 2025, the focus will be on transitioning the site to start rehabilitation activities in accordance with the plan.
Mexico - San Nicolás
The San Nicolás copper-zinc project is located in Zacatecas State in central Mexico. The property encompasses 8,888 hectares of mineral claims, approximately 60 km southeast of the city of Zacatecas at an elevation of 2,150 metres above sea level.
Agnico Eagle is earning into a 50% interest in the project in April 2023 from Teck Resources Limited and the two companies have formed a joint venture partnership to advance permitting and development of San Nicolás.
In addition, various surface rights and water rights in the immediate project area are held by the San Nicolás project. A fully permitted drill core storage, field office and camp facility have been maintained at the San Nicolas project site since 2001.
San Nicolás’ proven and probable mineral reserves were approximately 0.7 million ounces at December 31, 2024.
The key drivers of financial performance for Agnico Eagle for the year-ended December 31, 2024 include:
| ● | the spot price of gold and silver; |
| ● | production volumes; |
| ● | production costs; and |
| ● | US dollar/Canadian dollar, US dollar/Australian dollar, US dollar/Euro and US dollar/Mexican peso exchange rates. |
Details on future drivers of financial performance are discussed in the Outlook section of this MD&A.
GOLD ($ per ounce)
|
| 2024 |
| 2023 |
| % Change |
| ||
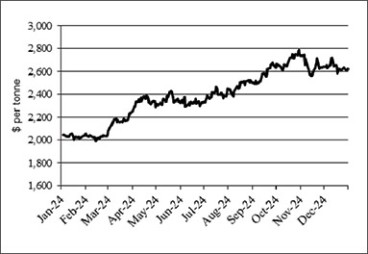
High price | | $ | 2,778 | | $ | 2,078 | | 33.7 | % |
Low price | | $ | 1,985 | | $ | 1,811 | | 9.6 | % |
Average market price | | $ | 2,386 | | $ | 1,941 | | 22.9 | % |
Average realized price | | $ | 2,384 | | $ | 1,946 | | 22.5 | % |
9
In 2024, the average market price per ounce of gold was 22.9% higher than in 2023. The Company’s average realized price per ounce of gold in 2024 was 22.5% higher than in 2023.
SILVER ($ per ounce)
|
| 2024 |
| 2023 |
| % Change |
| ||
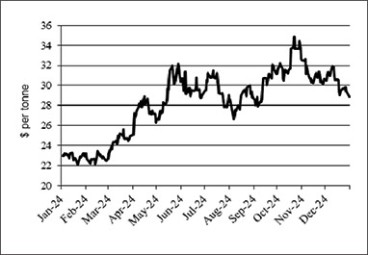
High price | | $ | 34.51 | | $ | 26.07 |
| 32.4 | % |
Low price | | $ | 22.09 | | $ | 20.09 |
| 10.0 | % |
Average market price | | $ | 28.27 | | $ | 23.35 |
| 21.1 | % |
Average realized price | | $ | 28.85 | | $ | 23.72 |
| 21.6 | % |
In 2024, the average market price per ounce of silver was 21.1% higher than in 2023. The Company’s average realized price per ounce of silver in 2024 was 21.6% higher than in 2023.
By-product metals are mainly produced at LaRonde (silver, zinc and copper) and Pinos Altos (silver). Net by-product (primarily silver, zinc and copper) revenue is treated as a reduction of production costs in calculating total cash costs per ounce of gold produced on a by-product basis and all-in sustaining costs per ounce of gold produced on a by-product basis.
Changes in production volumes have a direct impact on the Company’s financial results. Payable production of gold was 3,485,336 ounces in 2024, an increase of 1.3% compared with 3,439,654 ounces in 2023. The increase is attributed to higher throughput, partially offset by lower grades and recovery in the current year when compared to prior year. Increased production in 2024 is mainly due to additional gold being produced at Meadowbank and Macassa and the contribution of production from Canadian Malartic following the Yamana Transaction, which closed on March 30, 2023. Partially offsetting the overall increase in gold production was a decrease in gold production at Fosterville and La India.
Production costs are discussed in detail in the Results of Operations section below.
Foreign Exchange Rates (Ratio to US$)
The exchange rate of the Canadian dollar, Australian dollar, Euro and Mexican peso relative to the US dollar is an important financial driver for the Company for the following reasons:
| ● | all revenues are earned in US dollars; |
| ● | a significant portion of operating costs at LaRonde, Canadian Malartic, Goldex, Meliadine, Meadowbank, Detour Lake and Macassa are incurred in Canadian dollars; |
| ● | a significant portion of operating costs at Fosterville are incurred in Australian dollars; |
| ● | a significant portion of operating costs at the Kittila mine are incurred in Euros, and |
| ● | a significant portion of operating costs at the Pinos Altos and La India are incurred in Mexican pesos. |
10
The Company mitigates part of its foreign currency exposure by using currency hedging strategies.
On average, the Canadian dollar, Australian dollar, Euros and Mexican Pesos weakened relative to the US dollar in 2024 compared with 2023, decreasing costs denominated in the local currency when translated into US dollars for reporting purposes.
Agnico Eagle reported net income of $1,895.6 million, or $3.79 per share, in 2024 compared with net income of $1,941.3 million, or $3.97 per share in 2023 and net income of $670.2 million, or $1.53 per share in 2022. Agnico Eagle reported adjusted net income(i) of $2,117.8 million, or $4.24 per share(i), in 2024 compared with adjusted net income of $1,095.9 million, or $2.24 per share, in 2023 and adjusted net income of $1,003.6 million , or $2.29 per share in 2022.
EBITDA(i) totaled $4,462.4 million in the year ended December 31, 2024 compared with $3,980.9 million in 2023 and $2,293.0 million in 2022. Adjusted EBITDA(i) totaled $4,693.7 million in the year ended December 31, 2024 compared with $3,236.5 million in 2023 and $2,706.1 million in 2022. In 2024, operating margin(i) increased to $5,199.7 million from $3,693.6 million in 2023. In 2022, operating margin was $3,097.8 million.
Agnico Eagle reported free cash flow(i) of $2,142.9 million in 2024, compared with free cash flow of $947.4 million in 2023 and $558.4 million in 2022. Free cash flow before changes in non-cash components of working capital(i) totaled $2,062.9 million in 2024 compared with $1,093.8 million in 2023 and $577.6 million in 2022.
Revenues from Mining Operations
Revenues from mining operations, net of selling costs, increased by $1,658.8 million, or 25.0%, to $8,285.8 million in 2024 from $6,626.9 million in 2023 primarily due to a 22.5% increase in realized prices and a 2.1% increase in the sales volume of gold. The increased contribution of gold sales volume from Macassa, the additional 50% of Canadian Malartic, following the Yamana Transaction, and Meadowbank was partially offset by lower sales volume from Fosterville and La India. Revenues from mining operations were $5,741.2 million in 2022.
Sales of precious metals (gold and silver) accounted for 99.5% of revenues from mining operations in 2024, similar to the 99.6% in 2023 and 99.5% in 2022.
11
The table below sets out revenues from mining operations, payable production volumes and sales volumes by metal:
|
| 2024 |
| 2023 |
| 2022 | |||
Revenues from mining operations: | | (thousands of United States dollars) | |||||||
Gold | | $ | 8,174,102 | | $ | 6,540,077 | | $ | 5,656,201 |
Silver | |
| 79,270 | |
| 63,544 | |
| 55,212 |
Zinc | |
| 4,008 | |
| 4,736 | |
| 9,390 |
Copper | |
| 28,373 | |
| 18,552 | |
| 20,359 |
Total revenues from mining operations | | $ | 8,285,753 | | $ | 6,626,909 | | $ | 5,741,162 |
Payable production: | |
| | |
| | |
| |
Gold (ounces) | |
| 3,485,336 | |
| 3,439,654 | |
| 3,135,007 |
Silver (thousands of ounces) | |
| 2,485 | |
| 2,408 | |
| 2.292 |
Zinc (tonnes) | |
| 6,339 | |
| 7,702 | |
| 8,195 |
Copper (tonnes) | |
| 3,951 | |
| 2,617 | |
| 2,901 |
Payable metal sold(ii): | |
| | |
| | |
| |
Gold (ounces) | |
| 3,434,094 | |
| 3,364,132 | |
| 3,148,593 |
Silver (thousands of ounces) | |
| 2,483 | |
| 2,354 | |
| 2.354 |
Zinc (tonnes) | |
| 6,209 | |
| 8,526 | |
| 6,727 |
Copper (tonnes) | |
| 3,952 | |
| 2,630 | |
| 2,916 |
Notes:
| (i) | Adjusted net income, adjusted net income per share, EBITDA, adjusted EBITDA, free cash flow, free cash flow before changes in non-cash components of working capital and operating margin are non-GAAP measures or ratios that are not standardized financial measures or ratios under IFRS. For a reconciliation to net income, net income per share and cash provided by operating activities and discussion of the composition and usefulness of these non-GAAP measures or ratios see “Non-GAAP Financial Performance Measures”. |
| (ii) | Canadian Malartic’s payable metal sold excludes the 5.0% in-kind net smelter return royalty held by Osisko Gold Royalties Ltd. Detour Lake’s payable metal sold excludes the 2% in-kind net smelter royalty held by Franco-Nevada Corporation. Macassa’s payable metal sold excludes the 1.5% in-kind net smelter royalty held by Franco-Nevada Corporation. |
Revenues from gold, net of selling costs, increased by $1,634.0 million or 25.0% in 2024 compared with 2023 primarily due to higher gold prices and an increase in the sales volume of gold which was the result of increased contribution of gold sales volume from Macassa, the additional 50% of Canadian Malartic, following the Yamana Transaction, and Meadowbank,being partially offset by lower sales volume from Fosterville and La India. The Company’s average realized price of gold increased by 22.5% to $2,384 in 2024 compared to $1,946 in 2023, and the sales volume of gold increased by 2.1% to 3,434,094 ounces in 2024 compared to 3,364,132 ounces in 2023.
Revenues from silver, net of selling costs, increased by $15.7 million or 24.8% in 2024 compared with 2023 primarily due to a 21.6% increase in the average realized price of silver between periods.
Production costs increased to $3,086.1 million in 2024 compared with $2,933.3 million in 2023 with the increase due to the contribution from the additional 50% of Canadian Malartic, following the Yamana Transaction, and higher production costs mainly at Macassa and Detour Lake, partially offset by lower production costs at Meadowbank and La India. Production costs were $2,643.3 million in 2022 which included fair value adjustments to inventory at Detour Lake and Fosterville.
Production costs increased in 2024 when compared to the prior-year period primarily due to higher royalties arising from higher gold prices combined with increased contractor and labour costs related to underground mining operations, partially offset by the benefit of the weaker Canadian dollar during the period. For a more detailed discussion of production costs and cost metrics by mine see Minesite Discussion section below.
12
The table below sets out production costs by mine:
|
| 2024 |
| 2023 |
| 2022 | |||
|
| (thousands of United States dollars) | |||||||
LaRonde mine | | $ | 239,309 | | $ | 218,020 | | $ | 213,393 |
LZ5 | |
| 80,186 | |
| 81,624 | |
| 72,096 |
LaRonde | |
| 319,495 | |
| 299,644 | |
| 285,489 |
Canadian Malartic(i) | |
| 532,037 | |
| 465,814 | |
| 235,735 |
Goldex | |
| 129,977 | |
| 112,022 | |
| 103,830 |
Meliadine | | | 350,280 | | | 343,650 | | | 318,141 |
Meadowbank | |
| 463,464 | |
| 524,008 | |
| 442,681 |
Kittila | |
| 227,334 | |
| 205,857 | |
| 210,661 |
Detour Lake(ii) | |
| 497,079 | |
| 453,498 | |
| 489,703 |
Macassa(ii) | |
| 201,371 | |
| 155,046 | |
| 129,774 |
Fosterville(ii) | |
| 147,045 | |
| 131,298 | |
| 204,649 |
Pinos Altos | |
| 168,231 | |
| 145,936 | |
| 144,489 |
Creston Mascota | |
| — | |
| — | |
| 1,943 |
La India | | | 49,767 | | | 96,490 | | | 76,226 |
Total production costs | | $ | 3,086,080 | | $ | 2,933,263 | | $ | 2,643,321 |
Notes:
| (i) | The information set out in this table reflects the Company’s 50% interest in Canadian Malartic up to and including the closing of the Yamana transaction on March 30, 2023 and 100% interest thereafter. |
| (ii) | The information set out in this table reflects the Company’s acquisition of the Detour Lake, Macassa and Fosterville in the Merger, following its closing on February 8, 2022. |
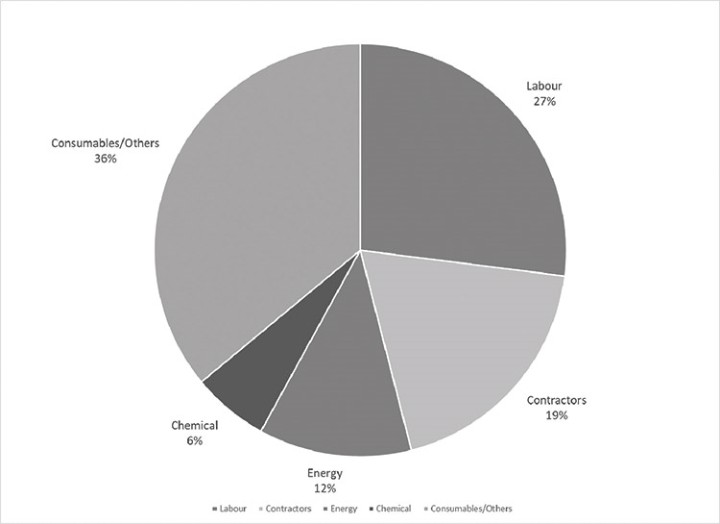
The table below sets out the major components of production costs:
Total Production Costs by Category 2024
13
Exploration and Corporate Development Expense
Exploration and corporate development expense increased by 1.8% to $219.6 million in 2024 from $215.8 million in 2023. Exploration and corporate development expense was $271.1 million in 2022.
A summary of the Company’s significant 2024 exploration and corporate development activities is set out below:
| ● | Exploration expenses at various mine sites decreased by 30.9% to $39.0 million in 2024 compared with $56.5 million in 2023 primarily due to lower expensed exploration at Hope Bay and Meadowbank, partially offset by higher expensed exploration at Fosterville. |
| ● | Exploration expenses in Canada increased by 26.4% to $100.5 million in 2024 compared with $79.5 million in 2023 primarily due to higher expensed exploration drilling at regional targets at Hope Bay and Canadian Malartic. |
| ● | Increased exploration expenses in regional targets located in Europe, Australia and in the United States were offset by decreased exploration expenses in Latin America. |
| ● | Corporate development and project evaluation expenses increased by 1.8% to $54.0 million in 2024 compared with $53.0 million in 2023 primarily due to increased project evaluation expenses at projects in Canada. |
The table below sets out exploration expense by region and total corporate development expense:
|
| 2024 |
| 2023 |
| 2022 | |||
| | (thousands of United States dollars) | |||||||
Minesites | | $ | 39,003 | | $ | 56,475 | | $ | 63,066 |
Canada | |
| 100,484 | |
| 79,509 | |
| 107,305 |
Latin America | |
| 10,221 | |
| 13,585 | |
| 24,147 |
United States | |
| 4,670 | |
| 4,177 | |
| 5,807 |
Europe | |
| 6,167 | |
| 4,986 | |
| 9,939 |
Australia | | | 5,088 | | | 4,033 | | | 4,212 |
Corporate development and project evaluation expenses | |
| 53,977 | |
| 53,016 | |
| 56,641 |
Total exploration and corporate development expense | | $ | 219,610 | | $ | 215,781 | | $ | 271,117 |
Amortization of Property, Plant and Mine Development
Amortization of property, plant and mine development expense increased to $1,514.1 million in 2024 compared with $1,491.8 million in 2023 and $1,094.7 million in 2022. The increase in amortization of property, plant and mine development between 2024 and 2023 was primarily due to higher amortization at Detour Lake, Meliadine and LaRonde partially offset by decreases at Meadowbank, La India and Pinos Altos.
General and Administrative Expense
General and administrative expenses were $207.5 million in 2024 essentially unchanged from expenses of $208.5 million in 2023. General and administrative expenses were $220.9 million in 2022.
Finance costs were $126.7 million in 2024 compared with $130.1 million in 2023 and $82.9 million in 2022. The decrease between 2024 and 2023 was primarily due to a decrease in interest expense under the Old Credit Facility and Credit Facility (the “Credit Facilities”) following reduced drawdowns in 2024 and a decrease in interest expense on the Company’s guaranteed senior unsecured notes (the “Notes”) as the $100.0 million owing under the 2012 Series B Notes was repaid in July 2024, partially offset by an increase in interest expense on the Term Loan Facility.
14
The table below sets out the components of finance costs:
|
| 2024 |
| 2023 |
| 2022 | |||
Interest on Notes | | $ | 53,229 | | $ | 57,192 | | $ | 64,481 |
Interest on Term Loan Facility | | | 32,712 | | | 26,273 | | | — |
Interest on Credit Facilities | | | 3,350 | | | 10,928 | | | 536 |
Credit Facilities fees | |
| 6,167 | |
| 6,374 | |
| 3,859 |
Amortization of credit and term loan facilities financing and note issuance costs | |
| 3,845 | |
| 3,290 | |
| 3,042 |
Accretion expense on reclamation provisions | |
| 33,815 | |
| 32,906 | |
| 15,951 |
Interest on lease obligations and other interest expense (income) | |
| (3,566) | |
| (3,699) | |
| (1,290) |
Interest capitalized to assets under construction | |
| (2,814) | |
| (3,177) | |
| (3,644) |
Total finance costs | | $ | 126,738 | | $ | 130,087 | | $ | 82,935 |
See Note 14 in the consolidated financial statements for additional details on the Company’s Credit Facilities, the Term Loan Facility and Notes referenced above.
Derivative Financial Instruments
Loss on derivative financial instruments was $155.8 million in 2024 compared to a gain on derivative financial instruments of $68.4 million in 2023 and a loss of $90.7 million in 2022. The change between 2024 and 2023 was primarily due to unrealized losses on foreign exchange and fuel hedges of $142.4 million in 2024 compared to unrealized gains on foreign exchange and fuel hedges of $112.9 million in 2023. This was partially offset by unrealized gains of $20.4 million on warrants in 2024 compared to $11.2 million in unrealized losses on warrants in the prior year.
During the fourth quarter of 2024, the Company completed its goodwill impairment testing and its review of indicators of potential impairment of the Company’s cash generating units (“CGUs”). The Company did not identify any indicators of potential impairment and no impairment losses were recorded for the year ended December 31, 2024.
As at December 31, 2023, the Company identified indicators of potential impairment for the Company’s Pinos Altos mine. As a result of the identification of these indicators, the Company estimated the recoverable amount of this CGU and the recoverable amount was calculated to be less than the carrying amount. The Company recognized an impairment loss of $112.0 million ($73.4 million net of tax) against property, plant and mine development. The Company completed its goodwill impairment testing and the recoverable amount for the Macassa CGU was calculated to be less than the carrying amount. An impairment loss of $675.0 million ($594.0 million net of tax) was recognized against the Macassa CGU, of which $420.9 million was recognized against goodwill and $254.1 million ($173.1 million net of tax) was recognized against property, plant and mine development costs.
As at December 31, 2022, the Company identified indicators of potential impairment for the Company’s La India mine. As a result of the identification of these indicators, the Company estimated the recoverable amount of this CGU and concluded that the carrying amounts exceeded its recoverable amount. The Company recorded an impairment loss of $55.0 million ($52.7 million net of tax) at the La India mine.
Management’s estimates of recoverable amounts are subject to risk and uncertainties. Therefore, it is reasonably possible that changes could occur which may affect the recoverability of the Company’s long-lived assets and goodwill. This may have a material effect on the Company’s future financial results.
See Note 24 in the consolidated financial statements for further details on impairment losses.
Foreign Currency Translation Loss (Gain)
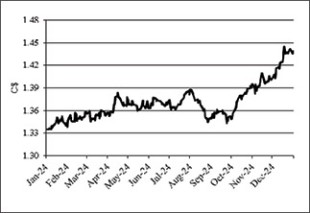
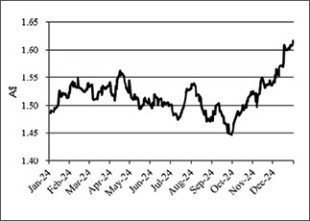
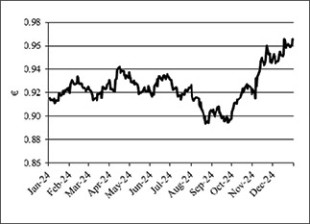
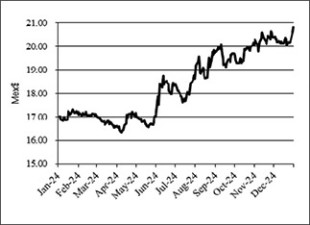
The Company’s operating results and cash flow are significantly affected by changes in the exchange rate between the US dollar and each of the Canadian dollar, Australian dollar, Euro and Mexican peso as all of the Company’s revenues are earned in US dollars while a significant portion of its operating and capital costs are incurred in such other currencies. During the period from January 1, 2024 through December 31, 2024, the daily US dollar closing exchange rate per US$1.00 fluctuated between C$1.33 and C$1.44 as reported
15
by the Bank of Canada, A$1.44 and A$1.61 as reported by the Reserve Bank of Australia, €0.89 and €0.96 as reported by the European Central Bank and 16.34 and 20.72 Mexican pesos as reported by the Central Bank of Mexico.
A foreign currency translation loss of $9.4 million was recorded in 2024 compared with a $0.3 million gain in 2023 and a $16.1 million gain in 2022. On average in 2024, the US dollar strengthened relative to the Canadian dollar, the Australian dollar and the Mexican peso. As at December 31, 2024, the US dollar strengthened relative to the Canadian dollar, the Australian dollar, the Euro and the Mexican peso as compared to December 31, 2023. The net foreign currency translation loss in 2024 was primarily due to the translation impact on the Company’s net monetary assets denominated in foreign currencies between periods.
Other expenses increased to $84.5 million in the year ended December 31, 2024 compared with $66.3 million in the year ended December 31, 2023, primarily due to increased disposals of property, plant and mine equipment. Other expenses amounted to $141.3 million in the year ended December 31, 2022, which included non-recurring severance and acquisition costs associated with the Merger in 2022.
Income and Mining Taxes Expense
In 2024, the Company recorded income and mining taxes expense of $926.0 million on income before income and mining taxes of $2,821.6 million at an effective tax rate of 32.8%. In 2023, the Company recorded income and mining taxes expense of $417.8 million on income before income and mining taxes of $2,359.1 million at an effective tax rate of 17.7%. The Company’s 2024 effective tax rate is higher than the applicable statutory tax rate of 26.0% due to the impact of mining taxes. The Company’s 2023 effective tax rate is lower than the applicable statutory tax rate of 26.0% due to the non-taxable accounting gain resulting from the Yamana Transaction. In 2022, the Company recorded income and mining taxes expense of $445.2 million on income before income and mining taxes of $1,115.4 million at an effective tax rate of 39.9%.
(thousands of United States dollars) |
| As at December 31, 2024 |
| As at December 31, 2023 |
| As at December 31, 2022 | |||
Current assets | | $ | 2,805,281 | | $ | 2,191,152 | | $ | 2,180,059 |
Non-current assets | |
| 27,181,737 | |
| 26,493,797 | |
| 21,314,749 |
Total assets | | $ | 29,987,018 | | $ | 28,684,949 | | $ | 23,494,808 |
Current liabilities | | $ | 1,511,965 | | $ | 1,048,026 | | $ | 946,422 |
Non-current liabilities | |
| 7,642,153 | |
| 8,214,008 | |
| 6,307,041 |
Total liabilities | | $ | 9,154,118 | | $ | 9,262,034 | | $ | 7,253,463 |
Total assets at December 31, 2024 of $30.0 billion increased by 4.5%, or $1.3 billion compared with total assets of $28.7 billion at December 31, 2023. The Company’s total assets are primarily comprised of non-current assets such as property, plant and mine development and goodwill.
Total liabilities at December 31, 2024 of $9.2 billion decreased by 1.2%, or $0.1 billion compared with total liabilities of $9.3 billion at December 31, 2023. The Company’s total liabilities are primarily comprised of non-current liabilities such as deferred income and mining tax liabilities, long-term debt and reclamation provisions.
The increase in total assets between December 31, 2024 and December 31, 2023 was primarily due to an increase in cash and cash equivalents and increases in current and non-current inventory balances. The decrease in total liabilities between December 31, 2024 and December 31, 2023 is primarily due to the repayment of the $600.0 million Term Loan Facility in 2024.
Both total assets and total liabilities at December 31, 2023 increased compared with total assets and total liabilities at December 31, 2022 primarily due to the assets acquired and liabilities assumed as part of the Yamana Transaction.
16
Liquidity and Capital Resources
As at December 31, 2024, the Company’s cash and cash equivalents totaled $926.4 million compared with $338.6 million as at December 31, 2023. The Company’s policy is to invest excess cash in what the Company believes to be highly liquid investments of high credit quality to attempt to reduce risks associated with these investments. Investments with remaining maturities of less than three months at the time of purchase are classified as cash equivalents. The Company’s decisions regarding the length of maturities it holds are based on cash flow requirements, rates of return and other factors.
Working capital (current assets less current liabilities) increased to $1,293.3 million as at December 31, 2024, compared with $1,143.1 million as at December 31, 2023, primarily due to a $587.8 million increase in cash and cash equivalents from a 22.5% increase in the realized gold price and a 2.1% increase in the sales volume of gold. The increase in cash and cash equivalents was partially offset by a $291.0 million increase in income tax payable and a $142.4 million increase in net derivative financial instrument liabilities.
Subject to various risks and uncertainties, including those set in this Annual MD&A and in the Company’s AIF, the Company believes it will generate sufficient cash flow from operations and has adequate cash and debt facilities available to finance its current operations, working capital requirements, contractual obligations, debt maturities, planned capital expenditure and exploration programs. While the Company believes its capital resources will be sufficient to satisfy all its mandatory and discretionary commitments, the Company may choose to decrease certain of its discretionary expenditure commitments, which include certain capital expenditures and exploration and corporate development expenses, should unexpected financial circumstances arise in the future. See “Risk Profile” in this MD&A for further details.
Cash provided by operating activities increased by $1,359.3 million to $3,960.9 million in 2024 compared with $2,601.6 million in 2023. The increase in cash provided by operating activities was primarily due to higher gold prices, a 2.1% increase in the sales volume of gold and favourable working capital movements. Cash provided by operating activities was $2,096.6 million in 2022.
Cash used in investing activities decreased to $2,007.1 million in 2024 compared to $2,760.8 million in 2023. The decrease in cash used in investing activities between periods was primarily due to $1,000.6 million in non-recurring net cash consideration paid by the Company in the Yamana Transaction in 2023, partially offset by a $163.8 million increase in additions to property, plant and mine development and a $78.3 million increase in purchases of equity securities and other investments between periods. Cash used in investing activities was $710.5 million in 2022, which included $1,538.2 million of additions to property, plant and mine development, partially offset by $838.7 million in non-recurring cash and cash equivalents acquired in the Merger.
In 2024, additions to property, plant and mine development totaled $1,817.9 million compared with $1,654.1 million in 2023. The $163.8 million increase in additions to property, plant and mine development between 2024 and 2023 was primarily due to increases at Detour Lake and Canadian Malartic.
In 2024, the Company purchased $183.0 million of equity securities and other investments compared with $104.7 million in 2023 and $47.4 million in 2022. The Company’s investments in equity securities consist primarily of investments in common shares of entities in the mining industry.
Cash used in financing activities increased to $1,356.3 million in 2024 compared to $164.0 million in 2023 primarily due to the $600.0 million repayment of the Term Loan Facility in 2024 originally drawn down in 2023. Cash used in financing activities was $914.9 million in 2022.
The Company issued common shares for net proceeds of $235.5 million in 2024 compared to $70.3 million in 2023, attributable to employee stock option plan exercises, issuances under the incentive share purchase plan and the dividend reinvestment plan. Net proceeds from the issuance of common shares were $62.1 million in 2022.
On May 1, 2024, the Company received approval from the TSX to renew its normal course issuer bid (“NCIB”), pursuant to which the Company may purchase up to $500.0 million of its common shares subject to a maximum of 5% of its issued and outstanding common
17
shares. Under the NCIB, the Company may purchase such common shares on the open market at its discretion, during the period starting on May 4, 2024 and ending on May 3, 2025. Purchases under the NCIB may be made through the facilities of the TSX, the New York Stock Exchange or other designated exchanges and alternative trading systems in Canada and the United States in accordance with applicable regulatory requirements. All common shares purchased under the NCIB will be cancelled.
During the year ended December 31, 2024, the Company repurchased 1,749,086 common shares for $119.9 million at an average price of $68.54 under the NCIB. During the year ended December 31, 2023, the Company repurchased 100,000 common shares for $4.8 million at an average price of $47.74 under the NCIB. During the year ended December 31, 2022, the Company repurchased 1,569,620 common shares for $69.9 million at an average price of $44.53 under the NCIB.
In 2024, the Company declared dividends of $1.60 per share and paid cash dividends totaling $671.7 million compared with dividends declared of $1.60 per share and cash dividends paid of $638.6 million in 2023. In 2022, the Company declared dividends of $1.60 per share and paid cash dividends totaling $608.3 million. Agnico Eagle has declared a cash dividend every year since 1983. Although the Company expects to continue paying dividends, future dividends will be at the discretion of the Board and will be subject to factors such as income, financial condition and capital requirements.
On February 12, 2024, the Company terminated its Old Credit Facility and entered into the Credit Facility. The Credit Facility matures and all indebtedness thereunder is due and payable on February 12, 2029. The Credit Facility is available in US dollars through Secured Overnight Financing Rate (“SOFR”) and base rate advances, or in Canadian dollars through Canadian Overnight Repo Rate Average (“CORRA”) and prime rate advances, priced at the applicable rate plus a margin that ranges from 0.00% to 2.00%. The Credit Facility also provides for the issuance of letters of credit, priced at the applicable rate plus a margin that varies from 0.60% to 2.00%. The lenders under the Credit Facility are each paid a standby fee at a rate that ranges from 0.09% to 0.25% of the undrawn portion of the Credit Facility. In each case, the applicable margin or standby fees vary depending on the Company’s credit rating. The Company’s payment and performance of its obligations under the Credit Facility are not guaranteed by any of its subsidiaries, however the Company must provide guarantees from certain of its subsidiaries (i) if any existing material indebtedness of the Company benefits from guarantees and the Company no longer maintains an investment grade credit rating, (ii) or if the Company incurs new material indebtedness for borrowed money, or refinances existing material indebtedness (including material alterations to the terms of such indebtedness, but excluding maturity date extensions), and provides guarantees of such new or refinanced indebtedness from any of its subsidiaries.
On April 20, 2023, the Company entered into a credit agreement with two financial institutions that provided the $600.0 million Term Loan Facility. The Company drew the full amount available when the Term Loan Facility on April 28, 2023. The Term Loan Facility matured and all indebtedness thereunder was to become due and payable on April 21, 2025. The Term Loan Facility was made available as a single advance in US dollars through SOFR and base rate advances, priced at the applicable rate plus a margin that ranges from 0.00% to 2.00%, depending on the Company’s credit rating. On February 12, 2024, the Term Loan Facility was amended to align with the Company’s Credit Facility. During the year ended December 31, 2024, the Company fully repaid the Term Loan Facility.
As at December 31, 2024, the Company’s outstanding balance under the Credit Facility was nil. Credit Facility availability is reduced by outstanding letters of credit which were $23.5 million as of December 31, 2024, resulting in $1,976.5 million available for future drawdown.
Effective September 20, 2022, the Company amended its credit agreement with a financial institution relating to an uncommitted letter of credit facility (as amended, the “First LC Facility”) to increase the amount available to C$400.0 million. The First LC Facility may be used to support the reclamation obligations or non-financial or performance obligations of the Company or its subsidiaries. As at December 31, 2024, the aggregate undrawn face amount of letters of credit under the First LC Facility is $276.9 million.
Effective September 16, 2021, the Company amended its uncommitted standby letter of credit facility (as amended, the “Second LC Facility”) to increase the amount available to C$200.0 million. Payment and performance of the Company’s obligations under the Second LC Facility are supported by an account performance security guarantee issued by Export Development Canada in favour of the lender. The Second LC Facility may be used by the Company to support the reclamation obligations of the Company, its subsidiaries or any entity in which the Company has a direct or indirect interest or the performance obligations (other than with respect to indebtedness for borrowed money) of the Company, its subsidiaries or any entity in which the Company has a direct or indirect interest that are not directly related to reclamation obligations. As at December 31, 2024, the aggregate undrawn face amount of letters of credit under the Second LC Facility is nil.
Effective May 25, 2023, the Company amended its uncommitted standby letter of credit facility with a financial institution (the “Third LC Facility”) to increase the amount available to C$200.0 million. Letters of credit issued under the Third LC Facility may be used to
18
support the reclamation obligations or non-financial or performance obligations of the Company or its subsidiaries; however the subsidiary guarantees were released in connection with the entry into the New Credit Facility. As at December 31, 2024, the aggregate undrawn face amount of letters of credit under the Third LC Facility was $114.8 million.
In October 2021, the Company entered into a $75.0 million uncommitted standby letter of credit facility (the “Fourth LC Facility”) with a financial institution. Letters of credit issued under the Fourth LC Facility may be used to support the reclamation obligations or non-financial or performance obligations of the Company or its subsidiaries. In October 2024, the Fourth LC Facility was amended to increase the amount available to $150.0 million. As at December 31, 2024, the aggregate undrawn face amount of letters of credit under the Fourth LC Facility was $65.0 million.
In January 2022, the Company entered into a C$100.0 million uncommitted standby letter of credit facility (the “Fifth LC Facility”) with a financial institution. Upon the acquisition of Kirkland in February 2022, the Company acquired a standby letter of credit facility with the same financial institution providing for an additional C$120.0 million uncommitted letter of credit facility for the Kirkland subsidiary. Effective September 2022, an amended and restated standby letter of facility combined these facilities and the amount available under the amended and restated facility was increased to C$320.0 million. Letters of credit issued under the Fifth LC Facility may be used to support the reclamation obligations or non-financial or performance obligations of the Company or its subsidiaries. As at December 31, 2024, the aggregate undrawn face amount of letters of credit under the Fifth LC Facility was $202.5 million.
The obligations of the Company under each of the LC Facilities other than then Second LC Facility were guaranteed by certain of its subsidiaries, however in connection with the Company’s entry into the Credit Facility on February 24, 2024, these subsidiary guarantees were released.
In February 2022, upon the acquisition of Kirkland, the Company acquired a standby letter of guarantee facility (the “Guarantee Facility”) with a financial institution providing for a $25.0 million uncommitted letter of guarantee facility. Guarantees issued under the Guarantee Facility may be used to support the reclamation obligations or non-financial or performance obligations of certain subsidiaries of the Company. The obligations of the Company under this Guarantee Facility were guaranteed by certain of its subsidiaries; however the subsidiary guarantees were released in connection with the entry into the Credit Facility. In October 2024, the Company entered into a $200.0 million uncommitted standby letter of credit facility (the “Sixth LC Facility” and, together with the First LC Facility, the Second LC Facility, the Third LC Facility, the Fourth LC Facility and the Fifth LC Facility, the “LC Facilities”) with a financial institution, which superseded and canceled the Guarantee Facility. As at December 31, 2024, the aggregate undrawn face amount of letters of credit under the Sixth LC Facility was $27.8 million.
As at December 31, 2024, the Company has indemnity agreements with three companies for the issuance of surety bonds of which $321.8 million of such surety bonds have been issued under these agreements.
The Company was in compliance with all covenants contained in the Credit Facility, Term Loan Facility, the LC Facilities, and the Notes as at December 31, 2024.
Off-Balance Sheet Arrangements
The Company’s off-balance sheet arrangements as at December 31, 2024 include outstanding letters of credit for environmental and site restoration costs, custom credits, government grants and other general corporate purposes of $1,035.6 million under the Credit Facility and the LC Facilities (see Note 27 to the consolidated financial statements). If the Company were to terminate these off-balance sheet arrangements, the Company’s liquidity position (as outlined in the table below) is sufficient to satisfy any related penalties or obligations.
19
Agnico Eagle’s contractual obligations as at December 31, 2024 are set out below:
|
| Total |
| 2025 |
| 2026-2027 |
| 2028-2029 |
| Thereafter | |||||
| | (millions of United States dollars) | |||||||||||||
Reclamation provisions(i) | | $ | 1,077.9 | | $ | 57.4 | | $ | 151.5 | | $ | 111.9 | | $ | 757.1 |
Contractual commitments(ii) | |
| 478.9 | |
| 412.4 | |
| 49.5 | |
| 9.9 | |
| 7.1 |
Pension obligations(iii) | |
| 97.9 | |
| 7.2 | |
| 7.7 | |
| 28.3 | |
| 54.7 |
Lease obligations | |
| 136.4 | |
| 42.3 | |
| 34.2 | |
| 19.3 | |
| 40.6 |
Long-term debt - principal(iv) | |
| 1,150.0 | |
| 90.0 | |
| 300.0 | |
| 245.0 | |
| 515.0 |
Long-term debt - interest(iv) | |
| 223.2 | |
| 48.5 | |
| 75.3 | |
| 52.8 | |
| 46.6 |
Total(v) | | $ | 3,164.3 | | $ | 657.8 | | $ | 618.2 | | $ | 467.2 | | $ | 1,421.1 |
Notes:
| (i) | Mining operations are subject to environmental regulations that require companies to reclaim and remediate land disturbed by mining operations. The Company has submitted closure plans to the appropriate governmental agencies which estimate the nature, extent and costs of reclamation for each of its mining properties. Expected reclamation cash flows are presented above on an undiscounted basis. Reclamation provisions recorded in the Company’s consolidated financial statements are measured at the expected value of future cash flows discounted to their present value using a risk-free interest rate. |
| (ii) | Purchase commitments include contractual commitments for the acquisition of property, plant and mine development. In addition to the above, the Company has $290.0 million of committed subscription proceeds related to the San Nicolás project. |
| (iii) | Agnico Eagle provides defined benefit plans for certain current and former senior officers and certain employees. The benefits are generally based on the employee’s years of service, age and level of compensation. The data included in this table have been actuarially determined. |
| (iv) | The Company has assumed that repayment of its long-term debt obligations will occur on each instrument’s respective maturity date. |
| (v) | The Company’s future operating cash flows are expected to be sufficient to satisfy its contractual obligations. |
2025 Liquidity and Capital Resources Analysis
The Company believes that it has sufficient capital resources to satisfy its 2025 mandatory expenditure commitments (including the contractual obligations set out above) and discretionary expenditure commitments. The following table sets out expected capital requirements and resources for 2025:
|
| Amount | |
| | (millions of United States dollars) | |
2025 Mandatory Commitments: | | | |
Contractual obligations, including capital expenditures (see table above) | | $ | 657.8 |
Accounts payable and accrued liabilities (as at December 31, 2024) | |
| 817.6 |
Total 2025 mandatory expenditure commitments | | $ | 1,475.4 |
2025 Discretionary Commitments: | |
|
|
Expected capital expenditures | | $ | 2,150.0 |
Expected exploration and corporate development expenses | |
| 225.0 |
Total 2025 discretionary expenditure commitments | |
| 2,375.0 |
Total 2025 mandatory and discretionary expenditure commitments | | $ | 3,850.4 |
As of December 31, 2024, the Company believes it had adequate capital resources available to satisfy its commitments, which include cash, cash equivalents and short-term investments of $933.7 million, working capital (excluding cash, cash equivalents and short-term investments) of $359.6 million and approximately $2.0 billion of available credit under the Credit Facility. In addition, the Company anticipates funding its commitments through cash provided by operating activities.
While the Company believes its capital resources will be sufficient to satisfy all 2025 commitments (mandatory and discretionary), the Company may choose to decrease certain of its discretionary expenditure commitments, which include certain capital expenditures and exploration and corporate development expenses, should unexpected financial circumstances arise in the future. The Company believes that it will continue to have sufficient capital resources available to satisfy its planned development and growth activities.
20
LaRonde mine
LaRonde mine – Operating Statistics | | Three Months Ended | | Year Ended | ||||||||
| | December 31, | | December 31, | | December 31, | | December 31, | ||||
|
| 2024 |
| 2023 |
| 2024 |
| 2023 | ||||
Tonnes of ore milled (thousands of tonnes) |
| | 405 |
| | 400 |
| | 1,554 |
| | 1,501 |
Tonnes of ore milled per day |
| | 4,402 |
| | 4,348 |
| | 4,246 |
| | 4,112 |
Gold grade (g/t) |
| | 5.47 |
| | 5.75 |
| | 4.91 |
| | 5.23 |
Gold production (ounces) |
| | 66,124 |
| | 68,520 |
| | 227,512 |
| | 235,991 |
Production costs per tonne (C$) |
| C$ | 158 |
| C$ | 162 |
| C$ | 210 |
| C$ | 196 |
Minesite costs per tonne (C$) |
| C$ | 211 |
| C$ | 208 |
| C$ | 208 |
| C$ | 201 |
Production costs per ounce | | $ | 693 | | $ | 699 | | $ | 1,052 | | $ | 924 |
Total cash costs per ounce | | $ | 780 | | $ | 814 | | $ | 889 | | $ | 840 |
Gold production
Fourth Quarter of 2024 – At the LaRonde mine, gold production decreased by 3.5% to 66,124 ounces in the fourth quarter of 2024, compared with 68,520 ounces in the fourth quarter of 2023, primarily due to lower gold grades, as expected under the planned mining sequence, partially offset by higher throughput levels.
Year Ended 2024 – Gold production decreased by 3.6% to 227,512 ounces in the year ended 2024, compared with 235,991 ounces in the year ended 2023 at the LaRonde mine primarily due to lower gold grades, as expected under the planned mining sequence, and recovery, partially offset by higher throughput levels.
Production costs
Fourth Quarter of 2024 – Production costs at the LaRonde mine were $45.8 million in the fourth quarter of 2024, a decrease of 4.3% compared with production costs of $47.9 million in the fourth quarter of 2023, primarily due to the timing of inventory sales and the weakening of the Canadian dollar relative to the US dollar between periods, partially offset by higher underground maintenance costs.
Production costs per tonne decreased when compared to the prior-year period primarily due to the higher volume of ore milled in the current period. Production costs per ounce decreased when compared to the prior-year period due to the same reasons outlined above for production costs, partially offset by fewer ounces of gold produced in the current period.
Year Ended 2024 – Production costs at the LaRonde mine were $239.3 million in the year ended 2024, an increase of 9.8% compared with production costs of $218.0 million in the year ended 2023, primarily due to timing of inventory sales, the consumption of stockpiles, which results in the incurrance of re-handling costs, and higher underground maintenance costs, partially offset by the weakening of the Canadian dollar relative to the US dollar between periods.
Production costs per tonne increased when compared to the prior-year period due to the reasons outlined above, other than foreign exchanges effects between periods, partially offset by higher volume of ore milled in the current period. Production costs per ounce increased when compared to the prior-year period due to the reasons outlined above and fewer ounces of gold produced in the current period.
Minesite cost per tonne and total cash costs per ounce
Fourth Quarter of 2024 – Minesite costs per tonne increased when compared to the prior-year period primarily due to higher underground mining costs, partially offset by the higher volume of ore milled. Total cash costs per ounce decreased for the same reasons described above for production costs per ounce.
Year Ended 2024 – Minesite costs per tonne increased when compared to the prior-year period primarily due to the consumption of stockpiles, including re-handling costs, and higher underground and mill maintenance costs, partially offset by the higher volume of ore milled. Total cash costs per ounce increased for the same reasons described above for production costs per ounce.
21
LZ5
LZ5 – Operating Statistics | | Three Months Ended | | Year Ended | ||||||||
| | December 31, | | December 31, | | December 31, | | December 31, | ||||
|
| 2024 |
| 2023 |
| 2024 |
| 2023 | ||||
Tonnes of ore milled (thousands of tonnes) |
| | 397 |
| | 263 |
| | 1,295 |
| | 1,157 |
Tonnes of ore milled per day |
| | 4,315 |
| | 2,859 |
| | 3,538 |
| | 3,170 |
Gold grade (g/t) |
| | 2.06 |
| | 2.16 |
| | 2.06 |
| | 2.01 |
Gold production (ounces) |
| | 24,323 |
| | 17,245 |
| | 79,238 |
| | 70,657 |
Production costs per tonne (C$) |
| C$ | 78 |
| C$ | 98 |
| C$ | 85 |
| C$ | 95 |
Minesite costs per tonne (C$) |
| C$ | 81 |
| C$ | 80 |
| C$ | 90 |
| C$ | 91 |
Production costs per ounce | | $ | 910 | | $ | 1,097 | | $ | 1,012 | | $ | 1,155 |
Total cash costs per ounce | | $ | 980 | | $ | 965 | | $ | 1,105 | | $ | 1,148 |
Gold production
Fourth Quarter of 2024 – At LZ5, gold production increased by 41.0% to 24,323 ounces in the fourth quarter of 2024 compared with 17,245 ounces in the fourth quarter of 2023, primarily due to higher throughput levels from increased productivity gains from automation initiatives, partially offset by lower gold grades.
Year Ended 2024 – Gold production increased by 12.1% to 79,238 ounces in the year ended 2024 from 70,657 ounces in the year ended 2023 at LZ5 primarily due to higher throughput levels from increased productivity gains from automation initiatives and higher gold grades partially offset by lower recovery.
Production costs
Fourth Quarter of 2024 – Production costs at LZ5 were $22.1 million in the fourth quarter of 2024, an increase of 16.9% compared with production costs of $18.9 million in the fourth quarter of 2023, primarily due to the consumption of stockpiles, including re-handling costs and higher milling costs, partially offset by the weakening of the Canadian dollar relative to the US dollar between periods.
Production costs per tonne decreased when compared to the prior-year period primarily due to the higher volume of ore milled in the current period, partially offset by the consumption of stockpiles, including re-handling costs, in the current period. Production costs per ounce decreased when compared to the prior-year period due to more ounces of gold produced in the current period, partially offset by the consumption of stockpiles, including re-handling costs, in the current period.
Year Ended 2024 – Production costs at LZ5 were $80.2 million in the year ended 2024, a decrease of 1.8% compared with production costs of $81.6 million in the year ended 2023, primarily due to the timing of inventory sale and the weakening of the Canadian dollar relative to the US dollar between periods, partially offset by higher underground maintenance and service costs and the consumption of stockpiles, which results in the incurrance of re-handling costs.
Production costs per tonne decreased when compared to the prior-year period primarily due to the higher volume of ore milled in the current period. Production costs per ounce decreased when compared to the prior-year period due to the same reasons outlined above for production costs and more ounces of gold produced in the current period.
Minesite cost per tonne and total cash costs per ounce
Fourth Quarter of 2024 – Minesite costs per tonne increased when compared to the prior-year period due to the consumption of stockpiles, which results in the incurrance of re-handling costs, and higher milling costs. Total cash costs per ounce increased when compared to the prior-year period due to the consumption of stockpiles, which results in the incurrance of re-handling costs, and higher milling costs, partially offset by the weakening of the Canadian dollar relative to the US dollar between periods.
Year Ended 2024 – Minesite costs per tonne decreased as compared to the prior-year period for the same reasons outlined above for the lower production cost per tonne. Total cash costs per ounce decreased when compared to the prior-year period due to the same reasons outlined above for the lower production costs per ounce.
22
LaRonde
LaRonde – Operating Statistics | | Three Months Ended | | Year Ended | ||||||||
| | December 31, | | December 31, | | December 31, | | December 31, | ||||
|
| 2024 |
| 2023 |
| 2024 |
| 2023 | ||||
Tonnes of ore milled (thousands of tonnes) |
| | 802 |
| | 663 |
| | 2,849 |
| | 2,658 |
Tonnes of ore milled per day |
| | 8,717 |
| | 7,207 |
| | 7,784 |
| | 7,282 |
Gold grade (g/t) |
| | 3.78 |
| | 4.33 |
| | 3.62 |
| | 3.83 |
Gold production (ounces) |
| | 90,447 |
| | 85,765 |
| | 306,750 |
| | 306,648 |
Production costs per tonne (C$) |
| C$ | 118 |
| C$ | 137 |
| C$ | 153 |
| C$ | 152 |
Minesite costs per tonne (C$) |
| C$ | 146 |
| C$ | 157 |
| C$ | 154 |
| C$ | 153 |
Production costs per ounce | | $ | 751 | | $ | 779 | | $ | 1,042 | | $ | 977 |
Total cash costs per ounce | | $ | 834 | | $ | 845 | | $ | 945 | | $ | 911 |
Gold production
Fourth Quarter of 2024 – Gold production at LaRonde increased by 5.45% when compared to the prior-year period primarily due to higher volumes of ore mined and milled at LZ5 as part of the mining plan, partially offset by lower gold grades as per the mining sequence.
Year Ended 2024 – Gold production at LaRonde increased slightly when compared to the prior-year period due to higher volumes of ore mined and milled at LZ5 as part of the mining plan, offset by lower gold grades as per the mining sequence and lower recovery.
Production costs
Fourth Quarter of 2024 – Production costs at LaRonde increased by 1.7% in the fourth quarter of 2024 when compared with the fourth quarter of 2023, primarily due to the consumption of stockpiles, which results in the incurrance of re-handling costs, and higher underground maintenance and service costs, partially offset by the timing of inventory sales and the weakening of the Canadian dollar relative to the US dollar between periods.
Production costs per tonne decreased when compared to the prior-year period due to the higher volume of ore milled in the current period, partially offset by higher production costs discussed above. Production costs per ounce decreased when compared to the prior period due to more ounces of gold being produced in the current period.
Year Ended 2024 – Production costs at LaRonde increased by 6.6% in the year ended 2024 compared with the year ended 2023 primarily due to the consumption of stockpiles, which results in the incurrance of re-handling costs, higher underground maintenance and service costs, partially offset by weakening of the Canadian dollar relative to the US dollar between periods.
Production costs per tonne increased when compared to the prior-year period primarily due to higher underground maintenance and service costs, partially offset by the higher volume of ore milled in the current period. Production costs per ounce increased when compared to the prior-year period primarily due to higher production costs as described above for production costs.
Minesite cost per tonne and total cash costs per ounce
Fourth Quarter of 2024 – Minesite costs per tonne decreased when compared to the prior-year period due to the same reasons outlined above regarding the decrease in production costs per tonne. Total cash costs per ounce decreased when compared to the prior-year period for the same reasons outlined above for the decrease in production costs per ounce.
Year Ended 2024 – Minesite costs per tonne increased when compared to the prior-year period primarily due to the reasons outlined above regarding the increase in production costs per tonne. Total cash costs per ounce increased when compared to the prior-year period primarily for the same reasons as the increase in production costs per ounce.
23
Canadian Malartic
Canadian Malartic – Operating Statistics | | Three Months Ended | | Year Ended | ||||||||
| | December 31, | | December 31, | | December 31, | | December 31, | ||||
|
| 2024 |
| 2023 |
| 2024 |
| 2023 | ||||
Tonnes of ore milled (thousands of tonnes) (100%) |
| | 5,100 |
| | 5,278 |
| | 20,317 |
| | 19,595 |
Tonnes of ore milled per day (100%) |
| | 55,446 |
| | 57,370 |
| | 55,511 |
| | 53,685 |
Gold grade (g/t) |
| | 0.97 |
| | 1.08 |
| | 1.09 |
| | 1.17 |
Gold production (ounces)(1) |
| | 146,485 |
| | 168,272 |
| | 655,654 |
| | 603,955 |
Production costs per tonne (C$) |
| C$ | 36 |
| C$ | 36 |
| C$ | 36 |
| C$ | 36 |
Minesite costs per tonne (C$) |
| C$ | 41 |
| C$ | 40 |
| C$ | 41 |
| C$ | 39 |
Production costs per ounce | | $ | 902 | | $ | 825 | | $ | 811 | | $ | 771 |
Total cash costs per ounce | | $ | 1,014 | | $ | 913 | | $ | 930 | | $ | 824 |
Note:
| (i) | Reflects Agnico Eagle’s 50% interest in Canadian Malartic up to and including March 30, 2023 and 100% thereafter. |
Gold production
Fourth Quarter of 2024 – At Canadian Malartic, gold production decreased by 12.9% to 146,485 ounces in the fourth quarter of 2024 compared with gold production of 168,272 ounces in the fourth quarter of 2023, due to lower grade from mining sequence combined with lower throughput and recovery.
Year Ended 2024 – At Canadian Malartic, gold production increased by 8.6% to 655,654 ounces in the year ended 2024 compared with attributable gold production of 603,955 ounces in the year ended 2023, due to the increase in the Company’s ownership percentage of Canadian Malartic between periods from 50% to 100% as a result of the Yamana Transaction.
Production costs
Fourth Quarter of 2024 – Production costs at Canadian Malartic were $132.1 million in the fourth quarter of 2024, a decrease of 4.8% compared with production costs of $138.9 million in the fourth quarter of 2023, primarily due to lower open pit mining costs, a higher deferred strip ratio and the weakening of the Canadian dollar relative to the US dollar between periods, partially offset by the timing of inventory sales and higher royalty costs.
Production costs per tonne remained the same when compared to the prior-year period as the decrease in production costs was offset by the decrease in throughput. Production costs per ounce increased when compared to the prior-year period due to fewer ounces of gold produced in the current period.
Year Ended 2024 – Production costs at Canadian Malartic were $532.0 million in the year ended 2024, an increase of 14.2% compared with production costs of $465.8 million in the year ended 2023, due to the impact of the change in ownership percentage between periods and the recognition of fair value adjustments to inventory resulting from the Yamana Transaction and higher royalty costs, partially offset by a higher deferred strip ratio and the weakening of the Canadian dollar relative to the US dollar between periods.
Production costs per tonne remained the same as the prior-year period as the increase in production costs was offset by the increase in throughput. Production costs per ounce increased when compared to the prior-year period primarily due to higher royalty costs and higher underground production costs with the ramp-up of operations at the Odyssey mine, partially offset by more ounces of gold produced in the current period.
Minesite cost per tonne and total cash costs per ounce
Fourth Quarter of 2024 – Minesite costs per tonne increased when compared to the prior-year period due to higher royalty costs during the quarter, and a lower volume of ore milled. Total cash costs per ounce increased when compared to the prior-year period primarily due to fewer ounces of gold produced in the current period.
24
Year Ended 2024 – Minesite costs per tonne increased when compared to the prior-year period due to higher royalty costs in the current period partially offset by higher volume of ore milled. Total cash costs per ounce increased when compared to the prior-year period for the same reasons outlined above for the increased production costs per ounce.
Goldex
Goldex – Operating Statistics | | Three Months Ended | | Year Ended | ||||||||
| | December 31, | | December 31, | | December 31, | | December 31, | ||||
|
| 2024 |
| 2023 |
| 2024 |
| 2023 | ||||
Tonnes of ore milled (thousands of tonnes) |
| | 812 |
| | 672 |
| | 3,076 |
| | 2,887 |
Tonnes of ore milled per day |
| | 8,826 |
| | 7,304 |
| | 8,404 |
| | 7,910 |
Gold grade (g/t) |
| | 1.45 |
| | 1.79 |
| | 1.55 |
| | 1.74 |
Gold production (ounces) |
| | 32,341 |
| | 33,364 |
| | 130,813 |
| | 140,983 |
Production costs per tonne (C$) |
| C$ | 51 |
| C$ | 55 |
| C$ | 58 |
| C$ | 52 |
Minesite costs per tonne (C$) |
| C$ | 56 |
| C$ | 58 |
| C$ | 59 |
| C$ | 53 |
Production costs per ounce | | $ | 910 | | $ | 816 | | $ | 994 | | $ | 795 |
Total cash costs per ounce | | $ | 859 | | $ | 877 | | $ | 923 | | $ | 820 |
Gold production
Commercial production was achieved at the Akasaba West mine in February 2024.
Fourth Quarter of 2024 – Gold production at Goldex decreased by 3.1% to 32,341 ounces in the fourth quarter of 2024, compared with 33,364 ounces in the fourth quarter of 2023, primarily due to lower gold grades from increased ore sourced from Akasaba West, partially offset by higher throughput.
Year Ended 2024 – Gold production decreased by 7.2% to 130,813 ounces in the year ended 2024, compared with 140,983 ounces in the year ended 2023 at Goldex due to lower gold grades resulting from increased ore sourced from Akasaba West and lower recovery, partially offset by a higher throughput.
Production costs
Fourth Quarter of 2024 – Production costs at Goldex were $29.4 million in the fourth quarter of 2024, an increase of 8.2% compared with production costs of $27.2 million in the fourth quarter of 2023, primarily due to a lower stripping ratio associated with Akasaba West, partially offset by the timing of inventory sales and a build-up in stockpiles and the weakening of the Canadian dollar relative to the US dollar between periods.
Production costs per tonne decreased when compared to the prior-year period due to higher volume of ore milled in the period. Production costs per ounce increased when compared to the prior-year period due to the same reasons outlined above for production costs and fewer ounces of gold produced in the current period.
Year Ended 2024 – Production costs at Goldex were $130.0 million in the year ended 2024, an increase of 16.0% compared with production costs of $112.0 million in the year ended 2023, primarily due to a lower deferred stripping ratio associated with Akasaba West and higher milling costs partially offset by a build-up in stockpiles and the weakening of the Canadian dollar relative to the US dollar between periods.
Production costs per tonne increased when compared to the prior-year period for the same reasons described above for production costs, other than foreign exchange effects between periods, partially offset by higher volume of ore milled in the current period. Production costs per ounce increased when compared to the prior-year period due to the same reasons outlined above for production costs and fewer ounces of gold produced in the current period.
Minesite cost per tonne and total cash costs per ounce
Fourth Quarter of 2024 – Minesite costs per tonne decreased when compared to the prior-year period mainly due to the higher volume of ore milled in the period. Total cash costs per ounce decreased when compared to the prior-year period mainly due to a build-up in stockpiles and the weakening of the Canadian dollar relative to the US dollar between periods.
25
Year Ended 2024 – Minesite costs per tonne increased when compared to the prior-year period primarily due to the same reasons outlined above for the higher production costs per tonne. Total cash costs per ounce increased when compared to the prior-year period due to the same reasons outlined above for the higher production costs per ounce.
Detour Lake
Detour Lake – Operating Statistics | | Three Months Ended | | Year Ended | ||||||||
| | December 31, | | December 31, | | December 31, | | December 31, | ||||
|
| 2024 |
| 2023 |
| 2024 |
| 2023 | ||||
Tonnes of ore milled (thousands of tonnes) |
| | 7,086 |
| | 6,608 |
| | 27,462 |
| | 25,435 |
Tonnes of ore milled per day |
| | 77,022 |
| | 71,826 |
| | 75,033 |
| | 69,685 |
Gold grade (g/t) |
| | 0.87 |
| | 1.02 |
| | 0.85 |
| | 0.91 |
Gold production (ounces) |
| | 179,061 |
| | 193,475 |
| | 671,950 |
| | 677,446 |
Production costs per tonne (C$) |
| C$ | 23 |
| C$ | 25 |
| C$ | 25 |
| C$ | 24 |
Minesite costs per tonne (C$) |
| C$ | 26 |
| C$ | 27 |
| C$ | 26 |
| C$ | 26 |
Production costs per ounce | | $ | 657 | | $ | 622 | | $ | 740 | | $ | 669 |
Total cash costs per ounce | | $ | 755 | | $ | 691 | | $ | 796 | | $ | 735 |
Gold production
Fourth Quarter of 2024 – At Detour Lake, gold production decreased by 7.5% to 179,061 ounces in the fourth quarter of 2024 compared with 193,475 ounces in the fourth quarter of 2023, primarily due to lower gold grades as expected from the mining sequence and lower recovery as a result of higher solution losses, partially offset by higher throughput from a higher mill run-time and optimized mill equipment.
Year Ended 2024 – Gold production at Detour Lake decreased by 0.8% to 671,950 ounces in the year ended 2024 compared with 677,446 ounces in the year ended 2023, primarily due to lower recovery and gold grades, mainly due to abnormal chipping of grinding media affecting grinding efficiency, partially offset by higher throughput from a higher mill run-time and optimized mill equipment.
Production costs
Fourth Quarter of 2024 – Production costs at Detour Lake were $117.7 million in the fourth quarter of 2024, a decrease of 2.1% compared with production costs of $120.3 million in the fourth quarter of 2023, primarily due to lower mining and milling costs and the weakening of the Canadian dollar relative to the US dollar between periods, partially offset by higher royalty costs and higher open pit maintenance costs.
Production costs per tonne decreased when compared to the prior-year period mainly due to the higher volume of ore milled in the current period. Production costs per ounce increased when compared to the prior-year period due to fewer ounces of gold produced in the current period.
Year Ended 2024 – Production costs at Detour Lake were $497.1 million in the year ended 2024, an increase of 9.6% compared to production costs of $453.5 million during the year ended 2023, primarily due to higher open pit maintenance costs, higher milling costs as a result of lower grinding media efficiency in the SAG mill and higher royalty costs, partially offset by a higher stripping ratio and the weakening of the Canadian dollar relative to the US dollar between periods.
Production costs per tonne increased when compared to the prior-year period due to the same reasons outlined above for production costs partially offset by higher volume of ore milled in the current period. Production costs per ounce increased when compared to the prior-year period due to the same reasons outlined above for production costs and fewer ounces of gold produced in the current period.
Minesite cost per tonne and total cash costs per ounce
Fourth Quarter of 2024 – Minesite costs per tonne decreased when compared to the prior period due to the higher volume of ore milled in the current period. Total cash costs per ounce increased when compared to the prior-year period due to fewer ounces of gold produced in the current period.
26
Year Ended 2024 – Minesite costs per tonne remained the same compared to the prior-year period with the increased production costs being offset by the increase in volume of ore milled in the current period. Total cash cost per ounce increased when compared to the prior year period due to the same reasons outlined above for the higher production costs per ounce.
Additional Information Regarding Detour Lake
At Detour Lake, the Company estimates that a $130 increase or decrease in the gold price assumption would result in an approximate 30% increase or 20% decrease, respectively, in mineral reserves. Additional information regarding the Company’s other material properties will be available in the AIF for the year ended December 31, 2024.
Macassa
Macassa – Operating Statistics | | Three Months Ended | | Year Ended | ||||||||
|
| December 31, |
| December 31, |
| December 31, |
| December 31, | ||||
|
| 2024 |
| 2023 |
| 2024 |
| 2023 | ||||
Tonnes of ore milled (thousands of tonnes) |
| | 154 |
| | 131 |
| | 574 |
| | 442 |
Tonnes of ore milled per day |
| | 1,674 |
| | 1,424 |
| | 1,568 |
| | 1,211 |
Gold grade (g/t) |
| | 15.87 |
| | 14.82 |
| | 15.55 |
| | 16.47 |
Gold production (ounces) |
| | 76,336 |
| | 60,584 |
| | 279,384 |
| | 228,535 |
Production costs per tonne (C$) |
| C$ | 498 |
| C$ | 445 |
| C$ | 482 |
| C$ | 475 |
Minesite costs per tonne (C$) |
| C$ | 489 |
| C$ | 473 |
| C$ | 498 |
| C$ | 503 |
Production costs per ounce | | $ | 715 | | $ | 704 | | $ | 721 | | $ | 678 |
Total cash costs per ounce | | $ | 708 | | $ | 763 | | $ | 748 | | $ | 731 |
Gold production
Fourth Quarter of 2024 – At Macassa, gold production increased by 26.0% to 76,336 ounces in the fourth quarter of 2024 compared with 60,584 ounces in the fourth quarter of 2023, primarily due to higher throughput resulting from increased productivity from a larger workforce, new ventilation infrastructure, improved equipment availability and the addition of ore sourced from the Near Surface deposit and higher gold grades from the mine sequence.
Year Ended 2024 – Gold production at Macassa increased by 22.2% to 279,384 ounces in the year ended 2024 compared to 228,535 ounces in the year ended 2023, primarily due to higher throughput resulting from increased productivity from a larger workforce, new ventilation infrastructure, improved equipment availability and the addition of ore sourced from the Near Surface deposit, partially offset by lower gold grades.
Production costs
Fourth Quarter of 2024 – Production costs were $54.6 million in the fourth quarter of 2024, an increase of 28.0% compared with production costs of $42.7 million in the fourth quarter of 2023, primarily due to higher mining costs resulting from increased mining rate in the period when compared to the prior period, higher royalty costs and the timing of inventory sales, partially offset by the weakening of the Canadian dollar relative to the US dollar between periods.
Production costs per tonne increased when compared to the prior-year period due to the same reasons outlined above for higher production costs, partially offset by the higher volume of ore milled in the current period. Production costs per ounce increased when compared to the prior-year period due to the same reasons outlined above for higher production costs, partially offset by more ounces of gold production in the current period.
Year Ended 2024 – Production costs were $201.4 million in the year ended 2024, an increase of 29.9% compared to production costs of $155.0 million during the year ended 2023, primarily due to higher mining costs as a result of increased mining rate when compared to prior period, partially offset by the weakening of the Canadian dollar relative to the US dollar between periods.
Production costs per tonne increased when compared to the prior-year period due to the same reasons outlined above for higher production costs, partially offset by the higher volume of ore milled in the current period. Production costs per ounce increased when compared to the prior-year period due to the same reasons outlined above for higher production costs, partially offset by more ounces of gold produced in the current period.
27
Minesite cost per tonne and total cash costs per ounce
Fourth Quarter of 2024 – Minesite costs per tonne increased when compared to the prior-year period due to the same reasons as for the higher production costs per tonne. Total cash costs per ounce decreased when compared to the prior-year period due to more ounces of gold produced in the current period.
Year Ended 2024 – Minesite costs per tonne decreased when compared to the prior-year period due to the higher volume of ore milled in the current period. Total cash costs per ounce increased when compared to the prior-year period due to the same reasons as for the higher production costs per ounce.
Meliadine
Meliadine – Operating Statistics | | Three Months Ended | | Year Ended | ||||||||
| | December 31, | | December 31, | | December 31, | | December 31, | ||||
|
| 2024 |
| 2023 |
| 2024 |
| 2023 | ||||
Tonnes of ore milled (thousands of tonnes) |
| | 516 |
| | 511 |
| | 1,966 |
| | 1,918 |
Tonnes of ore milled per day |
| | 5,620 |
| | 5,554 |
| | 5,372 |
| | 5,255 |
Gold grade (g/t) |
| | 5.89 |
| | 6.03 |
| | 6.22 |
| | 6.11 |
Gold production (ounces) |
| | 94,648 |
| | 96,285 |
| | 378,886 |
| | 364,141 |
Production costs per tonne (C$) |
| C$ | 257 |
| C$ | 251 |
| C$ | 243 |
| C$ | 241 |
Minesite costs per tonne (C$) |
| C$ | 263 |
| C$ | 249 |
| C$ | 247 |
| C$ | 249 |
Production costs per ounce | | $ | 1,012 | | $ | 981 | | $ | 924 | | $ | 944 |
Total cash costs per ounce | | $ | 1,037 | | $ | 992 | | $ | 940 | | $ | 980 |
Gold production
Fourth Quarter of 2024 – At Meliadine, gold production decreased by 1.7% to 94,648 ounces in the fourth quarter of 2024 compared with 96,285 ounces in the fourth quarter of 2023, primarily due to lower gold grades under the mining sequence, partially offset by higher throughput as a result of the commissioning of the Phase 2 mill expansion.
Year Ended 2024 – Gold production increased by 4.0% to 378,886 ounces in the year ended 2024 compared with 364,141 ounces in the year ended 2023, primarily due to higher throughput and higher gold grades under the mining sequence.
Production costs
Fourth Quarter of 2024 – Production costs at Meliadine were $95.8 million in the fourth quarter of 2024, an increase of 1.5% compared with production costs of $94.4 million in the fourth quarter of 2023, primarily due to higher underground services and royalty costs, partially offset by the weakening of the Canadian dollar relative to the US dollar between periods.
Production costs per tonne increased when compared to the prior-year period due to the same reasons outlined above for higher production costs, other than foreign exchange effects between periods, partially offset by a higher volume of ore milled in the current period. Production costs per ounce increased when compared to the prior-year period due to the same reasons outlined above for production costs and fewer ounces of gold produced in the current period.
Year Ended 2024 – Production costs at Meliadine were $350.3 million during the year ended 2024, an increase of 1.9% compared to production costs of $343.7 million during the year ended 2023, primarily due to higher underground services and royalty costs, partially offset by the build-up of stockpiles in the current period and the weakening of the Canadian dollar relative to the US dollar between periods.
Production costs per tonne increased when compared to the prior-year period for the same reasons described above for production costs, other than foreign exchange effects between periods and the timing of inventory sales, partially offset by a higher volume of ore milled in the current period. Production costs per ounce decreased in the current period due to more ounces of gold being produced in the current period.
28
Minesite cost per tonne and total cash costs per ounce
Fourth Quarter of 2024 – Minesite costs per tonne increased when compared to the prior-year period for the same reasons outlined above for the higher production costs per tonne. Total cash costs per ounce increased when compared to the prior-year period for the same reasons outlined above for the production costs per ounce.
Year Ended 2024 – Minesite costs per tonne decreased when compared to the prior-year period primarily due to the higher volume of ore milled. Total cash costs per ounce decreased when compared to the prior-year period primarily due to the same reasons outlined above for production costs per ounce.
Meadowbank
Meadowbank – Operating Statistics | | Three Months Ended | | Year Ended | ||||||||
|
| December 31, |
| December 31, |
| December 31, |
| December 31, | ||||
|
| 2024 |
| 2023 |
| 2024 |
| 2023 | ||||
Tonnes of ore milled (thousands of tonnes) |
| | 999 |
| | 938 |
| | 4,143 |
| | 3,843 |
Tonnes of ore milled per day |
| | 10,848 |
| | 10,196 |
| | 11,320 |
| | 10,529 |
Gold grade (g/t) |
| | 4.07 |
| | 3.97 |
| | 4.18 |
| | 3.86 |
Gold production (ounces) |
| | 117,024 |
| | 109,226 |
| | 504,719 |
| | 431,666 |
Production costs per tonne (C$) |
| C$ | 154 |
| C$ | 206 |
| C$ | 153 |
| C$ | 183 |
Minesite costs per tonne (C$) |
| C$ | 161 |
| C$ | 185 |
| C$ | 156 |
| C$ | 179 |
Production costs per ounce | | $ | 945 | | $ | 1,306 | | $ | 918 | | $ | 1,214 |
Total cash costs per ounce | | $ | 988 | | $ | 1,186 | | $ | 938 | | $ | 1,176 |
Gold production
Fourth Quarter of 2024 – At Meadowbank, gold production increased by 7.1% to 117,024 ounces in the fourth quarter of 2024, compared with 109,226 ounces in the fourth quarter of 2023, primarily due to higher throughput and higher gold grades as expected under the mine sequence, partially offset by lower recovery.
Year Ended 2024 – Gold production increased by 16.9% to 504,719 ounces in the year ended 2024 compared with 431,666 ounces in the year ended 2023, primarily due to higher gold grades as expected under the mine sequence and higher throughput, as the comparative period was affected by unplanned downtime at the SAG mill and unplanned shutdowns of the Amaruq to Meadowbank road due to caribou migration patterns.
Production costs
Fourth Quarter of 2024 – Production costs at Meadowbank were $110.6 million in the fourth quarter of 2024, a decrease of 22.5% compared with production costs of $142.6 million in the fourth quarter of 2023, primarily due to a build-up in stockpiles, the timing of inventory sales, and the weakening of the Canadian dollar relative to the US dollar between periods, partially offset by higher royalty costs.
Production costs per tonne decreased when compared to the prior-year period due to the higher volume of ore milled and the build-up in stockpiles in the current period. Production costs per ounce decreased when compared to the prior-year period due to more ounces of gold being produced in the current period and the same reasons outlined above for lower production costs.
Year Ended 2024 – Production costs at Meadowbank were $463.5 million in the year ended 2024, a decrease of 11.6% compared with production costs of $524.0 million in the year ended 2023, primarily due to a build-up in stockpiles, the timing of inventory sales, and the weakening of the Canadian dollar relative to the US dollar between periods, partially offset by a lower stripping ratio and higher royalty costs.
29
Production costs per tonne decreased when compared to the prior-year period primarily due to a higher volume of ore milled in the current period. Production costs per ounce decreased when compared to the prior-year period primarily due to more ounces of gold produced in the current period.
Minesite cost per tonne and total cash costs per ounce
Fourth Quarter of 2024 – Minesite costs per tonne decreased when compared to the prior-year period due to the same reasons as for the lower production costs per tonne. Total cash costs per ounce decreased when compared to the prior-year period due to the same reasons outlined above for the lower production costs per ounce.
Year Ended 2024 – Minesite costs per tonne decreased when compared to the prior-year period due to the same reasons as for the lower production costs per tonne. Total cash costs per ounce decreased when compared to the prior-year period due to the same reasons outlined above for the lower production costs per ounce.
Fosterville
Fosterville – Operating Statistics | | Three Months Ended |
| Year Ended | ||||||||
|
| December 31, |
| December 31, |
| December 31, |
| December 31, | ||||
|
| 2024 |
| 2023 |
| 2024 |
| 2023 | ||||
Tonnes of ore milled (thousands of tonnes) |
| | 158 |
| | 183 | | | 810 |
| | 651 |
Tonnes of ore milled per day |
| | 1,717 |
| | 1,989 | | | 2,213 |
| | 1,784 |
Gold grade (g/t) |
| | 7.65 |
| | 8.79 | | | 8.96 |
| | 13.61 |
Gold production (ounces) |
| | 37,139 |
| | 49,533 | | | 225,203 |
| | 277,694 |
Production costs per tonne (A$) |
| A$ | 319 |
| A$ | 259 | | A$ | 277 |
| A$ | 304 |
Minesite costs per tonne (A$) |
| A$ | 325 |
| A$ | 261 | | A$ | 276 |
| A$ | 301 |
Production costs per ounce | | $ | 868 | | $ | 632 | | $ | 653 | | $ | 473 |
Total cash costs per ounce | | $ | 878 | | $ | 723 | | $ | 647 | | $ | 488 |
Gold production
Fourth Quarter of 2024 – At Fosterville, gold production decreased by 25.0% to 37,139 ounces in the fourth quarter of 2024 compared with 49,533 ounces in the fourth quarter of 2023, primarily due to lower throughput and lower gold grades when compared to the prior period as the ultra-high grade Swan zone is depleting in line with the mine plan.
Year Ended 2024 – Gold production at Fosterville decreased by 18.9% to 225,203 ounces in the year ended 2024, compared with 277,694 ounces in the year ended 2023, primarily due to lower grades as the ultra-high grade Swan zone is depleting in line with the mine plan, partially offset by the higher throughput.
Production costs
Fourth Quarter of 2024 – Production costs were $32.2 million in the fourth quarter of 2024, an increase of 2.8% compared with production costs of $31.3 million in the fourth quarter of 2023, primarily due to higher mining and milling costs and the timing of inventory sales, partially offset by the weakening of the Australian dollar relative to the US dollar in the period.
Production costs per tonne increased when compared to the prior-year period due to a lower volume of ore milled in the period. Production costs per ounce increased when compared to the prior-year period due to fewer ounces of gold produced in the period.
Year Ended 2024 – Production costs were $147.0 million in the year ended 2024, an increase of 12.0% compared to production costs of $131.3 million during the year ended 2023, primarily due to higher mining and milling costs, as a result increased volumes as the Company continues to focus on productivity gains and cost control at the mine and the mill to maximize throughput and reduce unit costs as gold grades continue to decline with the depletion of the Swan zone, and higher royalty costs, partially offset by the weakening of the Australian dollar relative to the US dollar in the period.
Production costs per tonne decreased when compared to the prior-year period due to the higher volume of ore milled. Production costs per ounce increased when compared to the prior-year period due to fewer ounces produced in the period.
30
On May 29, 2023 the Victorian Environment Protection Authority lifted the prohibition notice related to excess noise levels on Fosterville that was imposed in late 2021, allowing Fosterville to resume normal activities throughout the month of June 2023.
Minesite cost per tonne and total cash costs per ounce
Fourth Quarter of 2024 – Minesite costs per tonne increased when compared to the prior-year period due to the same reasons as for the higher production costs per tonne. Total cash costs per ounce increased when compared to the prior-year period due to the same reasons outlined above for higher production costs per ounce.
Year Ended 2024 – Minesite costs per tonne decreased when compared to the prior-year period due to the same reasons as for the lower production costs per tonne. Total cash costs per ounce increased when compared to the prior-year period due to the same reasons outlined above for higher production costs per ounce.
Kittila
Kittila – Operating Statistics | | Three Months Ended | | Year Ended | ||||||||
| | December 31, | | December 31, | | December 31, | | December 31, | ||||
|
| 2024 |
| 2023 |
| 2024 |
| 2023 | ||||
Tonnes of ore milled (thousands of tonnes) |
| | 476 |
| | 514 |
| | 2,026 |
| | 1,954 |
Tonnes of ore milled per day |
| | 5,174 |
| | 5,587 |
| | 5,536 |
| | 5,353 |
Gold grade (g/t) |
| | 4.15 |
| | 4.55 |
| | 4.11 |
| | 4.48 |
Gold production (ounces) |
| | 51,893 |
| | 61,172 |
| | 218,860 |
| | 234,402 |
Production costs per tonne (€) | | € | 100 | | € | 91 | | € | 103 |
| € | 98 |
Minesite costs per tonne (€) | | € | 106 | | € | 96 | | € | 103 | | € | 99 |
Production costs per ounce | | $ | 979 | | $ | 828 | | $ | 1,039 | | $ | 878 |
Total cash costs per ounce | | $ | 1,026 | | $ | 858 | | $ | 1,031 | | $ | 871 |
Gold production
Fourth Quarter of 2024 – At Kittila, gold production decreased by 15.2% to 51,893 ounces in the fourth quarter of 2024, compared with 61,172 ounces in the fourth quarter of 2023, primarily due to lower gold grades as expected under the mining sequence and lower throughput.
Year Ended 2024 – Gold production decreased by 6.6% to 218,860 ounces in the year ended 2024, compared with 234,402 ounces in the year ended 2023 due to lower grades as expected under the mining sequence and lower recovery, partially offset by higher throughput.
Production costs
Fourth Quarter of 2024 – Production costs at Kittila were $50.8 million in the fourth quarter of 2024, an increase of 0.3% compared with production costs of $50.7 million in the fourth quarter of 2023, primarily due to higher mill maintenance and royalty costs, partially offset by the weakening of the Euros relative to the US dollar between periods.
Production costs per tonne increased when compared to the prior-year period primarily due to a lower volume of ore milled in the current period. Production costs per ounce increased when compared to the prior-year period primarily due to fewer ounces of gold produced in the current period.
Year Ended 2024 – Production costs at Kittila were $227.3 million in the year ended of 2024, an increase of 10.4% compared with production costs of $205.9 million in the year ended 2023, primarily due to higher underground mining and maintenance costs, higher milling and royalty costs.
Production costs per tonne increased when compared to the prior-year period primarily due to the same reasons outlined above for production costs, partially offset by a higher volume of ore milled in the current period. Production costs per ounce increased when compared to the prior-year period due to the same reasons outlined above for production costs and fewer ounces of gold produced in the current period.
31
Minesite cost per tonne and total cash costs per ounce
Fourth Quarter of 2024 – Minesite costs per tonne increased when compared to the prior-year period due to the same reasons as for the higher production costs per tonne. Total cash costs per ounce increased when compared to the prior-year period due to the same reasons as the higher production costs per ounce.
Year Ended 2024 – Minesite costs per tonne increased when compared to the prior year period due to the same reasons as for the higher production costs per tonne. Total cash costs per ounce increased when compared to the prior year period due to the same reasons as the higher production costs per ounce.
Pinos Altos
Pinos Altos – Operating Statistics | | Three Months Ended | | Year Ended | ||||||||
| | December 31, | | December 31, | | December 31, | | December 31, | ||||
|
| 2024 |
| 2023 |
| 2024 |
| 2023 | ||||
Tonnes of ore milled (thousands of tonnes) |
| | 381 |
| | 441 |
| | 1,707 |
| | 1,656 |
Tonnes of ore milled per day |
| | 4,141 |
| | 4,793 |
| | 4,664 |
| | 4,537 |
Gold grade (g/t) |
| | 1.58 |
| | 1.91 |
| | 1.69 |
| | 1.92 |
Gold production (ounces) |
| | 18,583 |
| | 25,963 |
| | 88,433 |
| | 97,642 |
Production costs per tonne | | $ | 119 | | $ | 87 | | $ | 99 | | $ | 88 |
Minesite costs per tonne | | $ | 115 | | $ | 88 | | $ | 99 | | $ | 88 |
Production costs per ounce | | $ | 2,435 | | $ | 1,470 | | $ | 1,902 | | $ | 1,495 |
Total cash costs per ounce | | $ | 1,921 | | $ | 1,210 | | $ | 1,530 | | $ | 1,229 |
Gold production
Fourth Quarter of 2024 – At Pinos Altos, gold production decreased by 28.4% to 18,583 ounces in the fourth quarter of 2024, compared with 25,963 ounces in the fourth quarter of 2023, primarily due to lower gold grades expected under the mining sequence and lower throughput.
Year Ended 2024 – Gold production decreased by 9.4% to 88,433 ounces in the year ended 2024, compared with 97,642 ounces in the year ended 2023 at Pinos Altos, primarily due to lower gold grades expected under the mining sequence, partially offset by the higher throughput.
Production costs
Fourth Quarter of 2024 – Production costs at Pinos Altos were $45.3 million in the fourth quarter of 2024, an increase of 18.6% compared with production costs of $38.2 million in the fourth quarter of 2023, primarily due to the timing of inventory sales and higher underground development and maintenance costs, partially offset by the weakening of the Mexican peso relative to the US dollar between periods.
Production costs per tonne increased when compared to the prior-year period primarily due to the timing of inventory sales and higher underground development and maintenance costs and the lower mill throughput in the period. Production costs per ounce increased when compared to the prior-year period for the same reasons outlined above for production costs and fewer ounces of gold produced in the current period.
Year Ended 2024 – Production costs at Pinos Altos were $168.2 million in the year ended 2024, an increase of 15.3% compared with production costs of $145.9 million in the year ended 2023, primarily due to higher underground development and services costs, higher milling costs and a lower deferred stripping ratio.
Production costs per tonne increased when compared to the prior-year period primarily due to the same reasons outlined above for the higher production costs , partially offset by the higher volume of ore milled in the current period. Production costs per ounce increased when compared to the prior-year period due to the same reasons outlined above for the higher production costs and fewer ounces of gold produced in the period.
32
Minesite cost per tonne and total cash costs per ounce
Fourth Quarter of 2024 – Minesite costs per tonne increased when compared to the prior-year period due to the same reasons as the higher production costs per tonne, except for the timing of inventory sales. Total cash costs per ounce increased when compared to the prior-year period due to the same reasons as the higher production costs per ounce.
Year Ended 2024 – Minesite costs per tonne increased when compared to the prior-year period due to the same reasons as the higher production costs per tonne. Total cash costs per ounce increased when compared to the prior-year period due to the same reasons as the higher production costs per ounce.
La India
La India – Operating Statistics | | Three Months Ended | | Year Ended | ||||||||
| | December 31, | | December 31, | | December 31, | | December 31, | ||||
| | 2024 |
| 2023 |
| 2024 |
| 2023 | ||||
Tonnes of ore milled (thousands of tonnes) |
| | — |
| | 500 |
| | — |
| | 3,010 |
Tonnes of ore milled per day |
| | — |
| | 5,435 |
| | — |
| | 8,247 |
Gold grade (g/t) |
| | — |
| | 0.92 |
| | — |
| | 0.87 |
Gold production (ounces) |
| | 3,390 |
| | 19,481 |
| | 24,580 |
| | 75,904 |
Production costs per tonne |
| | — | | $ | 49 |
| | — | | $ | 32 |
Minesite costs per tonne |
| | — | | $ | 45 |
| | — | | $ | 32 |
Production costs per ounce | | $ | 3,045 | | $ | 1,254 | | $ | 2,025 | | $ | 1,271 |
Total cash costs per ounce | | $ | 1,835 | | $ | 1,149 | | $ | 1,945 | | $ | 1,241 |
Gold production
Fourth Quarter of 2024 – At La India, gold production decreased by 82.6% to 3,390 ounces in the fourth quarter of 2024, compared with 19,481 ounces in the fourth quarter of 2023, due to cessation of mining operations in the fourth quarter of 2023. Gold production in the fourth quarter of 2024 resulted only from residual leaching.
Year Ended 2024 – Gold production decreased by 67.6% to 24,580 ounces in the year ended 2024, compared with 75,904 ounces in the year ended 2023 for the same reasons outlined above for the fourth quarter of 2024.
Production costs
Fourth Quarter of 2024 – Production costs at La India were $10.3 million in the fourth quarter of 2024, a decrease of 57.8% compared with production costs of $24.4 million in the fourth quarter of 2023, driven primarily by the cessation of mining activities.
Production costs per ounce increased when compared to the prior-year period due to the same reasons outlined above and due to fewer ounces of gold produced in the period.
Year Ended 2024 – Production costs at La India were $49.8 million in the year ended 2024, a decrease of 48.4% compared with production costs of $96.5 million in the year ended 2023, driven primarily by the cessation of mining activities.
Production costs per ounce increased when compared to the prior-year period due to the same reasons outlined above and due to fewer ounces of gold produced in the period.
Minesite cost per tonne and total cash costs per ounce
Fourth Quarter of 2024 – Total cash costs per ounce increased when compared to the prior-year period primarily due to fewer ounces of gold produced in the period.
Year Ended 2024 – Total cash costs per ounce increased when compared to the prior-year period primarily due to fewer ounces of gold produced in the period.
33
Fourth Quarter 2024 vs. Fourth Quarter 2023
Revenues from mining operations, net of selling costs, increased by $467.1 million to $2,223.7 million in the fourth quarter of 2024 compared with $1,756.6 million in the fourth quarter of 2023, primarily due to a 34.2% increase in the average realized price of gold, partially offset by a decrease in gold sales volume between periods. The lower gold sales volume was driven by La India, Canadian Malartic and Detour Lake.
Production costs decreased by $30.6 million to $746.9 million in the fourth quarter of 2024 compared with production costs of $777.5 million in the fourth quarter of 2023, primarily due to the lower costs at Meadowbank and La India, partially offset by higher costs at Macassa.
Exploration and corporate development expenses increased by $6.8 million to $52.8 million in the fourth quarter of 2024 compared with $46.0 million in the fourth quarter of 2023, primarily due to higher expenses at Canadian Malartic.
Amortization of property, plant and mine development decreased by $7.8 million to $388.2 million in the fourth quarter of 2024 compared with $380.4 million in the fourth quarter of 2023 primarily due to higher expenses at Detour Lake partially offset by lower expenses at Canadian Malartic and Meadowbank.
Net income of $509.3 million was recorded in the fourth quarter of 2024 after income and mining taxes expense of $273.3 million compared with a net loss of $374.1 million in the fourth quarter of 2023 after income and mining taxes expense of $61.1 million. The increase in net income was primarily due a 34.2% increase in the average realized price of gold between periods and an after tax impairment loss of $667.4 million charged against Macassa and Pinos Altos in the fourth quarter of 2023 with no comparative in 2024.
Cash provided by operating activities increased by $404.0 million to $1,131.8 million in the fourth quarter of 2024 compared with $727.9 million in the fourth quarter of 2023. The increase in cash provided by operating activities is primarily due to higher operating margin and favourable working capital movements.
Fourth Quarter 2024 vs. Third Quarter 2024
Revenues from mining operations, net of selling costs, increased by $68.1 million to $2,223.7 million in the fourth quarter of 2024 compared with $2,155.6 million in the third quarter of 2024, primarily due to a 6.7% higher average realized price of gold, partially offset by a 3.6% decrease in the sales volume of gold between periods at Fosterville, Meadowbank and Kittila, partially offset by higher sales volumes at Macassa and Meliadine.
Production costs decreased by $36.8 million to $746.9 million in the fourth quarter of 2024 compared with production costs of $783.7 million in the third quarter of 2024, primarily due to lower production costs at LaRonde, Fosterville and Kittila, partially offset by higher production costs at Meliadine and Macassa.
Exploration and corporate development expenses decreased by $7.5 million to $52.8 million in the fourth quarter of 2024 compared with $60.3 million in the third quarter of 2024. The decrease in exploration and corporate development expenses between periods is primarily due to lower exploration expenses at regional areas of Meliadine and Hope Bay.
Amortization of property, plant and mine development decreased by $2.0 million to $388.2 million in the fourth quarter of 2024 compared with amortization of property, plant and mine development of $390.2 million in the third quarter of 2024, primarily due to lower expenses at Fosterville and Kittila, partially offset by higher expenses at Meliadine and Canadian Malartic.
Net income of $509.3 million was recorded in the fourth quarter of 2024 after income and mining taxes expense of $273.3 million compared with net income of $567.1 million in the third quarter of 2024 after income and mining taxes expense of $272.7 million. The decrease in net income was primarily due to unfavourable movements on the Company’s financial derivative instruments between periods.
Cash provided by operating activities increased by $47.3 million to $1,131.8 million in the fourth quarter of 2024 compared with $1,084.5 million in the third quarter of 2024 primarily due to higher operating margin between periods.
For the Company’s detailed 2024 and 2023 quarterly financial and operating results see “Summarized Quarterly Data” in this MD&A.
34
The following section contains ‘‘forward-looking statements’’ and ‘‘forward-looking information’’ within the meaning of applicable securities laws. See “Note to Investors Concerning Forward-Looking Information” in this MD&A for a discussion of assumptions and risks relating to such statements.
2024 Results Comparison to 2024 Outlook
Gold Production and Costs
Payable gold production for the full year 2024 was 3,485,336 ounces, above the midpoint of the previous guidance range of 3,350,000 and 3,550,000 ounces. Total cash costs per ounce on a by-product basis for the full year 2024 was $903, essentially at the midpoint of the previous guidance range of approximately $875 to $925.
Capital Expenditures and All-In Sustaining Costs per Ounce
Total capital expenditures (including sustaining capital) for the full year 2024 were $1,841.0 million, compared to the previous guidance range of $1,705.0 million to $1,885.0 million, which included capitalized exploration.
All-in sustaining costs per ounce on a by-product basis for the full year 2024 were $1,239, which was within the previous guidance range of approximately $1,200 to $1,250.
Exploration and Corporate Development Expense
Previous guidance for exploration and corporate development expense was $271.4 million, updated from the original $230.0 million. Exploration and corporate development expense for the full year 2024 was $219.6 million, $51.8 million lower than the updated previous guidance, due to lower than anticipated corporate development expense and lower drilling unit costs than expected.
Amortization of Property, Plant and Mine Development
Amortization of property, plant and mine development expense for the full year 2024 was $1,514.1 million, which was lower than the previous guidance range of approximately $1.56 to $1.61 billion primarily due to lower expenses at Canadian Malartic.
General and Administrative Expense
General and administrative expenses for the full year 2024 were $207.5 million which was higher than the range in previous guidance of approximately $175 to $195 million, primarily due to non-cash revaluation of stock-based compensation due to an increase in the Company’s share price during 2024.
2025 to 2026 Outlook Production Update
Payable gold production is forecasted to be between 3.3 to 3.5 million ounces in 2025, 2026 and 2027, compared to prior production forecast of 3.35 to 3.55 million ounces in 2025 and 3.40 and 3.60 million ounces in 2026, and its updated to include 2027.
The slight decrease in gold production forecast for 2025 compared to the previous guidance is primarily due to a reduced mining rate at Pinos Altos to accommodate more challenging ground conditions at Santo Nino and increased ore sourcing from satellite deposits and a deferral of the restart of pre-crushing lower grade ore at Canadian Malartic allowing for a slower ramp-up of in-pit tailings disposal.
The slight decrease in gold production in 2026 compared to the previous guidance reflects primarily the reduced mining rate at Pinos Altos, and an adjustment to the mining sequence at LaRonde, resulting in increased sourcing from the shallower, lower grade zones combined with a slower mining rate at the deep mine.
35
LaRonde
In 2024, LaRonde produced 306,750 ounces of gold at total cash costs per ounce of $945. In 2025, the Company expects production at LaRonde to be between 300,000 and 320,000 ounces at total cash costs per ounce of approximately $978.
The LaRonde mine consists of the East and West mines. The mining at both mines extends below three kilometres from surface where the in-situ stress contributes to influence the ground conditions surrounding the excavations. Seismicity is a significant aspect of the operation and a team of rock mechanics experts has been engaged to attempt to manage the seismic related challenges. The Company’s objective remains to address the seismic risk by continuously improving mitigation measures to keep a safe work environment while maintaining reasonable production rates. These mitigation measures include non-entry protocols, dynamic ground support and, increasingly, remote operation from surface.
The mining sequence is also designed to attempt to push the stress away from the orebody to reduce the seismic risk. For the lower levels at the LaRonde mine, the transverse open stoping method, combined with a primary-secondary stope mining sequence, is almost exclusively used to address the deep and high stress conditions. In the primary-secondary stope mining sequence, primary stopes are mined out first and backfilled with pastefill, leaving secondary stopes as temporary pillars. Secondary stopes are mined once the pastefill in the primary stopes has cured. Secondary stopes are backfilled with waste rock or pastefill.
With the deepening of the mine, the Company has changed the mining sequence in the East mine attempting to reduce the stress levels on the secondary stopes, reduce seismic risk and promote sustainability of the operation in the long run. At the LaRonde mine, longitudinal and transverse longhole open stoping are the main mining methods used for the extraction of the orebody. In 2023, the LaRonde mine transitioned to “pillarless” mining and an adjusted development plan to manage seismicity within the mine, resulting in a lower mining rate when compared to the prior year. In addition, the design of the ramp in the East mine has been adjusted to be further away from the geological structures. Pillarless mining, combined with an adjusted development plan, results in a longer cycle time to extract stopes, resulting in a reduced mining rate.
The Company completed the planned overhaul of the leach tanks in the LZ5 processing facility that was in care and maintenance until the second half of 2024, under the current plans, ore from the AK deposit at Macassa will be processed at the LZ5 facility starting in the fourth quarter of 2025.
The Company has integrated new sources of ore to the LaRonde production profile, including the Fringe, Dumagami and 11-3 zones, and has adjusted the mining rate in the deep mine. These new zones enhance mine production flexibility, which helps manage the effects of seismicity at depth.
Canadian Malartic
In 2024, Canadian Malartic produced 655,654 ounces of gold at total cash costs per ounce of $930. In 2025, the Company expects production at Canadian Malartic to be between 575,000 and 605,000 ounces at total cash costs per ounce of approximately $995.
Production in 2025 is expected to continue to be sourced from the Barnat pit and the Odyssey underground mine.
The Odyssey mine construction continued to advance on schedule. The design mining rate of 3,500 tonnes per day (“tpd”) was reached in October 2023 at Odyssey South and sustained through 2024. In the fourth quarter of 2024 the rate was 3,608 tpd.
Advancing the main ramp remains the development priority for the Odyssey project. Shaft sinking activities continued to ramp-up through the fourth quarter of 2024 and the Company still expects to complete excavation of the shaft in 2027.
Surface construction progressed as planned during 2024. The service hoist is expected to be operational to a temporary loading station at Level 102 (1,050 metres below surface) by 2025. The engineering work for the second phase of the paste plant has been initiated. In the second phase, which is expected to be completed in 2027, the paste backfill plant will be expanded to a capacity of approximately 20,000 tpd from the current 4,000 tpd.
36
During 2025, production is expected to be sourced from the Barnat pit with increasing quantities of ore from the Odyssey mine over the year and low grade stockpiles. The Odyssey mine is expected to contribute approximately 85,000 ounces of gold to Canadian Malartic production in 2025.
Goldex
In 2024, Goldex produced 130,813 ounces of gold at cash costs per ounce of $923. In 2025, the Company expects to produce between 125,000 and 135,000 ounces of gold at Goldex at cash costs per ounce of $971.
Goldex had solid operational performance throughout the year with record annual throughput during 2024.
The Akasaba West mine achieved commercial production as planned in February 2024 and contributed approximately 1,500 tpd to throughput at the mill and expects to in increase this rate to 1,750 tpd and 12,000 ounces of gold in 2025.
Meliadine
In 2024, Meliadine produced 378,886 ounces of gold at total cash costs per ounce of $940. In 2025, the Company expects production at Meliadine to be between 375,000 and 395,000 ounces at total cash costs per ounce of approximately $936.
The waterline installation is underway with commissioning expected in 2025, allowing for utilization in the summer of 2025.
The Meliadine Phase 2 expansion is progressing as planned and mill throughput of 6,000 tpd was achieved in December 2024. Under current plans, the throughput is expected to increase to 6,250 tpd in 2025.
During the first quarter of 2024, the Company submitted a proposal to the Nunavut Water Board to amend the current Type A Water license to include tailings, water and waste management infrastructure at the Pump, F-zone, Wesmeg and Discovery deposits. The Company received the water license in December 2024 and issued an 60-day notice to initiate mining.
Meadowbank
In 2024, Meadowbank produced 504,719 ounces of gold at total cash costs per ounce of $938. In 2025, the Company expects production at Meadowbank to be between 485,000 and 505,000 ounces at total cash costs per ounce of approximately $1,022.
Despite the delays related to an extended caribou migration and excessive rainfall, the open pit operation continued to deliver solid performance during the fourth quarter of 2024. The Company continues to account for the caribou migration in its production plan as this migration can affect the ability to move materials on the roads between Amaruq and the Meadowbank minesite and between the Meadowbank minesite and Baker Lake.
The Company expects that Amaruq underground will contribute approximately 160,000 ounces of gold to Meadowbank’s production in 2025.
Kittila
In 2024, Kittila produced 218,860 ounces of gold at cash costs per ounce of $1,031. In 2025, the Company expects to produce between 220,000 to 240,000 ounces of gold at Kittila at cash costs per ounce of $1,020.
At the mine, the production hoist ramp up was completed in December 2023, and 100% of ore hoisted through the shaft since the ramp up completion.
Several initiatives in improving recoveries are planned for 2025, including autoclave and carbon circuits optimization.
Detour Lake
In 2024, Detour Lake produced 671,950 ounces of gold at cash costs per ounce of $796. In 2025, the Company expects production at Detour Lake to be between 705,000 and 735,000 ounces at total cash costs per ounce of approximately $775.
37
Mill performance during the fourth quarter of 2024 was a record 77,022 tpd, equivalent to an annualized mill throughput of 28 Mtpa, as expected under the mill optimization project, which rate is expected to be sustained during 2025.
Assembly and the commissioning of the new Komatsu rope shovel was completed in the third quarter of 2024. The new rope shovel is expected to add increased capacity required under the life of mine plan, replacing a diesel shovel of lower capacity.
An upgrade of the 230kV main substation commenced in 2024 to improve the power quality at the mine, this upgrade is expected to improve the site readiness for future power expansion for potential projects such as the trolley assist mine haulage system. Commissioning of the project is expected for the fourth quarter of 2025.
Macassa
In 2024, Macassa produced 279,384 ounces of gold at cash costs per ounce of $748. In 2025, the Company expects production at Macassa to be between 300,000 and 320,000 ounces at total cash costs per ounce of approximately $760.
Construction of the new paste plant is on schedule for commissioning in the first half of 2025
The Amalgamated Kirkland (“AK”) deposit has been added to the mining profile starting 2024, the Company initially planned to start trucking ore from AK to the LZ5 processing facility in the fourth quarter of 2024. Due to delays in the necessary modifications at the LZ5 processing facility to accommodate the AK ore, the Company now expects to begin processing the AK ore at the LZ5 mill in the fourth quarter of 2025. Production from the AK deposit is forecast to be approximately 10,000 ounces of gold in 2025.
Fosterville
In 2024, Fosterville produced 225,203 ounces of gold at cash costs per ounce of $647. In 2025, the Company expects production at Fosterville to be between 140,000 and 160,000 ounces at total cash costs per ounce of approximately $1,015.
Production profile has been negatively affected by grade reconciliation in the remaining portions of the high grade Swan zone and the depletion of the zone, with a shift in focus to increase the mining rates to aiming to partially offset the lower average grade in 2024 onwards.
The Company progressed with the upgrade of the primary ventilation system to sustain the mining rate in the Lower Phoenix zones in future years and expects the project to be completed in the first half of 2025.
During 2024, the Company continued to give priority to the key underground development in Robbins Hill and Cygnet, which are now in production and will provide production alternatives for 2025.
In 2024, Fosterville successfully replaced mining depletion through continued exploration success in the Robbins Hill and Lower Phoenix areas and improved mining parameters.
Gold production in the fourth quarter of 2024 was affected by a 3.4 Mw (Moment Magnitude) seismic event in November 2024, which caused damage to the underground infrastructure in the Lower Phoenix area. Rehabilitation work is ongoing and a phased approach has been adopted to resume development and production, which is expected to be completed in the first quarter of 2025. The Company continues to adjust the mining methods, ground support and protocols to address seismic activity in the deeper portions of the mine.
With the commencement of operations in Robbins Hill and the site operational improvements, the mining and milling rate is forecast to increase by approximately 6% in 2025, partially offsetting the lower average gold grade of approximately 5.80 g/t.
Pinos Altos
In 2024, Pinos Altos produced 88,433 ounces of gold at total cash costs per ounce of $1,530. In 2025, the Company expects production at Pinos Altos to be between 75,000 and 85,000 ounces at total cash costs per ounce of approximately $1,717.
The Company concluded the activities at the Reyna del Plata pit in the fourth quarter of 2024 and initiated production activities at the underground Cubiro deposit. In 2025 production will be mainly sourced from Cubiro and Sinter underground deposits.
38
La India
In 2024, La India produced 24,580 ounces of gold at total cash costs per ounce of $1,945.
Revenue from Mining Operations and Production Costs
In 2025, the Company expects to continue to generate solid cash flow with payable production of approximately 3,300,000 to 3,500,000 ounces of gold which is comparable with 3,485,336 ounces in 2024.
The table below sets out expected payable production in 2025 and actual payable production in 2024:
|
| 2025 |
| 2024 |
| | Forecast | | Actual |
Gold (ounces) |
| 3,400,000 |
| 3,485,336 |
Silver (thousands of ounces) |
| 2,299 |
| 2,485 |
In 2025, the Company expects total cash costs per ounce on a by-product basis to be between $915 and $965. As production costs at LaRonde, Canadian Malartic, Goldex, Detour Lake, Macassa, Meliadine and Meadowbank mines are incurred primarily in Canadian dollars, production costs at Fosterville are incurred primarily in Australian dollars, production costs at Kittila are incurred primarily in Euros, and a portion of the production costs at Pinos Altos are incurred in Mexican pesos, the US dollar/Canadian dollar, US dollar/Australian dollar, US dollar/Euro, and US dollar/Mexican peso exchange rates also affect the Company’s expectations for the total cash costs per ounce both on a by-product and co-product basis.
The table below sets out the diesel price and exchange rate assumptions used in deriving the expected 2025 total cash costs per ounce on a by-product basis (forecast production for each metal is shown in the table above) as well as the actual market average closing prices for each variable for the period of January 1, 2025 through January 31, 2025:
|
| | |
| Actual | |
| | | | | Market Average | |
| | 2025 | | (January 1, 2025 - | ||
| | Assumptions | | January 31, 2025) | ||
Diesel ($per litre) | | $ | 0.78 | | $ | 0.65 |
C$/US$exchange rate (C$) | | $ | 1.38 | | $ | 1.44 |
US$/Euro exchange rate (Euros) | | € | 1.08 | | € | 1.04 |
A$/US$ exchange rate (A$) | | $ | 1.50 | | $ | 1.61 |
See Risk Profile - Commodity Prices and Foreign Currencies in this MD&A for the expected impact on forecast 2025 total cash costs per ounce on a by-product basis of certain changes in commodity prices and exchange rate assumptions.
Exploration and Corporate Development Expenditures
In 2025, Agnico Eagle expects to incur exploration and corporate development expenses of between $215.0 million and $235.0 million compared with $219.6 million in 2024.
The Company’s objective is to build on recent exploration success and identify additional mineral resources and convert mineral resources into mineral reserves. This is part of the strategy to develop the full potential of existing operations and key projects in the Company’s pipeline.
The Company’s exploration focus remains on extending mine life at existing operations, testing near-mine opportunities and advancing key value driver projects. Exploration priorities for 2025 include mineral resource conversion and expansion at Detour Lake’s underground project and the East Gouldie zone in Canadian Malartic, and exploration targets at Hope Bay.
Amortization of Property, Plant and Mine Development
Amortization of property, plant and mine development expense is expected to be between $1.55 and $1.75 billion in 2025 compared with $1.51 billion in 2024.
39
Other Expenses
General and administrative expenses are expected to be between $190.0 million and $210.0 million in 2025 compared with $207.5 million in 2024, including share-based compensation, which is expected to be between $55.0 million and $65.0 million. In 2025, the Company expects to incur additional expenses ranging between $105.0 million and $115.0 million, which includes $82.0 million to $85.0 million related to site maintenance costs primarily at Hope Bay in Canada, La India in Mexico and Northern Territory in Australia and $23.0 million to $30.0 million related to remediation expenses and other miscellaneous costs.
Tax Rates
For 2025, the Company expects its effective tax rates to be between 35% to 40% in Canada, 35% to 40% in Mexico, 30% in Australia and 20% in Finland. The Company’s overall effective tax rate is expected to be approximately 33% to 38% for the full year 2025.
Capital Expenditures
Capital expenditures, including sustaining capital, construction and development costs and capitalized exploration costs, are expected to total approximately $2,150 million in 2025. The Company expects to fund its 2025 capital expenditures through operating cash flow from the sale of its gold production and the associated by-product metals. Significant components of the expected 2025 capital expenditures program include the following:
| ● | $894.6 million in sustaining capital expenditures relating to Detour Lake ($205.0 million), Canadian Malartic ($140.1 million), Meadowbank ($90.8 million), Kittila ($63.5 million), LaRonde ($116.2 million), Meliadine ($86.7 million), Macassa ($44.1 million), Goldex ($47.4 million), Fosterville ($63.6 million), Pinos Altos ($27.1 million) and other regional areas ($10.1 million); |
| ● | $1,255.4 million in development capital expenditures(i) relating to Detour Lake ($252.9 million), Detour Lake underground project ($70.7 million), Canadian Malartic ($310.0 million), Macassa ($137.8 million), Meliadine ($86.5 million), LaRonde ($59.5 million), Fosterville ($36.1 million), Pinos Altos ($12.3 million), Goldex ($14.4 million), Kittila ($7.7 million), and other projects, including Hope Bay ($131.4 million) and Upper Beaver ($97.4 million) and San Nicolás ($22.9 million); |
| ● | Capitalized exploration expenditure, included in the figures above, are expected to be $300.0 million in 2025. |
The Company continues to examine other possible corporate development opportunities which may result in the acquisition of companies or assets using the Company’s securities, cash or a combination thereof. If cash is used to fund acquisitions, Agnico Eagle may be required to issue debt or securities to satisfy cash payment requirements.
All-in Sustaining Costs per Ounce of Gold Produced
Agnico Eagle’s all-in sustaining costs per ounce of gold produced on a by-product basis are expected to be approximately $1,250 to $1,300 in 2025 compared with $1,239 in 2024.
The Company is subject to significant risks due to the inherent nature of the business of exploration, development and mining of properties with precious metals. The risks described below are not the only ones facing the Company. The risk factors below may include details of how the Company seeks to mitigate these risks where possible. For a more comprehensive discussion of these inherent risks, see “Risk Factors” in the Company’s most recent AIF on file with the Canadian provincial securities regulatory authorities and included in the Company’s most recent Form 40-F on file with the SEC, respectively.
The Company’s principal financial liabilities are comprised of accounts payable and accrued liabilities, long-term debt and derivative financial instruments. The Company uses these financial instruments to manage its cash flows which are used to support ongoing operations and future growth.
40
The Company’s principal financial assets are comprised of cash and cash equivalents, trade receivables, equity securities and derivative financial instruments, including share purchase warrants. Cash and cash equivalents and trade receivables are generated by the Company’s operations. Equity securities and share purchase warrants are generally strategic investments made in other mining companies.
Using financial instruments exposes the Company to a variety of financial risks: credit risk, liquidity risk and market risk (including interest rate risk, commodity price risk and foreign currency risk, as discussed below).
Credit risk is the risk that the counterparties to financial contracts will fail to perform on an obligation to the Company. Credit risk is partially mitigated by dealing with what the Company believes to be high quality counterparties such as major banks and limiting concentration risk.
Liquidity risk is the risk that the Company will encounter difficulty in meeting obligations associated with financial liabilities that are settled by delivering cash or another financial asset. The Company attempts to mitigate liquidity risk primarily by monitoring its debt rating and the maturity dates of existing debt and other payables.
Note:
| (i) | Development capital expenditures is a non-GAAP measure that is not a standardized financial measure under IFRS. For a reconciliation to total capital expenditures and a discussion of the composition and usefulness of this non-GAAP measure, see “Non-GAAP Financial Performance Measures” below. |
Market risk is the risk that changes in market factors, such as interest rates, commodity prices and foreign exchange rates, will affect the value of Agnico Eagle’s financial instruments.
The following table sets out a summary of the Company’s financial instruments(i) as at December 31, 2024:
Financial Instrument |
| Carrying Value |
| Associated Risks | |
Cash and cash equivalents |
| $ | 926,431 |
| Credit, Market |
Short-term investments |
| $ | 7,306 |
| Credit, Market |
Loans receivable |
| $ | 12,039 |
| Credit, Market |
Equity securities |
| $ | 559,165 |
| Liquidity, Market |
Share purchase warrants |
| $ | 53,724 |
| Liquidity, Market |
Fair value of derivative financial instruments |
| $ | 1,348 |
| Credit, Market |
Accounts payable and accrued liabilities |
| $ | (817,649) |
| Liquidity, Market |
Fair value of derivative financial instruments |
| $ | (100,182) |
| Liquidity, Market |
Long-term debt |
| $ | (1,142,956) |
| Liquidity, Market |
Lease obligations |
| $ | (139,226) |
| Liquidity, Market |
Note:
| (i) | See Note 6 and Note 20 in the consolidated annual financial statements for details on the Company’s financial instruments, fair value measurements and financial risk management. |
The Company’s current exposure to market risk for changes in interest rates relates primarily to drawdowns on its credit facilities, Term Loan Facility, its cash and cash equivalents and its short-term investments. Drawdowns on the credit facilities are used primarily to fund a portion of the capital expenditures related to the Company’s development projects and working capital requirements. As at December 31, 2024, there were no amounts outstanding on the Company’s New Credit Facility. As at December 31, 2024, the Company’s Term Loan Facility was fully repaid. In addition, the Company invests its cash in investments with short maturities or with frequent interest reset terms and a credit rating of R-1 or better. As a result, the Company’s interest income fluctuates with short-term market conditions. As at December 31, 2024, short-term investments were $7.3 million.
Amounts drawn under the New Credit Facility and Term Loan Facility are subject to floating interest rates based on SOFR and CORRA benchmark rates. In the past, the Company has entered into derivative instruments to hedge against unfavourable changes in interest rates. The Company monitors its interest rate exposure and may enter into such agreements to manage its exposure to fluctuating interest rates.
41
Commodity Prices and Foreign Currencies
Agnico Eagle’s net income is sensitive to metal prices and the US dollar/Canadian dollar, US dollar/Australian dollar, US dollar/Euro and US dollar/Mexican peso exchange rates.
Changes in the market price of gold may be attributed to numerous factors such as demand, global mine production levels, central bank purchases and sales and investor sentiment. Changes in the market prices of other metals may be attributed to factors such as demand and global mine production levels. Changes in the market price of diesel may be attributed to factors such as supply and demand. Changes in exchange rates may be attributed to factors such as supply and demand for currencies and economic conditions in each country or currency area. In 2024, the ranges of metal prices, diesel prices and exchange rates were as follows:
| ● | Gold: $1,985 – $2,778 per ounce, averaging $2,386 per ounce; |
| ● | Silver: $22.09 – $34.51 per ounce, averaging $28.27 per ounce; |
| ● | Diesel: $0.54 – $0.79 per litre, averaging $0.64 per litre; |
| ● | US dollar/Canadian dollar: C$1.33 – C$1.44 per $1.00, averaging C$1.37 per $1.00; |
| ● | US dollar/Australian dollar: A$1.44 – A$1.61 per $1.00, averaging A$1.52 per $1.00; |
| ● | US dollar/Euro: €0.89 – €0.96 per $1.00, averaging €0.92 per $1.00; and |
| ● | US dollar/Mexican peso: 16.34 – 20.72 Mexican pesos per $1.00, averaging 18.30 Mexican pesos per $1.00. |
To attempt to mitigate the impact of fluctuating by-product metal prices, the Company occasionally enters into derivative financial instrument contracts under its Board-approved Risk Management Policies and Procedures. The Company has a long-standing policy of no forward gold sales. However, the Risk Management Policies and Procedures does allow the Company to use other hedging strategies where appropriate to mitigate foreign exchange and by-product metal pricing risks. The Company occasionally buys put options, enters into price collars and enters into forward contracts to protect minimum by-product metal prices while maintaining full exposure to the price of gold. The Risk Management Committee has approved the strategy of using short-term call options in an attempt to enhance realized by-product metal prices. The Company’s policy does not allow speculative trading.
The Company receives payment for all of its metal sales in US dollars and pays most of its operating and capital costs in Canadian dollars, Australian dollars, Euros, or Mexican pesos. This gives rise to significant currency risk exposure. The Company enters into currency hedging transactions under its Board-approved Foreign Exchange Risk Management Policies and Procedures to hedge part of its foreign currency exposure. The policy does not permit the hedging of translation exposure (that is, the gains and losses that arise from the accounting translation into US dollars of assets and liabilities denominated in other currencies), as it does not give rise to cash exposure. The Company’s foreign currency derivative financial instrument strategy includes the use of purchased puts, written calls, collars and forwards that are not held for speculative purposes. As at December 31, 2024, there were foreign exchange derivatives outstanding related to $4,006.5 million of 2025 and 2026 expenditures (December 31, 2023 - $3,324.7 million). During the year ended December 31, 2024 the Company recognized a loss of $174.2 million on foreign exchange derivatives in the loss (gain) on derivative financial instruments line item of the consolidated statements of income (2023 - gain of $80.3 million).
The Company considers, and may enter into, risk management strategies to mitigate price risk on certain consumables, including diesel fuel. These strategies may include longer term purchasing contracts and financial and derivative instruments. As at December 31, 2024, there were derivative financial instruments outstanding relating to 28.0 million gallons of heating oil (December 31, 2023 - 15.0 million). During the year ended December 31, 2024 the Company recognized a loss of $3.7 million on heating oil derivatives in the loss (gain) on derivative financial instruments line item of the consolidated statements of income (2023 - loss of $0.9 million).
42
Detour Lake, Canadian Malartic and Meadowbank were the Company’s most significant contributors in 2024 to the Company’s payable production of gold at 19.3%, 18.8% and 14.5%, respectively, and are expected to account for a significant portion of the Company’s payable production of gold in the future.
Mining is a complex and unpredictable business and, therefore, actual payable production of gold ounces may differ from expectations. Adverse conditions affecting mining or milling may have a material adverse impact on the Company’s financial performance and results of operations. The Company anticipates using revenue generated by its operations to finance the capital expenditures required at its mine projects.
The Company’s mining and mineral processing operations, exploration activities and properties are subject to the laws and regulations of federal, provincial, state and local governments in the jurisdictions in which the Company operates. These laws and regulations are extensive and govern prospecting, exploration, development, production, exports, taxes, labour standards, occupational health and safety, waste disposal, tailings management, toxic substances, environmental protection, greenhouse gases, mine safety, reporting of payments to governments and other matters. Compliance with such laws and regulations increases the costs of planning, designing, drilling, developing, constructing, operating, managing, closing, reclaiming and rehabilitating mines and other facilities. New laws or regulations, amendments to current laws and regulations governing operations and activities on mining properties or more stringent implementation or interpretation thereof could have a material adverse effect on the Company, increase costs, cause a reduction in levels of production and delay or prevent the development of new mining properties. Regulatory enforcement, in the form of compliance or infraction notices, has occurred at some of the Company’s mines and, while the current risks related to such enforcement are not expected to be material, the risk of material fines or corrective action cannot be ruled out in the future.
The Company’s management is responsible for establishing and maintaining adequate internal control over financial reporting (‘‘ICFR’’) and disclosure controls and procedures (‘‘DC&P’’).
ICFR is a framework designed to provide reasonable assurance regarding the reliability of financial reporting and the preparation of financial statements for external purposes in accordance with IFRS. Management has used the Internal Control – Integrated Framework issued by the Committee of Sponsoring Organizations of the Treadway Commission (2013 framework) in order to assess the effectiveness of the Company’s ICFR.
DC&P form a broader framework designed to provide reasonable assurance that information required to be disclosed by the Company in its annual and interim filings and other reports filed under securities legislation is recorded, processed, summarized and reported within the time frame specified in securities legislation and includes controls and procedures designed to ensure that information required to be disclosed by the Company in its annual and interim filings and other reports submitted under securities legislation is accumulated and communicated to the Company’s management to allow timely decisions regarding required disclosure.
Together, the ICFR and DC&P frameworks provide internal control over financial reporting and disclosure. The Company maintains disclosure controls and procedures that are designed to provide reasonable assurance that information which is required to be disclosed in the Company’s annual and interim filings and other reports filed under securities legislation is accumulated and communicated in a timely fashion. Due to their inherent limitations, the Company acknowledges that, no matter how well designed, ICFR and DC&P can provide only reasonable assurance of achieving the desired control objectives and as such may not prevent or detect all misstatements. Further, the effectiveness of ICFR is subject to the risk that controls may become inadequate because of changes in conditions or that the degree of compliance with policies or procedures may change.
There have been no material changes in our internal controls during the year ended December 31, 2024 that have materially affected, or are reasonably likely to materially affect, internal control over financial reporting.
The Company’s management, under the supervision of the Company’s Chief Executive Officer and Chief Financial Officer, has evaluated the effectiveness of its ICFR and DC&P as at December 31, 2024. Based on this evaluation, management concluded that the Company’s ICFR and DC&P were effective as at December 31, 2024.
43
The following table sets out the maximum number of common shares that would be outstanding if all dilutive instruments outstanding at January 31, 2025 were exercised:
Common shares outstanding |
| 502,936,915 |
Employee stock options |
| 2,497,933 |
Common shares held in a trust in connection with the Restricted Share Unit plan, Performance Share Unit plan and Long Term Incentive Plan |
| 754,087 |
Total |
| 506,188,935 |
Critical IFRS Accounting Policies and Accounting Estimates
The Company’s consolidated financial statements are prepared in accordance with International Financial Reporting Standards (‘‘IFRS’’) as issued by the International Accounting Standards Board. Agnico Eagle’s material accounting policies including a summary of current and future changes in accounting policies are disclosed in Note 3 in the consolidated financial statements.
The preparation of the consolidated financial statements in accordance with IFRS requires management to make estimates and judgments that affect the reported amounts of assets, liabilities, revenues and expenses. Critical accounting estimates have a reasonable likelihood that materially different amounts could be reported under different conditions or using different assumptions. In making judgments about the carrying value of assets and liabilities, the Company uses estimates based on historical experience and assumptions that are considered reasonable in the circumstances. Although the Company evaluates its accounting estimates on an ongoing basis using the most current information available, actual results may differ from these estimates. The critical judgments and key sources of estimation uncertainties in the application of accounting policies during the year ended December 31, 2024 are disclosed in Note 4 to the consolidated financial statements.
Management has discussed the development and selection of critical accounting policies and estimates with the Audit Committee which has reviewed the Company’s disclosure included or incorporated by reference in this MD&A.
The scientific and technical information contained in this MD&A relating to Nunavut, Quebec and Finland operations has been approved by Dominique Girard, Eng., Executive Vice-President & Chief Operating Officer – Nunavut, Quebec & Europe; relating to Ontario, Australia and Mexico operations has been approved by Natasha Vaz, P.Eng., Executive Vice-President & Chief Operating Officer – Ontario, Australia & Mexico; relating to exploration has been approved by Guy Gosselin, Eng. and P.Geo., Executive Vice-President, Exploration; and relating to mineral reserves and mineral resources has been approved by Dyane Duquette, P.Geo., Vice-President, Mineral Resources Management, each of whom is a “Qualified Person” for the purposes of NI 43-101.
The assumptions used for the mineral reserve estimates at all mines and advanced projects held by Agnico Eagle on December 31, 2024 are $1,450 per ounce of gold and $20.00 per ounce of silver as at December 31, 2024, except for $1,400 per ounce of gold used for the Detour Lake open pit,$1,350 per ounce of gold for the Hope Bay and Hammond Reef; $1,650 per ounce of gold used for Wasamac and Amaruq; $1,800 per ounce of gold and $24.00 per ounce of silver used for Pinos Altos; and US$1,300 per ounce of gold, US$20.00 per ounce of silver, US$3.00 per pound of copper and US$1.10 per pound of zinc used for San Nicolás. Foreign exchange rates assumptions of C$1.34 per US$1.00, A$1.45 per US$1.00, €0.91 per US$1.00, and 18.00 Mexican pesos per US$1.00 were used for all mines and projects, except for C$1.25 per US$1.00 used for Upper Canada, the Holt complex and Detour Zone 58N; C$1.30 per US$1.00 used for Detour Lake open pit, Detour lake underground, Hammond Reef and Hope Bay.
44
The following table sets out the proven and probable gold mineral reserves for properties held by Agnico Eagle as of December 31, 2024:
|
| |
| Gold Grade |
| Contained |
| | | | (Grams per | | Gold |
Proven and Probable Mineral Reserves by Property(i)(ii) | | Tonnes | | Tonne) | | (Ounces)(iii) |
| | (thousands) | | | | (thousands) |
Proven Mineral Reserves | | | | | | |
LaRonde mine |
| 2,398 |
| 4.84 |
| 373 |
LZ5 | | 5,026 | | 2.10 | | 339 |
LaRonde |
| 7,424 |
| 2.98 |
| 712 |
Canadian Malartic |
| 40,419 |
| 0.52 |
| 680 |
Goldex mine |
| 5,472 |
| 1.43 |
| 251 |
Akasaba West | | 846 | | 0.82 | | 22 |
Goldex | | 6,318 | | 1.34 | | 273 |
Detour Lake |
| 128,454 |
| 0.81 |
| 3,333 |
Macassa |
| 352 |
| 12.65 |
| 143 |
Meadowbank |
| 3,355 |
| 1.86 |
| 200 |
Meliadine |
| 1,990 |
| 6.37 |
| 407 |
Hope Bay |
| 93 |
| 6.77 |
| 20 |
Fosterville |
| 888 |
| 5.77 |
| 165 |
Kittila |
| 616 |
| 4.33 |
| 86 |
Pinos Altos |
| 1,484 |
| 2.09 |
| 100 |
San Nicolás(50%) |
| 23,858 |
| 0.41 |
| 314 |
Total Proven Mineral Reserves |
| 215,249 |
| 0.93 |
| 6,433 |
Probable Mineral Reserves |
| |
| |
| |
LaRonde mine |
| 8,334 |
| 6.38 |
| 1,709 |
LZ5 | | 4,241 | | 2.34 | | 319 |
LaRonde |
| 12,574 |
| 5.02 |
| 2,028 |
Canadian Malartic |
| 87,128 |
| 2.43 |
| 6,818 |
Goldex mine |
| 10,137 |
| 1.65 |
| 538 |
Akasaba West |
| 3,948 |
| 0.91 |
| 116 |
Goldex | | 14,085 | | 1.44 | | 654 |
Detour Lake |
| 666,651 |
| 0.73 |
| 15,718 |
Macassa |
| 6,675 |
| 9.00 |
| 1,931 |
Wasamac | | 14,757 | | 2.90 | | 1,377 |
Upper Beaver |
| 23,181 |
| 3.71 |
| 2,768 |
Hammond Reef | | 123,473 | | 0.84 | | 3,323 |
Meadowbank | | 11,516 | | 3.80 | | 1,408 |
Meliadine | | 17,798 | | 5.17 | | 2,958 |
Hope Bay project | | 16,120 | | 6.52 | | 3,378 |
Fosterville | | 8,666 | | 5.33 | | 1,486 |
Kittila | | 24,782 | | 4.16 | | 3,314 |
Pinos Altos | | 5,472 | | 1.90 | | 334 |
San Nicolás (50%) | | 28,761 | | 0.39 | | 358 |
Total Probable Mineral Reserves |
| 1,061,639 |
| 1.40 |
| 47,852 |
Total Proven and Probable Mineral Reserves |
| 1,276,888 |
| 1.32 |
| 54,284 |
Notes:
| (i) | Amounts presented in this table have been rounded to the nearest thousand and therefore totals may differ slightly from the addition of the numbers. |
45
| (ii) | Complete information on the verification procedures, quality assurance program, quality control procedures, parameters and methods and other factors that may materially affect scientific and technical information presented in this MD&A and definitions of certain terms used herein may be found in: the AIF under the heading ‘Information on Mineral Reserves and Mineral Resources of the Company”; the Technical Report on the 2022 LaRonde Mineral Resource & Mineral Reserve Estimate filed with Canadian securities regulatory authorities on SEDAR+ on March 23, 2022; the Technical Report on the Mineral Resources and Mineral Reserves at Meadowbank Gold Complex including the Amaruq satellite deposit, Nunavut, Canada as at December 31, 2017 filed with Canadian securities regulatory authorities on SEDAR+ on February 14, 2018; the Updated Technical Report on the Meliadine Gold Project, Nunavut, Canada dated February 11, 2015 filed with Canadian securities regulatory authorities on SEDAR+ on March 12, 2015; the Technical Report on the Mineral Resource and Mineral Reserve Estimates for the Canadian Malartic property in Quebec, Canada with an effective date of December 31, 2020 filed with the Canadian securities regulatory authorities on SEDAR+ on March 25, 2021; the Technical Report on the Mineral Resource and Mineral Reserve Estimates for the LaRonde Complex in Quebec, Canada with an effective date of December 31, 2022 filed with the Canadian securities regulatory authorities on SEDAR+ on March 24, 2023; the Technical Report on the Mineral Resource and Mineral Reserve Estimates for the Detour Lake Operation in Ontario, Canada as at March 31, 2024 filed with Canadian securities regulatory authorities on September 20, 2024; and the Technical Report on the Mineral Resource and Mineral Reserve Estimates for the Fosterville Gold Mine in the State of Victoria, Australia as at December 31, 2018 filed on April 1, 2019. |
| (iii) | Total contained gold ounces does not include equivalent gold ounces for the by-product metals contained in the mineral reserves. |
Non-GAAP Financial Performance Measures
This MD&A discloses certain financial performance measures and ratios, including adjusted net income, adjusted net income per share, EBITDA, adjusted EBITDA, free cash flow, free cash flow before changes in working capital, total cash costs per ounce (on both a by-product and co-product basis), minesite costs per tonne, all-in sustaining costs per ounce (on both a by-product and co-product basis), operating margin, sustaining capital expenditures and development capital expenditures, that are not recognized measures or ratios under IFRS. These measures and ratios may not be comparable to similar measures reported by other gold producers. Non-GAAP financial performance measures and ratios should be considered together with other data prepared in accordance with IFRS.
Adjusted Net Income and Adjusted Net Income Per Share
Adjusted net income takes the net income as recorded in the consolidated statements of income and adjusts for the effects of certain non-recurring, unusual and other items that the Company believes are not reflective of the Company’s underlying performance for the reporting period. Adjusted net income is calculated by adjusting net income for items such as foreign currency translation gains or losses, realized and unrealized gains or losses on derivative financial instruments, impairment loss charges and reversals, environmental remediation charges, severance and transaction costs related to acquisitions, integration costs, purchase price allocations to inventory, revaluation gains, self-insurance losses, gains on the sale of non-strategic exploration properties, gains and losses on disposal of assets, multi-year health care donations, income and mining taxes adjustments as well as other items (which include retroactive payments and disposals of supplies inventory at non-operating sites). Adjusted net income per share is calculated by dividing adjusted net income by the number of shares outstanding at the end of the period on a basic and diluted basis.
The Company believes that adjusted net income and adjusted net income per share are useful to investors in that they allow for the evaluation of the results of continuing operations and in making comparisons between periods. These generally accepted industry measures are intended to provide investors with information about the Company’s continuing income generating capabilities from its core mining business, excluding the above adjustments, which the Company believes are not reflective of operational performance. Management uses this measure to, and believes it is helpful to investors so they can, understand and monitor for the operating performance of the Company in conjunction with other data prepared in accordance with IFRS.
46
The following table sets out the calculation of adjusted net income and adjusted net income per share for the years ended December 31, 2024, December 31, 2023 and December 31, 2022.
|
| 2024 |
| 2023 |
| 2022 | |||
| | (thousands of United States dollars) | |||||||
Net income for the year - basic | | $ | 1,895,581 | | $ | 1,941,307 | | $ | 670,249 |
Dilutive impact of cash settling LTIP | | | — | | | (4,736) | | | — |
Net income for the year - diluted | | | 1,895,581 | | | 1,936,571 | | | 670,249 |
Foreign currency translation loss (gain) | | | 9,383 | | | (328) | | | (16,081) |
Loss (gain) on derivative financial instruments | | | 155,819 | | | (68,432) | | | 90,692 |
Impairment loss | |
| — | |
| 787,000 | |
| 55,000 |
Environmental remediation | |
| 14,719 | |
| 2,712 | |
| 10,417 |
Severance and transaction costs related to acquisitions | |
| — | |
| 21,503 | |
| 95,035 |
Integration costs | |
| — | |
| — | |
| 956 |
Purchase price allocation to inventory(i) | |
| (5,771) | |
| 26,477 | |
| 158,510 |
Revaluation gain on Yamana Transaction | |
| — | |
| (1,543,414) | |
| — |
Penna self-insurance for Meadowbank fire | | | — | | | — | | | 6,500 |
Net loss on disposal of property, plant and equipment | |
| 37,669 | |
| 26,759 | |
| 8,754 |
Other(ii) | | | 19,555 | | | 3,262 | | | 3,258 |
Income and mining taxes adjustments(iii) | |
| (9,183) | |
| (100,910) | |
| (79,737) |
Adjusted net income for the year - basic | | $ | 2,117,772 | | $ | 1,095,936 | | $ | 1,003,553 |
Adjusted net income for the year - diluted | | $ | 2,117,772 | | $ | 1,091,200 | | $ | 1,003,553 |
Net income per share - basic | | $ | 3.79 | | $ | 3.97 | | $ | 1.53 |
Net income per share - diluted | | $ | 3.78 | | $ | 3.95 | | $ | 1.53 |
Adjusted net income per share - basic | | $ | 4.24 | | $ | 2.24 | | $ | 2.29 |
Adjusted net income per share - diluted | | $ | 4.23 | | $ | 2.23 | | $ | 2.29 |
Notes:
| (i) | As part of the purchase price allocation in a business combination, the Company is required to determine the fair value of net assets acquired. The fair value of inventory acquired is estimated based on the selling cost less costs to be incurred plus a profit margin on those costs resulting in a fair value adjustment to the carrying value of inventories acquired. The revalued inventory sold during the year ended December 31, 2024 resulted in reduced production costs of $5.8 million ($3.6 million after tax). The revalued inventory sold during the year ended December 31, 2023 resulted in additional production costs of approximately $26.5 million ($15.9 million after tax). The revalued inventory sold during the year ended December 31, 2022 resulted in additional production costs of $158.5 million ($109.8 million after tax). These non-cash fair value adjustments which affected the cost of inventory sold during the period and are not representative of ongoing operations, were removed from net income in the calculation of adjusted net income. |
| (ii) | Other adjustments are comprised of retroactive payments, disposals of supplies inventory at non-operating sites and other unusual items that management considers are not reflective of the Company’s underlying performance in the period. |
| (iii) | Income and mining taxes adjustments reflect items such as foreign currency translation recorded to the income and mining taxes expense, the impact of income and mining taxes on adjusted items, recognition of previously unrecognized capital losses, the result of income and mining taxes audits, impact of changes in tax laws and adjustments to prior period tax filings. |
47
EBITDA is calculated by adjusting the net income as recorded in the consolidated statements of income for finance costs, income and mining tax expense and amortization of property, plant and mine development line items as reported in the consolidated statements of income. Adjusted EBITDA removes the effects of certain non-recurring, unusual and other items that the Company believes are not reflective of the Company’s underlying performance for the reporting period. Adjusted EBITDA is calculated by adjusting EBITDA for foreign currency translation gains or losses, realized and unrealized gains or losses on derivative financial instruments, impairment loss charges and reversals, environmental remediation, severance and transaction costs related to acquisitions, integration costs, purchase price allocations to inventory, revaluation gains, self-insurance losses, gains on the sale of non-strategic exploration properties, gains and losses on disposal of assets, multi-year health care donations as well as other items (which includes retroactive payments and disposals of supplies inventory at non-operating sites).
The Company believes that EBITDA and Adjusted EBITDA are useful in that they allow for the evaluation of the cash generating capability of the Company to fund its working capital, capital expenditure and debt repayments. These generally accepted industry measures are intended to provide investors with information about the Company’s continuing cash generating capability from its core mining business, excluding the above adjustments, which management believes are not reflective of operational performance. Management uses these measures to, and believes it is helpful to investors so they can, understand and monitor for the cash generating capability of the Company in conjunction with other data prepared in accordance with IFRS.
The following table sets out the calculation of EBITDA and Adjusted EBITDA for the year ended December 31, 2024, December 31, 2023 and December 31, 2022.
|
| Year Ended December 31, | |||||||
| | 2024 |
| 2023 |
| 2022 | |||
| | (thousands of United States dollars) | |||||||
Net income for the period | | $ | 1,895,581 | | $ | 1,941,307 | | $ | 670,249 |
Finance costs | |
| 126,738 | |
| 130,087 | |
| 82,935 |
Income and mining tax expense | |
| 925,974 | |
| 417,762 | |
| 445,174 |
Amortization of property, plant and mine development | |
| 1,514,076 | |
| 1,491,771 | |
| 1,094,691 |
EBITDA | |
| 4,462,369 | |
| 3,980,927 | |
| 2,293,049 |
Foreign currency translation loss (gain) | |
| 9,383 | |
| (328) | |
| (16,081) |
Loss (gain) on derivative financial instruments | |
| 155,819 | |
| (68,432) | |
| 90,692 |
Impairment loss | |
| — | |
| 787,000 | |
| 55,000 |
Environmental remediation | |
| 14,719 | |
| 2,712 | |
| 10,417 |
Severance and transaction costs related to acquisitions | |
| — | |
| 21,503 | |
| 95,035 |
Integration costs | |
| — | |
| — | |
| 956 |
Purchase price allocation to inventory(i) | |
| (5,771) | |
| 26,477 | |
| 158,510 |
Revaluation gain on Yamana Transaction | |
| — | |
| (1,543,414) | |
| — |
Penna self-insurance for Meadowbank fire | |
| — | |
| — | |
| 6,500 |
Net loss on disposal of property. plant and equipment | |
| 37,669 | |
| 26,759 | |
| 8,754 |
Other(ii) | |
| 19,555 | |
| 3,262 | |
| 3,258 |
Adjusted EBITDA | | $ | 4,693,743 | | $ | 3,236,466 | | $ | 2,706,090 |
Notes:
| (i) | As part of the purchase price allocation in a business combination, the Company is required to determine the fair value of net assets acquired. The fair value of inventory acquired is estimated based on the selling cost less costs to be incurred plus a profit margin on those costs resulting in a fair value adjustment to the carrying value of inventories acquired. The revalued inventory sold during the year ended December 31, 2024 resulted in reduced production costs of $5.8 million ($3.6 million after tax). The revalued inventory sold during the year ended December 31, 2023 resulted in additional production costs of approximately $26.5 million ($15.9 million after tax). The revalued inventory sold during the year ended December 31, 2022 resulted in additional production costs of $158.5 million ($109.8 million after tax). These non-cash fair value adjustments which affected the cost of inventory sold during the period and are not representative of ongoing operations, were removed from net income in the calculation of adjusted EBITDA. |
| (ii) | Other adjustments are comprised of retroactive payments, disposals of supplies inventory at non-operating sites and other unusual items that management considers are not reflective of the Company’s underlying performance in the period. |
48
Free Cash Flow and Free Cash Flow before Changes in Non-Cash Components of Working Capital
Free cash flow is calculated by deducting additions to property, plant and mine development from the cash provided by operating activities line item as recorded in the consolidated statements of cash flows. Free cash flow before changes in non-cash components of working capital is calculated by excluding the effect of changes in non-cash components of working capital from free cash flow such as income taxes, inventory, other current assets, accounts payable and accrued liabilities and interest payable.
The Company believes that free cash flow and free cash flow before changes in non-cash components of working capital are useful in that they allow for the evaluation of the Company’s ability to repay creditors and return cash to shareholders without relying on external sources of funding. These generally accepted industry measures also provide investors with information about the Company’s financial position and its ability to generate cash to fund operational and capital requirements as well as return cash to shareholders. Management uses these measures in conjunction with other data prepared in accordance with IFRS to, and believes it is helpful to investors so they can, understand and monitor the cash generating capability of the Company.
The following table sets out the calculation of free cash flow and free cash flow before changes in non-cash components of working capital for the years ended December 31, 2024, December 31, 2023 and December 31, 2022.
|
| 2024 |
| 2023 |
| 2022 | |||
| | (thousands of United States dollars) | |||||||
Cash provided by operating activities | | $ | 3,960,892 | | $ | 2,601,562 | | $ | 2,096,636 |
Additions to property, plant and mine development | |
| (1,817,949) | |
| (1,654,129) | |
| (1,538,237) |
Free cash flow | |
| 2,142,943 | |
| 947,433 | |
| 558,399 |
Changes in income taxes | | $ | (259,327) | | $ | (103,850) | | $ | 35,010 |
Changes in inventory | |
| 208,300 | |
| 169,168 | |
| 46,236 |
Changes in other current assets | |
| (1,166) | |
| 80,931 | |
| (1,354) |
Changes in accounts payable and accrued liabilities | |
| (36,726) | |
| (2,778) | |
| (59,460) |
Changes in interest payable | |
| 8,895 | |
| 2,925 | |
| (1,200) |
Free cash flow before changes in non-cash components of working capital | | $ | 2,062,919 | | $ | 1,093,829 | | $ | 577,631 |
Total Cash Costs per Ounce of Gold Produced and Minesite Costs per Tonne
Total cash costs per ounce of gold produced (also referred to as “total cash costs per ounce”) is reported on both a by-product basis (deducting by-product metal revenues from production costs) and co-product basis (without deducting by-product metal revenues). Total cash costs per ounce of gold produced on a by-product basis is calculated by adjusting production costs as recorded in the consolidated statements of (loss) income for by-product revenues, inventory production costs, the impact of purchase price allocation in connection with mergers and acquisitions on inventory accounting, realized gains and losses on hedges of production costs, operational care and maintenance costs due to COVID-19 and other adjustments, which include the costs associated with a 5% in-kind royalty paid in respect of certain portions of Canadian Malartic, a 2% in-kind royalty paid in respect of Detour Lake, a 1.5% in-kind royalty paid in respect of Macassa, as well as smelting, refining and marketing charges and then dividing by the number of ounces of gold produced. Given the nature of the fair value adjustment on inventory related to mergers and acquisitions and the use of the total cash costs per ounce measures to reflect the cash generating capabilities of the Company’s operations, the calculations of total cash costs per ounce for Detour Lake, Macassa and Fosterville have been adjusted for this purchase price allocation in the comparative period data and for Canadian Malartic in year ended December 31, 2023. Investors should note that total cash costs per ounce are not reflective of all cash expenditures, as they do not include income tax payments, interest costs or dividend payments. Total cash costs per ounce of gold produced on a co-product basis is calculated in the same manner as the total cash costs per ounce of gold produced on a by-product basis, except that no adjustment is made for by-product metal revenues. Accordingly, the calculation of total cash costs per ounce of gold produced on a co-product basis does not reflect a reduction in production costs or smelting, refining and marketing charges associated with the production and sale of by-product metals.
49
Total cash costs per ounce of gold produced is intended to provide investors information about the cash-generating capabilities of the Company’s mining operations. Management also uses these measures to, and believes they are helpful to investors so investors can, understand and monitor the performance of the Company’s mining operations. The Company believes that total cash costs per ounce is useful to help investors understand the costs associated with producing gold and the economics of gold mining. As market prices for gold are quoted on a per ounce basis, using the total cash costs per ounce of gold produced on a by-product basis measure allows management and investors to assess a mine’s cash-generating capabilities at various gold prices. Management is aware, and investors should note, that these per ounce measures of performance can be affected by fluctuations in exchange rates and, in the case of total cash costs per ounce of gold produced on a by-product basis, by-product metal prices. Management compensates for these inherent limitations by using, and investors should also consider using, these measures in conjunction with data prepared in accordance with IFRS and minesite costs per tonne as these measures are not necessarily indicative of operating costs or cash flow measures prepared in accordance with IFRS. Management also performs sensitivity analyses in order to quantify the effects of fluctuating metal prices and exchange rates.
Agnico Eagle’s primary business is gold production and the focus of its current operations and future development is on maximizing returns from gold production, with other metal production being incidental to the gold production process. Accordingly, all metals other than gold are considered by-products.
In this MD&A, unless otherwise indicated, total cash costs per ounce of gold produced is reported on a by-product basis. Total cash costs per ounce of gold produced is reported on a by-product basis because (i) the majority of the Company’s revenues are from gold, (ii) the Company mines ore, which contains gold, silver, zinc, copper and other metals, (iii) it is not possible to specifically assign all costs to revenues from the gold, silver, zinc, copper and other metals the Company produces, (iv) it is a method used by management and the Board to monitor operations, and (v) many other gold producers disclose similar measures on a by-product rather than a co-product basis. Minesite costs per tonne are calculated by adjusting production costs as recorded in the consolidated statements of (loss) income for inventory production costs, operational care and maintenance costs due to COVID-19 and other adjustments, and then dividing by tonnage of ore processed. As the total cash costs per ounce of gold produced can be affected by fluctuations in by–product metal prices and foreign exchange rates, management believes that minesite costs per tonne is useful to investors in providing additional information regarding the performance of mining operations, eliminating the impact of varying production levels. Management also uses this measure to determine the economic viability of mining blocks. As each mining block is evaluated based on the net realizable value of each tonne mined, in order to be economically viable the estimated revenue on a per tonne basis must be in excess of the minesite costs per tonne. Management is aware, and investors should note, that this per tonne measure of performance can be affected by fluctuations in processing levels. This inherent limitation may be partially mitigated by using this measure in conjunction with production costs and other data prepared in accordance with IFRS.
The following tables set out a reconciliation of total cash costs per ounce of gold produced (on both a by-product basis and co-product basis) and minesite costs per tonne to production costs, exclusive of amortization, as presented in the consolidated statements of income in accordance with IFRS.
Total Production Costs by Mine
|
| Year Ended |
| Year Ended |
| Year Ended | |||
(thousands of United States dollars) | | December 31, 2024 | | December 31, 2023 | | December 31, 2022 | |||
LaRonde mine | | $ | 239,309 | | $ | 218,020 | | $ | 213,393 |
LZ5 | |
| 80,186 | |
| 81,624 | |
| 72,096 |
LaRonde | |
| 319,495 | |
| 299,644 | |
| 285,489 |
Canadian Malartic(i) | | | 532,037 | | | 465,814 | | | 235,735 |
Goldex | | | 129,977 | | | 112,022 | | | 103,830 |
Meliadine | |
| 350,280 | |
| 343,650 | |
| 318,141 |
Meadowbank | |
| 463,464 | |
| 524,008 | |
| 442,681 |
Kittila | |
| 227,334 | |
| 205,857 | |
| 210,661 |
Detour Lake(vii) | |
| 497,079 | |
| 453,498 | |
| 489,703 |
Macassa(vii) | |
| 201,371 | |
| 155,046 | |
| 129,774 |
Fosterville(vii) | |
| 147,045 | |
| 131,298 | |
| 204,649 |
Pinos Altos | |
| 168,231 | |
| 145,936 | |
| 144,489 |
Creston Mascota | |
| — | |
| — | |
| 1,943 |
La India | |
| 49,767 | |
| 96,490 | |
| 76,226 |
Production costs per the consolidated statements of income | | $ | 3,086,080 | | $ | 2,933,263 | | $ | 2,643,321 |
50
Reconciliation of Production Costs to Total Cash Costs per Ounce of Gold Produced by Mine and Reconciliation of Production Costs to Minesite Costs per Tonne by Mine
(thousands of United States dollars, except as noted)
LaRonde mine | | Year Ended | | Year Ended | | Year Ended | ||||||||||||
Per Ounce of Gold Produced | | December 31, 2024 | | December 31, 2023 | | December 31, 2022 | ||||||||||||
Gold production (ounces) |
| | |
| | 227,512 |
| | |
| | 235,991 |
| | |
| | 284,780 |
| | (thousands) | | ($ per ounce) | | (thousands) | | ($ per ounce) | | (thousands) | | ($ per ounce) | ||||||
Production costs | | $ | 239,309 | | $ | 1,052 | | $ | 218,020 | | $ | 924 | | $ | 213,393 | | $ | 749 |
Inventory adjustments(ii) | |
| 5,725 | |
| 25 | |
| 13,448 | |
| 57 | |
| 6,569 | |
| 23 |
Realized gains and losses on hedges of production costs | |
| 1,364 | |
| 6 | |
| 2,966 | |
| 13 | |
| 6,879 | |
| 24 |
Other adjustments(vii) | |
| 12,201 | |
| 54 | |
| 17,478 | |
| 73 | |
| 15,331 | |
| 54 |
Total cash costs (co-product basis) | | $ | 258,599 | | $ | 1,137 | | $ | 251,912 | | $ | 1,067 | | $ | 242,172 | | $ | 850 |
By-product metal revenues | |
| (56,265) | |
| (248) | |
| (53,694) | |
| (227) | |
| (64,654) | |
| (227) |
Total cash costs (by-product basis) | | $ | 202,334 | | $ | 889 | | $ | 198,218 | | $ | 840 | | $ | 177,518 | | $ | 623 |
LaRonde mine | | Year Ended | | Year Ended | | Year Ended | ||||||||||||
Per Tonne | | December 31, 2024 | | December 31, 2023 | | December 31, 2022 | ||||||||||||
Tonnes of ore milled (thousands of tonnes) |
| | |
| | 1,554 |
| | |
| | 1,501 |
| |
|
| | 1,670 |
|
| (thousands) |
| ($ per tonne) |
| (thousands) |
| ($ per tonne) |
| (thousands) |
| ($ per tonne) | ||||||
Production costs | | $ | 239,309 | | $ | 154 | | $ | 218,020 | | $ | 145 | | $ | 213,393 | | $ | 128 |
Production costs (C$) | | C$ | 326,489 | | C$ | 210 | | C$ | 293,627 | | C$ | 196 | | C$ | 278,014 | | C$ | 166 |
Inventory adjustments (C$)(iii) | |
| 9,512 | |
| 6 | |
| 20,501 | |
| 14 | |
| 5,360 | |
| 3 |
Other adjustments (C$)(vii) | |
| (12,150) | |
| (8) | |
| (12,990) | |
| (9) | |
| (12,208) | |
| (7) |
Minesite costs (C$) | | C$ | 323,851 | | C$ | 208 | | C$ | 301,138 | | C$ | 201 | | C$ | 271,166 | | C$ | 162 |
LZ5 | | Year Ended | | Year Ended | | Year Ended | ||||||||||||
Per Ounce of Gold Produced | | December 31, 2024 | | December 31, 2023 | | December 31, 2022 | ||||||||||||
Gold production (ounces) |
| | |
| | 79,238 |
| | |
| | 70,657 |
| | |
| | 71,557 |
|
| (thousands) | | ($ per ounce) | | (thousands) | | ($ per ounce) | | (thousands) | | ($ per ounce) | ||||||
Production costs | | $ | 80,186 | | $ | 1,012 | | $ | 81,624 | | $ | 1,155 | | $ | 72,096 | | $ | 1,008 |
Inventory adjustments(ii) | |
| 4,555 | |
| 58 | |
| (3,494) | |
| (49) | |
| (503) | |
| (7) |
Realized gains and losses on hedges of production costs | |
| 476 | |
| 6 | |
| 988 | |
| 14 | |
| 1,602 | |
| 22 |
Other adjustments(vii) | |
| 3,351 | |
| 42 | |
| 2,705 | |
| 38 | |
| 136 | |
| 2 |
Total cash costs (co-product basis) | | $ | 88,568 | | $ | 1,118 | | $ | 81,823 | | $ | 1,158 | | $ | 73,331 | | $ | 1,025 |
By-product metal revenues | |
| (1,022) | |
| (13) | |
| (711) | |
| (10) | |
| (259) | |
| (4) |
Total cash costs (by-product basis) | | $ | 87,546 | | $ | 1,105 | | $ | 81,112 | | $ | 1,148 | | $ | 73,072 | | $ | 1,021 |
LZ5 | | Year Ended | | Year Ended | | Year Ended | ||||||||||||
Per Tonne |
| December 31, 2024 |
| December 31, 2023 |
| December 31, 2022 | ||||||||||||
Tonnes of ore milled (thousands of tonnes) | | |
|
| | 1,295 | | |
|
| | 1,157 | | |
|
| | 1,146 |
|
| (thousands) | | ($ per tonne) |
| (thousands) | | ($ per tonne) | | (thousands) | | ($ per tonne) | ||||||
Production costs | | $ | 80,186 | | $ | 62 | | $ | 81,624 | | $ | 71 | | $ | 72,096 | | $ | 63 |
Production costs (C$) | | C$ | 109,741 | | C$ | 85 | | C$ | 109,991 | | C$ | 95 | | C$ | 93,655 | | C$ | 82 |
Inventory adjustments (C$)(iii) | |
| 6,422 | |
| 5 | |
| (4,717) | |
| (4) | |
| (289) | |
| (1) |
Minesite costs (C$) | | C$ | 116,163 | | C$ | 90 | | C$ | 105,274 | | C$ | 91 | | C$ | 93,366 | | C$ | 81 |
LaRonde |
| Year Ended |
| Year Ended |
| Year Ended | ||||||||||||
Per Ounce of Gold Produced | | December 31, 2024 | | December 31, 2023 | | December 31, 2022 | ||||||||||||
Gold production (ounces) | | | |
| | 306,750 |
| | |
| | 306,648 |
| | |
| | 356,337 |
|
| (thousands) | | ($ per ounce) | | (thousands) | | ($ per ounce) | | (thousands) | | ($ per ounce) | ||||||
Production costs | | $ | 319,495 | | $ | 1,042 | | $ | 299,644 | | $ | 977 | | $ | 285,489 | | $ | 801 |
Inventory adjustments(ii) | |
| 10,280 | |
| 33 | |
| 9,954 | |
| 32 | |
| 6,066 | |
| 17 |
Realized gains and losses on hedges of production costs | |
| 1,840 | |
| 6 | |
| 3,954 | |
| 13 | |
| 8,481 | |
| 24 |
Other adjustments(vii) | |
| 15,552 | |
| 51 | |
| 20,183 | |
| 66 | |
| 15,467 | |
| 43 |
Total cash costs (co-product basis) | | $ | 347,167 | | $ | 1,132 | | $ | 333,735 | | $ | 1,088 | | $ | 315,503 | | $ | 885 |
By-product metal revenues | |
| (57,287) | |
| (187) | |
| (54,405) | |
| (177) | |
| (64,913) | |
| (182) |
Total cash costs (by-product basis) | | $ | 289,880 | | $ | 945 | | $ | 279,330 | | $ | 911 | | $ | 250,590 | | $ | 703 |
51
LaRonde | | Year Ended | | Year Ended | | Year Ended | ||||||||||||
Per Tonne | | December 31, 2024 | | December 31, 2023 | | December 31, 2022 | ||||||||||||
Tonnes of ore milled (thousands of tonnes) |
| |
|
| | 2,849 |
| |
|
| | 2,658 |
| |
|
| | 2,816 |
|
| (thousands) |
| ($ per tonne) |
| (thousands) |
| ($ per tonne) |
| (thousands) |
| ($ per tonne) | ||||||
Production costs | | $ | 319,495 | | $ | 112 | | $ | 299,644 | | $ | 113 | | $ | 285,489 | | $ | 101 |
Production costs (C$) | | C$ | 436,230 | | C$ | 153 | | C$ | 403,618 | | C$ | 152 | | C$ | 371,669 | | C$ | 132 |
Inventory adjustments (C$)(iii) | |
| 15,934 | |
| 5 | |
| 15,784 | |
| 6 | |
| 5,071 | |
| 1 |
Other adjustments (C$)(vii) | |
| (12,150) | |
| (4) | |
| (12,990) | |
| (5) | |
| (12,208) | |
| (4) |
Minesite costs (C$) | | C$ | 440,014 | | C$ | 154 | | C$ | 406,412 | | C$ | 153 | | C$ | 364,532 | | C$ | 129 |
Canadian Malartic | | Year Ended | | Year Ended | | Year Ended | ||||||||||||
Per Ounce of Gold Produced(i) | | December 31, 2024 | | December 31, 2023 | | December 31, 2022 | ||||||||||||
Gold production (ounces) |
| | |
| | 655,654 |
| | |
| | 603,955 |
| | |
| | 329,396 |
| | (thousands) |
| ($ per ounce) |
| (thousands) |
| ($ per ounce) |
| (thousands) |
| ($ per ounce) | ||||||
Production costs | | $ | 532,037 | | $ | 811 | | $ | 465,814 | | $ | 771 | | $ | 235,735 | | $ | 716 |
Inventory adjustments(ii) | | | (1,968) | | | (3) | | | 4,738 | | | 8 | | | (1,867) | | | (6) |
Realized gains and losses on hedges of production costs | | | 4,138 | | | 6 | | | — | | | — | | | — | | | — |
Purchase price allocation to inventory(v) | | | 5,771 | | | 9 | | | (26,447) | | | (44) | | | — | | | — |
In-kind royalties and other adjustments(vii) | |
| 78,230 | |
| 120 | |
| 60,149 | |
| 100 | |
| 30,568 | |
| 93 |
Total cash costs (co-product basis) | | $ | 618,208 | | $ | 943 | | $ | 504,254 | | $ | 835 | | $ | 264,436 | | $ | 803 |
By-product metal revenues | |
| (8,386) | |
| (13) | |
| (6,732) | |
| (11) | |
| (5,087) | |
| (16) |
Total cash costs (by-product basis) | | $ | 609,822 | | $ | 930 | | $ | 497,522 | | $ | 824 | | $ | 259,349 | | $ | 787 |
Canadian Malartic | | Year Ended | | Year Ended | | Year Ended | ||||||||||||
Per Tonne(i) | | December 31, 2024 | | December 31, 2023 | | December 31, 2022 | ||||||||||||
Tonnes of ore milled (thousands of tonnes) |
| | |
| | 20,317 |
| | |
| | 17,333 |
| |
|
| | 9,770 |
|
| (thousands) |
| ($ per tonne) |
| (thousands) |
| ($per tonne) |
| (thousands) |
| ($ per tonne) | ||||||
Production costs | | $ | 532,037 | | $ | 26 | | $ | 465,814 | | $ | 27 | | $ | 235,735 | | $ | 24 |
Production costs (C$) | | C$ | 726,836 | | C$ | 36 | | C$ | 627,946 | | C$ | 36 | | C$ | 302,734 | | C$ | 31 |
Inventory adjustments (C$)(iii) | | | (2,025) | | | — | | | 6,919 | | | — | | | 902 | | | — |
Purchase price allocation to inventory(C$)(v) | | | 8,073 | | | — | | | (34,555) | | | (2) | | | — | | | — |
In-kind royalties and other adjustments (C$)(vii) | |
| 106,163 | |
| 5 | |
| 79,962 | |
| 5 | |
| 35,981 | |
| 4 |
Minesite costs (C$) | | C$ | 839,047 | | C$ | 41 | | C$ | 680,272 | | C$ | 39 | | C$ | 339,617 | | C$ | 35 |
Goldex | | Year Ended | | Year Ended | | Year Ended | ||||||||||||
Per Ounce of Gold Produced | | December 31, 2024 | | December 31, 2023 | | December 31, 2022 | ||||||||||||
Gold production (ounces) | | | |
| | 130,813 | | | |
| | 140,983 | | | |
| | 141,502 |
|
| (thousands) |
| ($ per ounce) |
| (thousands) |
| ($ per ounce) |
| (thousands) |
| ($ per ounce) | ||||||
Production costs | | $ | 129,977 | | $ | 994 | | $ | 112,022 | | $ | 795 | | $ | 103,830 | | $ | 734 |
Inventory adjustments(ii) | |
| 2,438 | |
| 18 | |
| 1,650 | |
| 11 | |
| 1,227 | |
| 9 |
Realized gains and losses on hedges of production costs | |
| 816 | |
| 6 | |
| 1,944 | |
| 14 | |
| 3,048 | |
| 21 |
Other adjustments(vii) | |
| 3,009 | |
| 23 | |
| 336 | |
| 2 | |
| 199 | |
| 1 |
Total cash costs (co-product basis) | | $ | 136,240 | | $ | 1,041 | | $ | 115,952 | | $ | 822 | | $ | 108,304 | | $ | 765 |
By-product metal revenues | |
| (15,452) | |
| (118) | |
| (378) | |
| (2) | |
| (48) | |
| — |
Total cash costs (by-product basis) | | $ | 120,788 | | $ | 923 | | $ | 115,574 | | $ | 820 | | $ | 108,256 | | $ | 765 |
Goldex | | Year Ended | | Year Ended | | Year Ended | ||||||||||||
Per Tonne | | December 31, 2024 | | December 31, 2023 | | December 31, 2022 | ||||||||||||
Tonnes of ore milled (thousands of tonnes) | | | |
| | 3,076 | | | |
| | 2,887 | | | |
| | 2,940 |
|
| (thousands) |
| ($ per tonne) |
| (thousands) |
| ($ per tonne) |
| (thousands) |
| ($ per tonne) | ||||||
Production costs |
| $ | 129,977 |
| $ | 42 |
| $ | 112,022 |
| $ | 39 |
| $ | 103,830 |
| $ | 35 |
Production costs (C$) | | C$ | 177,816 | | C$ | 58 | | C$ | 151,185 | | C$ | 52 | | C$ | 135,084 | | C$ | 46 |
Inventory adjustments (C$)(iii) | |
| 3,702 | |
| 1 | |
| 2,189 | |
| 1 | |
| 1,818 | |
| 1 |
Minesite costs (C$) | | C$ | 181,518 | | C$ | 59 | | C$ | 153,374 | | C$ | 53 | | C$ | 136,902 | | C$ | 47 |
52
Meliadine | | Year Ended | | Year Ended | | Year Ended | ||||||||||||
Per Ounce of Gold Produced | | December 31, 2024 | | December 31, 2023 | | December 31, 2022 | ||||||||||||
Gold production (ounces) | | | |
| | 378,886 | | | |
| | 364,141 | | | |
| | 372,874 |
|
| (thousands) |
| ($ per ounce) |
| (thousands) |
| ($ per ounce) |
| (thousands) |
| ($ per ounce) | ||||||
Production costs |
| $ | 350,280 |
| $ | 924 |
| $ | 343,650 |
| $ | 944 |
| $ | 318,141 |
| $ | 853 |
Inventory adjustments(ii) | |
| 3,279 | |
| 9 | |
| 11,898 | |
| 33 | |
| 653 | |
| 2 |
Realized gains and losses on hedges of production costs | |
| 3,165 | |
| 8 | |
| 1,682 | |
| 4 | |
| 3,500 | |
| 9 |
Other adjustments(vii) | |
| 250 | |
| 1 | |
| 128 | |
| — | |
| 313 | |
| 1 |
Total cash costs (co-product basis) | | $ | 356,974 | | $ | 942 | | $ | 357,358 | | $ | 981 | | $ | 322,607 | | $ | 865 |
By-product metal revenues | |
| (860) | |
| (2) | |
| (630) | |
| (1) | |
| (753) | |
| (2) |
Total cash costs (by-product basis) | | $ | 356,114 | | $ | 940 | | $ | 356,728 | | $ | 980 | | $ | 321,854 | | $ | 863 |
Meliadine | | Year Ended | | Year Ended | | Year Ended | ||||||||||||
Per Tonne |
| December 31, 2024 |
| December 31, 2023 |
| December 31, 2022 | ||||||||||||
Tonnes of ore milled (thousands of tonnes) |
| | |
| | 1,966 |
| | |
| | 1,918 |
| |
|
| | 1,757 |
|
| (thousands) |
| ($ per tonne) |
| (thousands) |
| ($ per tonne) |
| (thousands) |
| ($ per tonne) | ||||||
Production costs | | $ | 350,280 | | $ | 178 | | $ | 343,650 | | $ | 179 | | $ | 318,141 | | $ | 181 |
Production costs (C$) | | C$ | 478,335 | | C$ | 243 | | C$ | 462,052 | | C$ | 241 | | C$ | 407,871 | | C$ | 232 |
Inventory adjustments (C$)(iii) | |
| 6,578 | |
| 4 | |
| 16,188 | |
| 8 | |
| 2,510 | |
| 2 |
Minesite costs (C$) | | C$ | 484,913 | | C$ | 247 | | C$ | 478,240 | | C$ | 249 | | C$ | 410,381 | | C$ | 234 |
Meadowbank | | Year Ended | | Year Ended | | Year Ended | ||||||||||||
Per Ounce of Gold Produced |
| December 31, 2024 |
| December 31, 2023 |
| December 31, 2022 | ||||||||||||
Gold production (ounces) |
| | |
| | 504,719 |
| | |
| | 431,666 |
| | |
| | 373,785 |
|
| (thousands) |
| ($ per ounce) |
| (thousands) |
| ($ per ounce) |
| (thousands) |
| ($ per ounce) | ||||||
Production costs | | $ | 463,464 | | $ | 918 | | $ | 524,008 | | $ | 1,214 | | $ | 442,681 | | $ | 1,184 |
Inventory adjustments(ii) | |
| 9,464 | |
| 19 | | | (12,021) | |
| (28) | |
| 14,807 | |
| 40 |
Realized gains and losses on hedges of production costs | | | 4,624 | | | 9 | | | (1,205) | | | (3) | | | (1,691) | | | (4) |
Operational care and maintenance due to COVID-19(iv) | |
| — | |
| — | | | — | |
| — | |
| (1,436) | |
| (4) |
Other adjustments(vii) | |
| (41) | |
| — | | | (19) | |
| — | |
| 34 | |
| — |
Total cash costs (co-product basis) | | $ | 477,511 | | $ | 946 | | $ | 510,763 | | $ | 1,183 | | $ | 454,395 | | $ | 1,216 |
By-product metal revenues | |
| (4,138) | |
| (8) | | | (2,958) | |
| (7) | |
| (2,127) | |
| (6) |
Total cash costs (by-product basis) | | $ | 473,373 | | $ | 938 | | $ | 507,805 | | $ | 1,176 | | $ | 452,268 | | $ | 1,210 |
Meadowbank |
| Year Ended |
| Year Ended |
| Year Ended | ||||||||||||
Per Tonne | | December 31, 2024 | | December 31, 2023 | | December 31, 2022 | ||||||||||||
Tonnes of ore milled (thousands of tonnes) |
| | |
| | 4,143 |
| | |
| | 3,843 |
| |
|
| | 3,739 |
|
| (thousands) |
| ($ per tonne) |
| (thousands) |
| ($ per tonne) |
| (thousands) |
| ($ per tonne) | ||||||
Production costs | | $ | 463,464 | | $ | 112 | | $ | 524,008 | | $ | 136 | | $ | 442,681 | | $ | 118 |
Production costs (C$) | | C$ | 632,661 | | C$ | 153 | | C$ | 702,879 | | C$ | 183 | | C$ | 574,895 | | C$ | 154 |
Inventory adjustments (C$)(iii) | |
| 14,234 | |
| 3 | | | (15,934) | |
| (4) | |
| 12,203 | |
| 3 |
Operational care and maintenance due to COVID-19 (C$)(iv) | |
| — | |
| — | | | — | |
| — | |
| (1,793) | |
| — |
Minesite costs (C$) | | C$ | 646,895 | | C$ | 156 | | C$ | 686,945 | | C$ | 179 | | C$ | 585,305 | | C$ | 157 |
Kittila |
| Year Ended |
| | Year Ended |
| Year Ended | |||||||||||
Per Ounce of Gold Produced | | December 31, 2024 | | December 31, 2023 | | December 31, 2022 | ||||||||||||
Gold production (ounces) |
| | |
| | 218,860 |
| | |
| | 234,402 |
| |
|
| | 216,947 |
|
| (thousands) |
| ($ per ounce) |
| (thousands) |
| ($ per ounce) |
| (thousands) |
| ($ per ounce) | ||||||
Production costs | | $ | 227,334 | | $ | 1,039 | | $ | 205,857 | | $ | 878 | | $ | 210,661 | | $ | 971 |
Inventory adjustments(ii) | |
| (1,172) | |
| (6) | |
| 2,958 | |
| 13 | |
| (5,349) | |
| (25) |
Realized gains and losses on hedges of production costs | |
| 151 | |
| 1 | |
| (2,999) | |
| (13) | |
| 7,329 | |
| 34 |
Other adjustments(vii) | |
| (212) | |
| (1) | |
| (1,338) | |
| (6) | |
| 274 | |
| 1 |
Total cash costs (co-product basis) | | $ | 226,101 | | $ | 1,033 | | $ | 204,478 | | $ | 872 | | $ | 212,915 | | $ | 981 |
By-product metal revenues | |
| (483) | |
| (2) | |
| (358) | |
| (1) | |
| (295) | |
| (1) |
Total cash costs (by-product basis) | | $ | 225,618 | | $ | 1,031 | | $ | 204,120 | | $ | 871 | | $ | 212,620 | | $ | 980 |
53
Kittila |
| Year Ended |
| Year Ended |
| Year Ended | ||||||||||||
Per Tonne |
| December 31, 2024 |
| December 31, 2023 |
| December 31, 2022 | ||||||||||||
Tonnes of ore milled (thousands of tonnes) |
| | |
| | 2,026 |
| | |
| | 1,954 |
| |
|
| | 1,925 |
|
| (thousands) |
| ($ per tonne) |
| (thousands) |
| ($ per tonne) |
| (thousands) |
| ($ per tonne) | ||||||
Production costs | | $ | 227,334 | | $ | 112 | | $ | 205,857 | | $ | 105 | | $ | 210,661 | | $ | 109 |
Production costs (€) | | € | 210,285 | | € | 103 | | € | 191,023 | | € | 98 | | € | 198,484 | | € | 103 |
Inventory adjustments (€)(iii) | |
| (633) | |
| — | |
| 2,112 | |
| 1 | |
| (3,853) | |
| (2) |
Minesite costs (€) | | € | 209,652 | | € | 103 | | € | 193,135 | | € | 99 | | € | 194,631 | | € | 101 |
Detour Lake |
| Year Ended |
| Year Ended |
| Year Ended | ||||||||||||
Per Ounce of Gold Produced | | December 31, 2024 | | December 31, 2023 | | December 31, 2022(vi) | ||||||||||||
Gold production (ounces) |
| | |
| | 671,950 |
| | |
| | 677,446 |
| |
|
| | 651,182 |
|
| (thousands) |
| ($ per ounce) |
| (thousands) |
| ($ per ounce) |
| (thousands) |
| ($ per ounce) | ||||||
Production costs | | $ | 497,079 | | $ | 740 | | $ | 453,498 | | $ | 669 | | $ | 489,703 | | $ | 752 |
Inventory adjustments(ii) | |
| (1,348) | |
| (2) | |
| 8,232 | |
| 12 | |
| (8,195) | |
| (13) |
Realized gains and losses on hedges of production costs | | | 4,714 | | | 7 | | | 4,867 | | | 8 | | | — | | | — |
Purchase price allocation to inventory(v) | |
| — | |
| — | |
| — | |
| — | |
| (74,509) | |
| (113) |
In-kind royalties and other adjustments(vii) | |
| 37,788 | |
| 56 | |
| 33,149 | |
| 49 | |
| 24,483 | |
| 37 |
Total cash costs (co-product basis) | | $ | 538,233 | | $ | 801 | | $ | 499,746 | | $ | 738 | | $ | 431,482 | | $ | 663 |
By-product metal revenues | | | (3,049) | | | (5) | | | (2,073) | | | (3) | | | (3,712) | | | (6) |
Total cash costs (by-product basis) | | $ | 535,184 | | $ | 796 | | $ | 497,673 | | $ | 735 | | $ | 427,770 | | $ | 657 |
Detour Lake |
| Year Ended |
| Year Ended |
| Year Ended | ||||||||||||
Per Tonne | | December 31, 2024 | | December 31, 2023 | | December 31, 2022(vi) | ||||||||||||
Tonnes of ore milled (thousands of tonnes) |
| | |
| | 27,462 |
| | |
| | 25,435 |
| |
|
| | 22,782 |
|
| (thousands) |
| ($ per tonne) |
| (thousands) |
| ($ per tonne) |
| (thousands) |
| ($ per tonne) | ||||||
Production costs | | $ | 497,079 | | $ | 18 | | $ | 453,498 | | $ | 18 | | $ | 489,703 | | $ | 21 |
Production costs (C$) | | C$ | 678,877 | | C$ | 25 | | C$ | 611,244 | | C$ | 24 | | C$ | 637,567 | | C$ | 28 |
Inventory adjustments (C$)(iii) | | | (458) | | | — | | | 11,038 | | | — | | | (8,782) | | | — |
Purchase price allocation to inventory (C$)(v) | |
| — | |
| — | |
| — | |
| — | |
| (95,791) | |
| (4) |
In-kind royalties and other adjustments (C$)(vii) | |
| 44,125 | |
| 1 | |
| 39,323 | |
| 2 | |
| 31,917 | |
| 1 |
Minesite costs (C$) | | C$ | 722,544 | | C$ | 26 | | C$ | 661,605 | | C$ | 26 | | C$ | 564,911 | | C$ | 25 |
Macassa |
| Year Ended |
| Year Ended |
| Year Ended | ||||||||||||
Per Ounce of Gold Produced | | December 31, 2024 | | December 31, 2023 | | December 31, 2022(vi) | ||||||||||||
Gold production (ounces) |
| | |
| | 279,384 |
| | |
| | 228,535 |
| |
|
| | 180,833 |
|
| (thousands) |
| ($ per ounce) |
| (thousands) |
| ($ per ounce) |
| | (thousands) |
| ($ per ounce) | |||||
Production costs | | $ | 201,371 | | $ | 721 | | $ | 155,046 | | $ | 678 | | $ | 129,774 | | $ | 718 |
Inventory adjustments(ii) | |
| (3,607) | |
| (13) | |
| 1,382 | |
| 6 | |
| 38 | |
| — |
Realized gains and losses on hedges of production costs | | | 1,679 | | | 6 | | | 3,127 | | | 14 | | | — | | | — |
Purchase price allocation to inventory(v) | |
| — | |
| — | |
| — | |
| — | |
| (10,326) | |
| (57) |
In-kind royalties and other adjustments(vii) | |
| 10,564 | |
| 38 | |
| 8,041 | |
| 35 | |
| 4,237 | |
| 23 |
Total cash costs (co-product basis) | | $ | 210,007 | | $ | 752 | | $ | 167,596 | | $ | 733 | | $ | 123,723 | | $ | 684 |
By-product metal revenues | |
| (1,020) | |
| (4) | |
| (649) | |
| (2) | |
| (298) | |
| (1) |
Total cash costs (by-product basis) | | $ | 208,987 | | $ | 748 | | $ | 166,947 | | $ | 731 | | $ | 123,425 | | $ | 683 |
Macassa |
| Year Ended |
| Year Ended |
| Year Ended | ||||||||||||
Per Tonne | | December 31, 2024 | | December 31, 2023 | | December 31, 2022(vi) | ||||||||||||
Tonnes of ore milled (thousands of tonnes) |
| | |
| | 574 |
| | |
| | 442 |
| |
|
| | 280 |
|
| (thousands) |
| ($ per tonne) |
| (thousands) |
| ($ per tonne) |
| (thousands) |
| ($ per tonne) | ||||||
Production costs | | $ | 201,371 | | $ | 351 | | $ | 155,046 | | $ | 351 | | $ | 129,774 | | $ | 463 |
Production costs (C$) | | C$ | 276,532 | | C$ | 482 | | C$ | 209,928 | | C$ | 475 | | C$ | 168,400 | | C$ | 602 |
Inventory adjustments (C$)(iii) | |
| (4,605) | |
| (8) | |
| 1,836 | |
| 4 | |
| 533 | |
| 2 |
Purchase price allocation to inventory (C$)(v) | |
| — | |
| — | |
| — | |
| — | |
| (13,248) | |
| (47) |
In-kind royalties and other adjustments (C$)(vii) | |
| 13,896 | |
| 24 | |
| 10,517 | |
| 24 | |
| 5,538 | |
| 20 |
Minesite costs (C$) | | C$ | 285,823 | | C$ | 498 | | C$ | 222,281 | | C$ | 503 | | C$ | 161,223 | | C$ | 577 |
54
Fosterville |
| Year Ended |
| Year Ended |
| Year Ended | ||||||||||||
Per Ounce of Gold Produced | | December 31, 2024 | | December 31, 2023 | | December 31, 2022(vi) | ||||||||||||
Gold production (ounces) |
| | |
| | 225,203 |
| | |
| | 277,694 |
| |
|
| | 338,327 |
|
| (thousands) |
| ($ per ounce) |
| (thousands) |
| ($ per ounce) |
| (thousands) |
| ($ per ounce) | ||||||
Production costs | | $ | 147,045 | | $ | 653 | | $ | 131,298 | | $ | 473 | | $ | 204,649 | | $ | 605 |
Inventory adjustments(ii) | |
| (1,011) | |
| (4) | |
| 1,345 | |
| 5 | |
| (2,691) | |
| (8) |
Realized gains and losses on hedges of production costs | | | 222 | | | 1 | | | 3,097 | | | 11 | | | — | | | — |
Purchase price allocation to inventory(v) | | | — | | | — | | | — | | | — | | | (73,674) | | | (218) |
Other adjustments(vii) | |
| 70 | |
| — | |
| 52 | |
| — | |
| — | |
| — |
Total cash costs (co-product basis) | | $ | 146,326 | | $ | 650 | | $ | 135,792 | | $ | 489 | | $ | 128,284 | | $ | 379 |
By-product metal revenues | |
| (565) | |
| (3) | |
| (397) | |
| (1) | |
| (527) | |
| (1) |
Total cash costs (by-product basis) | | $ | 145,761 | | $ | 647 | | $ | 135,395 | | $ | 488 | | $ | 127,757 | | $ | 378 |
Fosterville |
| Year Ended |
| Year Ended |
| Year Ended | ||||||||||||
Per Tonne | | December 31, 2024 | | December 31, 2023 | | December 31, 2022(vi) | ||||||||||||
Tonnes of ore milled (thousands of tonnes) |
| | |
| | 809 |
| | |
| | 651 |
| |
|
| | 524 |
|
| (thousands) |
| ($ per tonne) |
| (thousands) |
| ($ per tonne) |
| (thousands) |
| ($ per tonne) | ||||||
Production costs | | $ | 147,045 | | $ | 182 | | $ | 131,298 | | $ | 202 | | $ | 204,649 | | $ | 391 |
Production costs (A$) | | A$ | 224,121 | | A$ | 277 | | A$ | 197,921 | | A$ | 304 | | A$ | 293,875 | | A$ | 561 |
Inventory adjustments (A$)(iii) | |
| (1,253) | |
| (1) | |
| (2,155) | |
| (3) | |
| (3,045) | |
| (6) |
Purchase price allocation to inventory (A$)(v) | |
| — | |
| — | |
| — | |
| — | |
| (104,507) | |
| (199) |
Minesite costs (A$) | | A$ | 222,868 | | A$ | 276 | | A$ | 195,766 | | A$ | 301 | | A$ | 186,323 | | A$ | 356 |
Pinos Altos | | Year Ended | | Year Ended | | Year Ended | ||||||||||||
Per Ounce of Gold Produced | | December 31, 2024 | | December 31, 2023 | | December 31, 2022 | ||||||||||||
Gold production (ounces) |
| | |
| | 88,433 |
| | |
| | 97,642 |
| |
|
| | 96,522 |
|
| (thousands) |
| ($per ounce) |
| (thousands) |
| ($per ounce) |
| (thousands) |
| ($per ounce) | ||||||
Production costs | | $ | 168,231 | | $ | 1,902 | | $ | 145,936 | | $ | 1,495 | | $ | 144,489 | | $ | 1,497 |
Inventory adjustments(ii) | |
| 678 | |
| 8 | |
| 2,979 | |
| 31 | |
| (2,295) | |
| (24) |
Realized gains and losses on hedges of production costs | |
| 68 | |
| 1 | |
| (2,819) | |
| (29) | |
| (879) | |
| (9) |
Other adjustments(vii) | |
| 1,287 | |
| 14 | |
| 1,248 | |
| 12 | |
| 1,235 | |
| 13 |
Total cash costs (co-product basis) | | $ | 170,264 | | $ | 1,925 | | $ | 147,344 | | $ | 1,509 | | $ | 142,550 | | $ | 1,477 |
By-product metal revenues | | | (34,924) | | | (395) | | | (27,339) | | | (280) | | | (21,983) | | | (228) |
Total cash costs (by-product basis) | | $ | 135,340 | | $ | 1,530 | | $ | 120,005 | | $ | 1,229 | | $ | 120,567 | | $ | 1,249 |
Pinos Altos | | Year Ended | | Year Ended | | Year Ended | ||||||||||||
Per Tonne | | December 31, 2024 | | December 31, 2023 | | December 31, 2022 | ||||||||||||
Tonnes of ore processed (thousands of tonnes) |
| | |
| | 1,707 |
| | |
| | 1,656 |
| |
|
| | 1,510 |
|
| (thousands) |
| ($per tonne) |
| (thousands) |
| ($per tonne) |
| (thousands) |
| ($per tonne) | ||||||
Production costs | | $ | 168,231 | | $ | 99 | | $ | 145,936 | | $ | 88 | | $ | 144,489 | | $ | 96 |
Inventory adjustments(iii) | |
| 746 | |
| — | |
| 160 | |
| — | |
| (2,295) | |
| (2) |
Minesite costs | | $ | 168,977 | | $ | 99 | | $ | 146,096 | | $ | 88 | | $ | 142,194 | | $ | 94 |
Creston Mascota | | Year Ended | | Year Ended | | Year Ended | ||||||||||||
Per Ounce of Gold Produced | | December 31, 2024 | | December 31, 2023 | | December 31, 2022 | ||||||||||||
Gold production (ounces) |
| | |
| | 104 |
| | |
| | 638 |
| |
|
| | 2,630 |
|
| (thousands) |
| ($per ounce) |
| (thousands) |
| ($per ounce) |
| (thousands) |
| ($per ounce) | ||||||
Production costs | | $ | — | | $ | — | | $ | — | | $ | — | | $ | 1,943 | | $ | 739 |
Inventory adjustments(ii) | |
| — | |
| — | |
| — | |
| — | |
| 222 | |
| 84 |
Other adjustments(vii) | |
| — | |
| — | |
| — | |
| — | |
| 78 | |
| 30 |
Total cash costs (co-product basis) | | $ | — | | $ | — | | $ | — | | $ | — | | $ | 2,243 | | $ | 853 |
By-product metal revenues | |
| — | |
| — | |
| — | |
| — | |
| (158) | |
| (60) |
Total cash costs (by-product basis) | | $ | — | | $ | — | | $ | — | | $ | — | | $ | 2,085 | | $ | 793 |
Creston Mascota | | Year Ended | | Year Ended | | Year Ended | ||||||||||||
Per Tonne(viii) | | December 31, 2024 | | December 31, 2023 | | December 31, 2022 | ||||||||||||
Tonnes of ore processed (thousands of tonnes) |
| | |
| | — |
| | |
| | — |
| |
|
| | — |
|
| (thousands) |
| ($per tonne) |
| (thousands) |
| ($per tonne) |
| (thousands) |
| ($per tonne) | ||||||
Production costs | | $ | — | | $ | — | | $ | — | | $ | — | | $ | 1,943 | | $ | — |
Inventory adjustments(ii) | |
| — | |
| — | |
| — | |
| — | |
| 222 | |
| — |
Other adjustments(vii) | |
| — | |
| — | |
| — | |
| — | |
| (2,165) | |
| — |
Minesite costs | | $ | — | | $ | — | | $ | — | | $ | — | | $ | — | | $ | — |
55
La India | | Year Ended | | Year Ended | | Year Ended | ||||||||||||
Per Ounce of Gold Produced | | December 31, 2024 | | December 31, 2023 | | December 31, 2022 | ||||||||||||
Gold production (ounces) |
| |
|
| | 24,580 |
| |
|
| | 75,904 |
| |
|
| | 74,672 |
|
| (thousands) |
| ($ per ounce) |
| (thousands) |
| ($ per ounce) |
| (thousands) |
| ($ per ounce) | ||||||
Production costs | | $ | 49,767 | | $ | 2,025 | | $ | 96,490 | | $ | 1,271 | | $ | 76,226 | | $ | 1,021 |
Inventory adjustments(ii) | |
| (1,322) | |
| (54) | |
| (1,335) | |
| (18) | |
| 3,598 | |
| 48 |
Other adjustments(vii) | |
| 401 | |
| 16 | |
| 584 | |
| 8 | |
| 699 | |
| 9 |
Total cash costs (co-product basis) | | $ | 48,846 | | $ | 1,987 | | $ | 95,739 | | $ | 1,261 | | $ | 80,523 | | $ | 1,078 |
By-product metal revenues | |
| (1,038) | |
| (42) | |
| (1,566) | |
| (20) | |
| (1,689) | |
| (22) |
Total cash costs (by-product basis) | | $ | 47,808 | | $ | 1,945 | | $ | 94,173 | | $ | 1,241 | | $ | 78,834 | | $ | 1,056 |
La India | | Year Ended | | Year Ended | | Year Ended | ||||||||||||
Per Tonne(ix) | | December 31, 2024 | | December 31, 2023 | | December 31, 2022 | ||||||||||||
Tonnes of ore processed (thousands of tonnes) |
| | |
| | — |
| | |
| | 3,010 |
| |
|
| | 5,102 |
|
| (thousands) |
| ($per tonne) |
| (thousands) |
| ($per tonne) |
| (thousands) |
| ($per tonne) | ||||||
Production costs | | $ | 49,767 | | $ | — | | $ | 96,490 | | $ | 32 | | $ | 76,226 | | $ | 15 |
Inventory adjustments(iii) | |
| (49,767) | |
| — | |
| (1,335) | |
| — | |
| 3,598 | |
| 1 |
Minesite costs | | $ | — | | $ | — | | $ | 95,155 | | $ | 32 | | $ | 79,824 | | $ | 16 |
Notes:
| (i) | The information set out in this table reflects the Company’s 50% interest in Canadian Malartic up to and including March 30, 2023 and 100% interest thereafter following the closing of the Yamana Transaction. |
| (ii) | Under the Company’s revenue recognition policy, revenue from contracts with customers is recognized upon the transfer of control over metals sold to the customer. As the total cash costs per ounce of gold produced are calculated on a production basis, an inventory adjustment is made to reflect the portion of production not yet recognized as revenue. |
| (iii) | This inventory adjustment reflects production costs associated with the portion of production still in inventory. |
| (iv) | This adjustment reflects the costs associated with the temporary suspension of mining activities at the Company’s Nunavut mine sites in response to the COVID-19 pandemic and primarily includes payroll and other incidental costs associated with maintaining the sites and properties and payroll costs associated with employees who were not working during the period of reduced or suspended operations. These expenses also include payroll costs of employees who could not work following the period of temporary suspension or reduced operations due to the Company’s effort to prevent or curtail community transmission of COVID-19. |
| (v) | On February 8, 2022, the Company completed the Merger and this adjustment reflects the fair value allocated to inventory at Detour Lake, Macassa and Fosterville as part of the purchase price allocation. On March 31, 2023, the Company completed the Yamana Transaction and this adjustment reflects the fair value allocated to inventory on Canadian Malartic as part of the purchase price allocation. |
| (vi) | On February 8, 2022, the Company completed the Merger. Accordingly, the contributions from Detour Lake, Macassa and Fosterville for the year ended December 31, 2022 reflects the period from February 8 to December 31, 2022. |
| (vii) | Other adjustments consists of costs associated with a 5% in-kind royalty paid in respect of Canadian Malartic, a 2% in-kind royalty paid in respect of Detour Lake, a 1.5% in-kind royalty paid in respect of Macassa and smelting, refining, and marketing charges to production costs. |
| (viii) | Creston Mascota’s cost calculations per tonne for the year ended December 31, 2022 exclude approximately $2.2 million of production costs incurred during the period, following the cessation of mining activities at the Bravo pit during the third quarter of 2020. |
| (ix) | La India’s cost calculations per tonne for the year ended December 31, 2024 exclude approximately $49.8 million of production costs incurred during the period, following the cessation of mining activities at La India during the fourth quarter of 2023. |
All-in Sustaining Costs per Ounce of Gold Produced
All-in sustaining costs per ounce of gold produced (also referred to as “all-in sustaining costs per ounce” or “AISC per ounce”) on a by-product basis is calculated as the aggregate of total cash costs on a by-product basis, sustaining capital expenditures (including capitalized exploration), general and administrative expenses (including stock options), lease payments related to sustaining assets and reclamation expenses, and then dividing by the number of ounces of gold produced. These additional costs reflect the additional expenditures that are required to be made to maintain current production levels. AISC per ounce on a co-product basis is calculated in the same manner as AISC per ounce on a by-product basis, except that the total cash costs on a co-product basis are used, meaning no adjustment has been made for by-product metal revenues. Investors should note that AISC per ounce is not reflective of all cash expenditures as it does not include income tax payments, interest costs or dividend payments, nor does it include non-cash expenditures, such as depreciation and amortization. In this MD&A , unless otherwise indicated, all-in sustaining costs per ounce of gold produced is reported on a byproduct basis (see “Non-GAAP measures - Total cash costs per ounce of gold produced” for a discussion of regarding the Company’s use of by-product basis reporting).
56
Management believes that AISC per ounce is helpful to investors as it reflects total sustaining expenditures of producing and selling an ounce of gold while maintaining current operations and, as such, provides helpful information about operating performance. Management is aware, and investors should note, that these per ounce measures of performance can be affected by fluctuations in foreign exchange rates and, in the case of AISC per ounce on a by-product basis, by-product metal prices. Management compensates for these inherent limitations by using, and investors should also consider using, these measures in conjunction with data prepared in accordance with IFRS and minesite costs per tonne, as AISC per ounce is not necessarily indicative of operating costs or cash flow measures prepared in accordance with IFRS.
The Company follows the guidance on calculation of AISC per ounce released by the World Gold Council (“WGC”) in 2018. The WGC is a non-regulatory market development organization for the gold industry that has worked closely with its member companies to develop guidance in respect of relevant non-GAAP measures. Notwithstanding the Company’s adoption of the WGC’s guidance, AISC per ounce of gold produced reported by the Company may not be comparable to data reported by other gold mining companies.
The following tables set out a reconciliation of production costs to all-in sustaining costs per ounce of gold produced for the years ended December 31, 2024, December 31, 2023, and December 31, 2022 on both a by-product basis (deducting by-product metal revenues from production costs) and co-product basis (without deducting by-product metal revenues).
Reconciliation of Production Costs to All-in Sustaining Costs per Ounce of Gold Produced
|
| Year Ended |
| Year Ended |
| Year Ended | |||
| | December 31, | | December 31, | | December 31, | |||
(United States dollars per ounce of gold produced, except where noted) | | 2024 | | 2023 | | 2022 | |||
Production costs per the consolidated statements of income (thousands of United States dollars) | | $ | 3,086,080 | | $ | 2,933,263 | | $ | 2,643,321 |
Gold production (ounces) | |
| 3,485,336 | |
| 3,439,654 | |
| 3,135,007 |
Production costs per ounce of gold production | | $ | 885 | | $ | 853 | | $ | 843 |
Adjustments: | |
| | |
| | |
| |
Inventory adjustments(i) | |
| 5 | |
| 9 | |
| 2 |
Purchase price allocation to inventory(ii) | |
| 2 | |
| (8) | |
| (51) |
Realized gains and losses on hedges of production costs | |
| 6 | | | 3 | |
| 6 |
Other(iii) | |
| 42 | |
| 36 | |
| 25 |
Total cash costs per ounce of gold produced (co-product basis) | | $ | 940 | | $ | 893 | | $ | 825 |
By-product metal revenues | |
| (37) | |
| (28) | |
| (32) |
Total cash costs per ounce of gold produced (by-product basis) | | $ | 903 | | $ | 865 | | $ | 793 |
Adjustments: | |
| | |
| | |
| |
Sustaining capital expenditures (including capitalized exploration) | |
| 258 | |
| 235 | |
| 232 |
General and administrative expenses (including stock option expense) | |
| 60 | |
| 61 | |
| 70 |
Non-cash reclamation provision and sustaining leases(iv) | |
| 18 | |
| 18 | |
| 14 |
All-in sustaining costs per ounce of gold produced (by-product basis) | | $ | 1,239 | | $ | 1,179 | | $ | 1,109 |
By-product metal revenues | |
| 37 | |
| 28 | |
| 32 |
All-in sustaining costs per ounce of gold produced (co-product basis) | | $ | 1,276 | | $ | 1,207 | | $ | 1,141 |
Notes:
| (i) | Under the Company’s revenue recognition policy, revenue from contracts with customers is recognized upon the transfer of control over metals sold to the customer. As the total cash costs per ounce of gold produced are calculated on a production basis, an inventory adjustment is made to reflect the portion of production not yet recognized as revenue. |
| (ii) | On February 8, 2022, the Company completed the Merger and this adjustment reflects the fair value allocated to inventory at Detour Lake, Macassa and Fosterville as part of the purchase price allocation. On March 31, 2023, the Company completed the Yamana Transaction and this adjustment reflects the fair value allocated to inventory at Canadian Malartic as part of the purchase price allocation. |
| (iii) | Other adjustments consists of in-kind royalties, smelting, refining and marketing charges to production costs. |
| (iv) | Sustaining leases are lease payments related to sustaining assets. |
57
Operating margin is calculated by deducting production costs from revenue from mining operations. In order to reconcile operating margin to net income as recorded in the consolidated financial statements, the Company adds the following items to the operating margin: income and mining taxes expense; other expenses (income); care and maintenance expenses; foreign currency translation (gain) loss; environmental remediation costs; gain (loss) on derivative financial instruments; finance costs; general and administrative expenses; amortization of property, plant and mine development; exploration and corporate development expenses; revaluation gain and impairment losses (reversals). The Company believes that operating margin is a useful measure to investors as it reflects the operating performance of its individual mines associated with the ongoing production and sale of gold and by-product metals without allocating Company-wide overhead, such as exploration and corporate development expenses, amortization of property, plant and mine development, general and administrative expenses, finance costs, gain and losses on derivative financial instruments, environmental remediation costs, foreign currency translation gains and losses, other expenses and income and mining tax expenses. Management uses this measure internally to plan and forecast future operating results. Management believes this measure is helpful to investors as it provides them with additional information about the Company’s underlying operating results, though it should be evaluated in conjunction with other data prepared in accordance with IFRS. For a reconciliation of operating margin to revenue from operations, see “Three Year Financial and Operating Summary”.
Sustaining and Development Capital Expenditures by Mine
Capital expenditures are classified into sustaining capital expenditures and development capital expenditures. Sustaining capital expenditures are expenditures incurred during the production phase to sustain and maintain existing assets so they can achieve constant expected levels of production from which the Company will derive economic benefits. Sustaining capital expenditures include expenditure for assets to retain their existing productive capacity as well as to enhance performance and reliability of the operations. Development capital expenditures represent the spending at new projects and/or expenditures at existing operations that are undertaken with the intention to increase production levels or mine life above the current plans. Management uses these measures in the capital allocation process and to assess the effectiveness of its investments. Management believes these measures are useful so investors can assess the purpose and effectiveness of the capital expenditures split between sustaining and development in each reporting period. The classification between sustaining and development capital expenditures does not have a standardized definition in accordance with IFRS and other companies may classify expenditures in a different manner.
58
Reconciliation of Sustaining and Development Capital Expenditures to the Statements of Cash Flows
| | Three Months Ended December 31, | | Year Ended December 31, | ||||||||||||||
(thousands of United States dollars) |
| 2024 |
| 2023 |
| 2022 |
| 2024 |
| 2023 |
| 2022 | ||||||
LaRonde mine | | $ | 22,696 | | $ | 21,890 | | $ | 26,247 | | $ | 74,448 | | $ | 72,828 | | $ | 92,921 |
LZ5 | | | 5,016 | | | 3,368 | | | 2,272 | | | 17,738 | | | 10,253 | | | 9,258 |
LaRonde | | | 27,712 | | | 25,258 | | | 28,519 | | | 92,186 | | | 83,081 | | | 102,179 |
Canadian Malartic(i) | | | 35,649 | | | 18,809 | | | 18,858 | | | 127,536 | | | 91,028 | | | 69,137 |
Goldex | | | 11,138 | | | 12,267 | | | 7,125 | | | 53,586 | | | 27,203 | | | 25,125 |
Meliadine | | | 19,860 | | | 21,244 | | | 19,392 | | | 79,672 | | | 75,275 | | | 62,086 |
Meadowbank | | | 20,226 | | | 21,297 | | | 40,872 | | | 91,944 | | | 121,653 | | | 86,435 |
Kittila | | | 18,107 | | | 16,514 | | | 14,503 | | | 71,101 | | | 49,539 | | | 48,799 |
Detour Lake(ii) | | | 78,341 | | | 67,123 | | | 58,546 | | | 267,588 | | | 249,765 | | | 214,060 |
Macassa(ii) | | | 16,419 | | | 15,888 | | | 9,558 | | | 46,067 | | | 45,029 | | | 30,298 |
Fosterville(ii) | | | 18,015 | | | 9,322 | | | 19,525 | | | 40,313 | | | 34,646 | | | 56,343 |
Pinos Altos | | | 11,030 | | | 7,041 | | | 8,333 | | | 30,882 | | | 30,141 | | | 26,500 |
La India | | | — | | | (6) | | | 1,793 | | | 22 | | | 100 | | | 8,963 |
Other | | | 3,347 | | | — | | | 15 | | | 7,856 | | | 147 | | | 3,620 |
Sustaining capital expenditures | | $ | 259,844 | | $ | 214,757 | | $ | 227,039 | | $ | 908,753 | | $ | 807,607 | | $ | 733,545 |
LaRonde mine | | $ | 13,480 | | $ | 12,401 | | $ | 11,870 | | $ | 52,434 | | $ | 44,862 | | $ | 54,829 |
LZ5 | | | 8,766 | | | 5,236 | | | 6,787 | | | 30,980 | | | 24,068 | | | 17,191 |
LaRonde | | | 22,246 | | | 17,637 | | | 18,657 | | | 83,414 | | | 68,930 | | | 72,020 |
Canadian Malartic(i) | | | 70,529 | | | 50,509 | | | 42,649 | | | 195,259 | | | 169,960 | | | 128,551 |
Goldex | | | 5,488 | | | 10,730 | | | 17,709 | | | 14,374 | | | 59,436 | | | 39,081 |
Meliadine | | | 15,942 | | | 25,990 | | | 21,023 | | | 82,800 | | | 118,880 | | | 93,808 |
Meadowbank | | | 3,286 | | | (277) | | | 1,614 | | | 3,266 | | | 80 | | | 53,394 |
Kittila | | | 3,144 | | | 5,177 | | | 15,918 | | | 11,845 | | | 31,463 | | | 52,764 |
Detour Lake(ii) | | | 87,745 | | | 66,671 | | | 63,824 | | | 235,168 | | | 172,903 | | | 180,072 |
Macassa(ii) | | | 37,483 | | | 26,120 | | | 27,998 | | | 124,716 | | | 101,230 | | | 92,175 |
Fosterville(ii) | | | 13,215 | | | 16,591 | | | 7,399 | | | 49,728 | | | 52,793 | | | 38,368 |
Pinos Altos | | | 1,579 | | | (635) | | | 6,682 | | | 3,399 | | | 5,297 | | | 26,749 |
La India | | | — | | | — | | | 338 | | | — | | | — | | | 6,129 |
San Nicolás | | | 3,770 | | | — | | | — | | | 18,847 | | | — | | | — |
Other | | | 51,574 | | | 3,391 | | | 6,324 | | | 109,391 | | | 12,289 | | | 20,244 |
Development capital expenditures | | $ | 316,001 | | $ | 221,904 | | $ | 230,135 | | $ | 932,207 | | $ | 793,261 | | $ | 803,355 |
Total capital expenditures | | $ | 575,845 | | $ | 436,661 | | $ | 457,174 | | $ | 1,840,960 | | $ | 1,600,868 | | $ | 1,536,900 |
Working capital adjustments | |
| (13,682) | |
| (10,919) | |
| (56,343) | |
| (23,011) | |
| 53,261 | |
| 1,337 |
Additions to property, plant and mine development per the consolidated statements of cash flows | | $ | 562,163 | | $ | 425,742 | | $ | 400,831 | | $ | 1,817,949 | | $ | 1,654,129 | | $ | 1,538,237 |
Notes:
| (i) | The information set out in this table reflects the Company’s 50% interest in Canadian Malartic up to and including March 30, 2023 and 100% interest thereafter following the closing of the Yamana Transaction. |
| (ii) | On February 8, 2022, the Company completed the Merger. Accordingly, the contributions from the Detour Lake, Macassa and Fosterville mines for the year ended December 31, 2022 reflects the period from February 8 to December 31, 2022. |
NOTE TO INVESTORS CONCERNING FORWARD-LOOKING INFORMATION
Certain statements in this MD&A, referred to herein as “forward-looking statements”, constitute “forward-looking information” under the provisions of Canadian provincial securities laws and constitute “forward-looking statements” within the meaning of the United States Private Securities Litigation Reform Act of 1995. These statements relate to, among other things, the Company’s plans, objectives, expectations, estimates, beliefs, strategies and intentions and can generally be identified by the use of words such as “anticipate”, “believe”, “budget”, “could”, “estimate”, “expect”, “forecast”, “likely”, “may”, “plan”, “project”, “schedule”, “should”, “target”, “will”, “would” or other variations of these terms or similar words.
Forward-looking statements in this MD&A include the following: the Company’s forward-looking guidance, including metal production, estimated ore grades, recovery rates, project timelines, drilling targets or results, life of mine estimates, total cash costs per ounce, AISC per ounce, minesite costs per tonne, other expenses and cash flows; the potential for additional gold production at the Company’s sites; the estimated timing and conclusions of the Company’s studies and evaluations; the methods by which ore will be
59
extracted or processed; the Company’s expansion plans at Detour Lake, Upper Beaver and Odyssey, including the timing, funding, completion and commissioning thereof and the commencement of production therefrom; the Company’s plans at Hope Bay and San Nicolás; statements concerning other expansion projects, recovery rates, mill throughput, optimization efforts and projected exploration, including costs and other estimates upon which such projections are based; timing and amounts of capital expenditures, other expenditures and other cash needs, and expectations as to the funding thereof; estimates of future mineral reserves, mineral resources, mineral production and sales; the projected development of certain ore deposits, including estimates of exploration, development and production and other capital costs and estimates of the timing of such exploration, development and production or decisions with respect to such exploration, development and production; anticipated cost inflation and its effect on the Company’s costs and results; estimates of mineral reserves and mineral resources and the effect of drill results and studies on future mineral reserves and mineral resources; the Company’s ability to obtain the necessary permits and authorizations in connection with its proposed or current exploration, development and mining operations, including at Meliadine, Upper Beaver and San Nicolás, and the anticipated timing thereof; future exploration; the anticipated timing of events with respect to the Company’s mine sites; the Company’s plans and strategies with respect to climate change and greenhouse gas emissions reductions; the sufficiency of the Company’s cash resources; the Company’s plans with respect to hedging and the effectiveness of its hedging strategies; future activity with respect to the Company’s unsecured revolving bank credit facility and other indebtedness; future dividend amounts, record dates and payment dates; plans with respect to activity under the NCIB; and anticipated trends with respect to the Company’s operations, exploration and the funding thereof. Such statements reflect the Company’s views as at the date of this news release and are subject to certain risks, uncertainties and assumptions, and undue reliance should not be placed on such statements.
Forward-looking statements are necessarily based upon a number of factors and assumptions that, while considered reasonable by Agnico Eagle as of the date of such statements, are inherently subject to significant business, economic and competitive uncertainties and contingencies. The material factors and assumptions used in the preparation of the forward-looking statements contained herein, which may prove to be incorrect, include, but are not limited to, the assumptions set forth herein and in the Company’s most recent Annual Information Form (“AIF”) filed with Canadian securities regulators and that are included in its Annual Report on Form 40-F (“Form 40-F”) filed with the U.S. Securities and Exchange Commission (the “SEC”) as well as: that there are no significant disruptions affecting operations; that production, permitting, development, expansion and the ramp-up of operations at each of Agnico Eagle’s properties proceeds on a basis consistent with current expectations and plans; that the Company’s plans for its mining operations are not changed or amended in a material way; that the relevant metal prices, foreign exchange rates and prices for key mining and construction inputs (including labour and electricity) will be consistent with Agnico Eagle’s expectations; that the effect of tariffs will not materially affect the price or availability of the inputs the Company uses at its operations; that Agnico Eagle’s current estimates of mineral reserves, mineral resources, mineral grades and metal recovery are accurate; that there are no material delays in the timing for completion of ongoing growth projects; that seismic activity at the Company’s operations at LaRonde, Goldex, Fosterville and other properties is as expected by the Company and that the Company’s efforts to mitigate its effect on mining operations, including with respect to community relations, are successful; that the Company’s current plans to address climate change and reduce greenhouse gas emissions are successful; that the Company’s current plans to optimize production are successful; that there are no material variations in the current tax and regulatory environment; that governments, the Company or others do not take measures in response to pandemics or other health emergencies or otherwise that, individually or in the aggregate, materially affect the Company’s ability to operate its business or its productivity; and that measures taken relating to, or other effects of, pandemics or other health emergencies do not affect the Company’s ability to obtain necessary supplies and deliver them to its mine sites.
Many factors, known and unknown, could cause the actual results to be materially different from those expressed or implied by such forward-looking statements. Such risks include, but are not limited to: the volatility of prices of gold and other metals; uncertainty of mineral reserves, mineral resources, mineral grades and mineral recovery estimates; uncertainty of future production, project development, capital expenditures and other costs; foreign exchange rate fluctuations; inflationary pressures; financing of additional capital requirements; cost of exploration and development programs; seismic activity at the Company’s operations, including at LaRonde, Goldex and Fosterville; mining risks; community protests, including by Indigenous groups; risks associated with foreign operations; risks associated with joint ventures; governmental and environmental regulation; the volatility of the Company’s stock price; risks associated with the Company’s currency, fuel and by-product metal derivative strategies; the current interest rate environment; the potential for major economies to encounter a slowdown in economic activity or a recession; the potential for increased conflict or hostilities in various regions, including Europe and the Middle East; and the extent and manner of communicable diseases or outbreaks, and measures taken by governments, the Company or others to attempt to mitigate the spread thereof may directly or indirectly affect the Company.
60
For a more detailed discussion of such risks and other factors that may affect the Company’s ability to achieve the expectations set forth in the forward-looking statements contained in this MD&A, see the AIF filed on SEDAR+ at www.sedarplus.ca and included in the Form 40-F filed on EDGAR at www.sec.gov, as well as the Company’s other filings with the Canadian securities regulators and the SEC. Other than as required by law, the Company does not intend, and does not assume any obligation, to update these forward-looking statements.
SCIENTIFIC AND TECHNICAL INFORMATION
The scientific and technical information set out in this MD&A relating to Nunavut, Quebec and Finland operations has been approved by Dominique Girard, Eng., Executive Vice-President & Chief Operating Officer – Nunavut, Quebec & Europe; relating to Ontario, Australia and Mexico operations has been approved by Natasha Vaz, Executive Vice-President & Chief Operating Officer – Ontario, Australia & Mexico; relating to exploration has been approved by Guy Gosselin, Eng. and P.Geo., Executive Vice-President, Exploration; and relating to mineral reserves and mineral resources has been approved by Dyane Duquette, P.Geo., Vice-President, Mineral Resources Management, each of whom is a “Qualified Person” for the purposes of NI 43-101.
61
NOTE TO INVESTORS CONCERNING ESTIMATES OF MINERAL RESERVES AND MINERAL RESOURCES
The mineral reserve and mineral resource estimates contained in this MD&A have been prepared in accordance with the Canadian Security Administrators’ (the “CSA”) National Instrument 43-101 Standards of Disclosure for Mineral Projects (“NI 43-101”).
Effective February 25, 2019, the SEC’s disclosure requirements and policies for mining properties with current industry and global regulatory practices and standards, including NI 43-101. However, Canadian issuers that report in the United States using the Multijurisdictional Disclosure System (“MJDS”), such as the Company, may still use NI 43-101 rather than the SEC’s disclosure requirements when using the SEC’s MJDS registration statement and annual report forms. Accordingly, mineral reserve and mineral resource information contained in this MD&A may not be comparable to similar information disclosed by U.S. companies.
Investors are cautioned that while the SEC now recognizes “measured mineral resources”, “indicated mineral resources” and “inferred mineral resources”, investors should not assume that any part or all of the mineral deposits in these categories will ever be converted into a higher category of mineral resources or into mineral reserves. These terms have a great amount of uncertainty as to their economic and legal feasibility. Accordingly, investors are cautioned not to assume that any “measured mineral resources”, “indicated mineral resources”, or “inferred mineral resources” that the Company reports in this MD&A are or will be economically or legally mineable.
Further, “inferred mineral resources” have a great amount of uncertainty as to their existence and as to their economic and legal feasibility. It cannot be assumed that any part or all of an inferred mineral resource will ever be upgraded to a higher category. Under Canadian regulations, estimates of inferred mineral resources may not form the basis of feasibility or pre-feasibility studies, except in limited circumstances. Investors are cautioned not to assume that all or any part of an inferred mineral resource exists, or is or will ever be economically or legally mineable.
The mineral reserve and mineral resource data set out in this MD&A are estimates, and no assurance can be given that the anticipated tonnages and grades will be achieved or that the indicated level of recovery will be realized. The Company does not include equivalent gold ounces for by-product metals contained in mineral reserves in its calculation of contained ounces and mineral reserves are not reported as a subset of mineral resources. See “Mineral Reserves and Mineral Resources” in the AIF for additional information.
62
AGNICO EAGLE MINES LIMITED
SUMMARIZED QUARTERLY DATA
(thousands of United States dollars, except where noted)
|
| Three Months Ended | | | | ||||||||||
| | March 31, | | June 30, | | September 30, | | December 31, | | Total | |||||
Operating margin(ii): |
| 2024 |
| 2024 |
| 2024 |
| 2024 |
| 2024 | |||||
Revenues from mining operations | | $ | 1,829,823 | | $ | 2,076,621 | | $ | 2,155,609 | | $ | 2,223,700 | | $ | 8,285,753 |
Production costs | | | 783,585 | | | 771,984 | | | 783,653 | | | 746,858 | | | 3,086,080 |
Total operating margin(ii) | | | 1,046,238 | | | 1,304,637 | | | 1,371,956 | | | 1,476,842 | | | 5,199,673 |
Amortization of property, plant and mine development | |
| 357,225 | | | 378,389 | | | 390,245 | | | 388,217 | | | 1,514,076 |
Exploration, corporate and other | |
| 199,965 | | | 216,042 | | | 141,921 | | | 306,114 | | | 864,042 |
Income before income and mining taxes | |
| 489,048 | | | 710,206 | | | 839,790 | | | 782,511 | | | 2,821,555 |
Income and mining taxes | |
| 141,856 | | | 238,190 | | | 272,672 | | | 273,256 | | | 925,974 |
Net income for the period | | $ | 347,192 | | $ | 472,016 | | $ | 567,118 | | $ | 509,255 | | $ | 1,895,581 |
Net income per share — basic | | $ | 0.70 | | $ | 0.95 | | $ | 1.13 | | $ | 1.02 | | $ | 3.79 |
Net income per share — diluted | | $ | 0.70 | | $ | 0.94 | | $ | 1.13 | | $ | 1.01 | | $ | 3.78 |
Cash flows: | |
| | | | | | | | | | | | | |
Cash provided by operating activities | | $ | 783,175 | | $ | 961,336 | | $ | 1,084,532 | | $ | 1,131,849 | | $ | 3,960,892 |
Realized prices: | |
| | | | | | | | | | | | | |
Gold (per ounce) | | $ | 2,062 | | $ | 2,342 | | $ | 2,492 | | $ | 2,660 | | $ | 2,384 |
Silver (per ounce) | | $ | 23.80 | | $ | 30.09 | | $ | 30.69 | | $ | 30.31 | | $ | 28.85 |
Zinc (per tonne) | | $ | 2,453 | | $ | 2,792 | | $ | 2,822 | | $ | 2,955 | | $ | 2,755 |
Copper (per tonne) | | $ | 8,731 | | $ | 9,192 | | $ | 8,254 | | $ | 9,193 | | $ | 9,291 |
Payable production(iv): | | | | | | | | | | | | | | | |
Gold (ounces) | |
| | | | | | | | | | | | | |
LaRonde mine | |
| 51,815 | | | 62,260 | | | 47,313 | | | 66,124 | | | 227,512 |
LZ5 | |
| 16,549 | | | 20,074 | | | 18,292 | | | 24,323 | | | 79,238 |
Canadian Malartic(iii) | |
| 186,906 | | | 180,871 | | | 141,392 | | | 146,485 | | | 655,654 |
Goldex | |
| 34,388 | | | 33,750 | | | 30,334 | | | 32,341 | | | 130,813 |
Meliadine | |
| 95,725 | | | 88,675 | | | 99,838 | | | 94,648 | | | 378,886 |
Meadowbank | |
| 127,774 | | | 126,419 | | | 133,502 | | | 117,024 | | | 504,719 |
Kittila | |
| 54,581 | | | 55,671 | | | 56,715 | | | 51,893 | | | 218,860 |
Detour Lake | |
| 150,751 | | | 168,247 | | | 173,891 | | | 179,061 | | | 671,950 |
Macassa | |
| 68,259 | | | 64,062 | | | 70,727 | | | 76,336 | | | 279,384 |
Fosterville | |
| 56,569 | | | 65,963 | | | 65,532 | | | 37,139 | | | 225,203 |
Pinos Altos | |
| 24,725 | | | 23,754 | | | 21,371 | | | 18,583 | | | 88,433 |
Creston Mascota | | | 28 | | | 13 | | | 9 | | | 54 | | | 104 |
La India | |
| 10,582 | | | 6,079 | | | 4,529 | | | 3,390 | | | 24,580 |
Total gold (ounces) | |
| 878,652 | | | 895,838 | | | 863,445 | | | 847,401 | | | 3,485,336 |
Silver (thousands of ounces) | |
| 615 | | | 628 | | | 602 | | | 640 | | | 2,485 |
Zinc (tonnes) | |
| 1,682 | | | 1,883 | | | 914 | | | 1,860 | | | 6,339 |
Copper (tonnes) | | | 804 | | | 1,072 | | | 797 | | | 1,278 | | | 3,951 |
63
AGNICO EAGLE MINES LIMITED
SUMMARIZED QUARTERLY DATA
(thousands of United States dollars, except where noted)
|
| Three Months Ended | | | ||||||
| | March 31, | | June 30, | | September 30, | | December 31, | | Total |
Payable metal sold: |
| 2024 |
| 2024 |
| 2024 |
| 2024 |
| 2024 |
Gold (ounces) |
|
|
|
|
|
|
|
|
|
|
LaRonde mine |
| 65,164 | | 51,565 | | 58,357 | | 53,525 | | 228,611 |
LZ5 |
| 20,251 | | 16,265 | | 18,920 | | 20,647 | | 76,083 |
Canadian Malartic(iii)(v) |
| 159,548 | | 176,651 | | 139,694 | | 148,753 | | 624,646 |
Goldex |
| 34,442 | | 33,783 | | 31,671 | | 29,501 | | 129,397 |
Meliadine |
| 98,540 | | 94,438 | | 83,900 | | 97,898 | | 374,776 |
Meadowbank |
| 121,110 | | 131,003 | | 126,010 | | 114,497 | | 492,620 |
Kittila | | 55,000 | | 56,984 | | 59,464 | | 48,100 | | 219,548 |
Detour Lake |
| 167,008 | | 153,622 | | 176,585 | | 166,057 | | 663,272 |
Macassa |
| 67,500 | | 65,340 | | 65,000 | | 80,624 | | 278,464 |
Fosterville |
| 58,000 | | 62,049 | | 67,198 | | 41,900 | | 229,147 |
Pinos Altos |
| 20,300 | | 25,510 | | 23,700 | | 19,900 | | 89,410 |
La India |
| 12,200 | | 7,020 | | 5,400 | | 3,500 | | 28,120 |
Total gold (ounces) |
| 879,063 | | 874,230 | | 855,899 | | 824,902 | | 3,434,094 |
Silver (thousands of ounces) | | 604 | | 637 | | 573 | | 669 | | 2,483 |
Zinc (tonnes) | | 1,507 | | 1,547 | | 1,748 | | 1,407 | | 6,209 |
Copper (tonnes) | | 762 | | 1,113 | | 806 | | 1,271 | | 3,952 |
64
AGNICO EAGLE MINES LIMITED
SUMMARIZED QUARTERLY DATA
(thousands of United States dollars, except where noted)
|
| Three Months Ended | |||||||||||||
| | March 31, | | June 30, | | September 30, | | December 31, | | Total | |||||
Operating margin(ii): | | 2023 |
| 2023(i) |
| 2023(i) |
| 2023(i) |
| 2023 | |||||
Revenues from mining operations | | $ | 1,509,661 | | $ | 1,718,197 | | $ | 1,642,411 | | $ | 1,756,640 | | $ | 6,626,909 |
Production costs | |
| 653,144 | |
| 743,253 | |
| 759,411 | |
| 777,455 | |
| 2,933,263 |
Total operating margin(ii) | |
| 856,517 | |
| 974,944 | |
| 883,000 | |
| 979,185 | |
| 3,693,646 |
Impairment loss | |
| — | |
| — | |
| — | |
| 787,000 | |
| 787,000 |
Amortization of property, plant and mine development | |
| 303,959 | |
| 386,314 | |
| 421,091 | |
| 380,407 | |
| 1,491,771 |
Revaluation gain | |
| (1,543,414) | |
| — | |
| — | |
| — | |
| (1,543,414) |
Exploration, corporate and other | |
| 150,473 | |
| 127,342 | |
| 196,694 | |
| 124,711 | |
| 599,220 |
Income (loss) before income and mining taxes | |
| 1,945,499 | |
| 461,288 | |
| 265,215 | |
| (312,933) | |
| 2,359,069 |
Income and mining taxes | |
| 128,608 | |
| 137,618 | |
| 90,412 | |
| 61,124 | |
| 417,762 |
Net income (loss) for the period | | $ | 1,816,891 | | $ | 323,670 | | $ | 174,803 | | $ | (374,057) | | $ | 1,941,307 |
Net income (loss) per share — basic | | $ | 3.87 | | $ | 0.66 | | $ | 0.35 | | $ | (0.75) | | $ | 3.97 |
Net income (loss) per share — diluted | | $ | 3.86 | | $ | 0.65 | | $ | 0.35 | | $ | (0.75) | | $ | 3.95 |
Cash flows: | |
|
| |
|
| |
|
| |
|
| |
|
|
Cash provided by operating activities | | $ | 649,613 | | $ | 722,000 | | $ | 502,088 | | $ | 727,861 | | $ | 2,601,562 |
Realized prices: | |
|
| |
|
| |
|
| |
|
| |
|
|
Gold (per ounce) | | $ | 1,892 | | $ | 1,975 | | $ | 1,928 | | $ | 1,982 | | $ | 1,946 |
Silver (per ounce) | | $ | 22.95 | | $ | 24.43 | | $ | 23.55 | | $ | 23.88 | | $ | 23.72 |
Zinc (per tonne) | | $ | 3,169 | | $ | 2,343 | | $ | 2,360 | | $ | 2,583 | | $ | 2,746 |
Copper (per tonne) | | $ | 10,113 | | $ | 7,898 | | $ | 8,223 | | $ | 7,998 | | $ | 8,740 |
Payable production(iv): | |
|
| |
|
| |
|
| |
|
| |
|
|
Gold (ounces) | |
|
| |
|
| |
|
| |
|
| |
|
|
LaRonde mine | |
| 59,533 | |
| 58,635 | |
| 49,303 | |
| 68,520 | |
| 235,991 |
LZ5 | |
| 20,074 | |
| 18,145 | |
| 15,193 | |
| 17,245 | |
| 70,657 |
Canadian Malartic(iii) | |
| 80,685 | |
| 177,755 | |
| 177,243 | |
| 168,272 | |
| 603,955 |
Goldex | |
| 34,023 | |
| 37,716 | |
| 35,880 | |
| 33,364 | |
| 140,983 |
Meliadine | |
| 90,467 | |
| 87,682 | |
| 89,707 | |
| 96,285 | |
| 364,141 |
Meadowbank | |
| 111,110 | |
| 94,775 | |
| 116,555 | |
| 109,226 | |
| 431,666 |
Kittila | |
| 63,692 | |
| 50,130 | |
| 59,408 | |
| 61,172 | |
| 234,402 |
Detour Lake | |
| 161,857 | |
| 169,352 | |
| 152,762 | |
| 193,475 | |
| 677,446 |
Macassa | |
| 64,115 | |
| 57,044 | |
| 46,792 | |
| 60,584 | |
| 228,535 |
Fosterville | |
| 86,558 | |
| 81,813 | |
| 59,790 | |
| 49,533 | |
| 277,694 |
Pinos Altos | |
| 24,134 | |
| 22,159 | |
| 25,386 | |
| 25,963 | |
| 97,642 |
Creston Mascota | |
| 244 | |
| 165 | |
| 141 | |
| 88 | |
| 638 |
La India | |
| 16,321 | |
| 17,833 | |
| 22,269 | |
| 19,481 | |
| 75,904 |
Total gold (ounces) | |
| 812,813 | |
| 873,204 | |
| 850,429 | |
| 903,208 | |
| 3,439,654 |
Silver (thousands of ounces) | |
| 545 | |
| 619 | |
| 589 | |
| 655 | |
| 2,408 |
Zinc (tonnes) | |
| 2,287 | |
| 2,611 | |
| 1,420 | |
| 1,384 | |
| 7,702 |
Copper (tonnes) | |
| 530 | |
| 746 | |
| 659 | |
| 682 | |
| 2,617 |
65
AGNICO EAGLE MINES LIMITED
SUMMARIZED QUARTERLY DATA
(thousands of United States dollars, except where noted)
|
| Three Months Ended | ||||||||
| | March 31, | | June 30, | | September 30, | | December 31, | | Total |
Payable metal sold: | | 2023 |
| 2023 |
| 2023 |
| 2023 |
| 2023 |
Gold (ounces) |
|
|
|
|
|
|
|
|
|
|
LaRonde mine |
| 48,162 |
| 61,920 |
| 62,413 |
| 54,043 |
| 226,538 |
LZ5 |
| 15,461 |
| 18,923 |
| 17,748 |
| 16,042 |
| 68,174 |
Canadian Malartic(iii)(v) |
| 71,809 |
| 168,257 |
| 164,974 |
| 165,518 |
| 570,558 |
Goldex |
| 35,917 |
| 37,114 |
| 35,517 |
| 31,692 |
| 140,240 |
Meliadine |
| 89,586 |
| 79,153 |
| 93,426 |
| 96,320 |
| 358,485 |
Meadowbank |
| 110,025 |
| 98,980 |
| 108,579 |
| 121,831 |
| 439,415 |
Kittila |
| 60,720 |
| 51,800 |
| 58,540 |
| 59,000 |
| 230,060 |
Detour Lake(v) |
| 163,294 |
| 160,281 |
| 149,747 |
| 177,083 |
| 650,405 |
Macassa(v) |
| 62,928 |
| 57,102 |
| 44,400 |
| 58,100 |
| 222,530 |
Fosterville |
| 89,000 |
| 85,500 |
| 60,750 |
| 49,000 |
| 284,250 |
Pinos Altos |
| 24,236 |
| 22,355 |
| 24,543 |
| 25,000 |
| 96,134 |
La India |
| 16,420 |
| 17,463 |
| 22,460 |
| 21,000 |
| 77,343 |
Total gold (ounces) |
| 787,558 |
| 858,848 |
| 843,097 |
| 874,629 |
| 3,364,132 |
Silver (thousands of ounces) |
| 552 |
| 597 |
| 571 |
| 634 |
| 2,354 |
Zinc (tonnes) |
| 2,131 |
| 2,743 |
| 2,108 |
| 1,544 |
| 8,526 |
Copper (tonnes) |
| 568 |
| 713 |
| 657 |
| 692 |
| 2,630 |
Notes:
| (i) | Certain previously reported line items have been restated to reflect the final purchase price allocation of the 50% Canadian Malartic acquired in the Yamana Transaction. |
| (ii) | Operating margin (a non-GAAP measure) is calculated as revenues from mining operations less production costs. Details by minesite are disclosed in the “Three Year Financial and Operating Summary” below. For a discussion of the composition and usefulness of operating margin, see “Non-GAAP Financial Performance Measures”. |
| (iii) | The information set out in this table reflects the Company’s 50% interest in Canadian Malartic up to and including March 30, 2023 and 100% interest thereafter following the closing of the Yamana Transaction. |
| (iv) | Payable production (a non-GAAP non-financial performance measure) is the quantity of mineral produced during a period contained in products that are or will be sold by the Company, whether such products are sold during the period or held as inventories at the end of the period. |
| (v) | Canadian Malartic’s payable metal sold excludes the 5.0% net smelter return royalty, a 2% in-kind royalty paid in respect of Detour Lake, a 1.5% in-kind royalty paid in respect of Macassa. |
66
AGNICO EAGLE MINES LIMITED
THREE YEAR FINANCIAL AND OPERATING SUMMARY
(thousands of United States dollars, except where noted)
|
| 2024 |
| 2023 |
| 2022 | |||
Revenues from mining operations |
| |
|
| |
|
| |
|
LaRonde mine | | $ | 588,839 | | $ | 483,065 | | $ | 553,931 |
LZ5 | |
| 181,475 | |
| 130,711 | |
| 129,569 |
LaRonde | |
| 770,314 | |
| 613,776 | |
| 683,500 |
Canadian Malartic(ii) | |
| 1,492,313 | |
| 1,124,480 | |
| 575,938 |
Goldex | |
| 321,346 | |
| 272,801 | |
| 250,512 |
Meliadine | |
| 890,243 | |
| 697,431 | |
| 677,713 |
Meadowbank | |
| 1,178,132 | |
| 858,209 | |
| 645,021 |
Hope Bay | |
| — | |
| — | |
| 144 |
Kittila | |
| 523,550 | |
| 448,719 | |
| 407,669 |
Detour Lake | |
| 1,582,974 | |
| 1,262,839 | |
| 1,188,741 |
Macassa | |
| 670,568 | |
| 431,827 | |
| 327,028 |
Fosterville | |
| 545,152 | |
| 552,468 | |
| 645,371 |
Pinos Altos | |
| 245,997 | |
| 212,876 | |
| 199,830 |
Creston Mascota | |
| — | |
| — | |
| 4,476 |
La India | |
| 65,164 | |
| 151,483 | |
| 135,219 |
Revenues from mining operations | |
| 8,285,753 | |
| 6,626,909 | |
| 5,741,162 |
Production costs | |
| 3,086,080 | |
| 2,933,263 | |
| 2,643,321 |
Operating margin(i) | |
| 5,199,673 | |
| 3,693,646 | |
| 3,097,841 |
Impairment loss | |
| — | |
| 787,000 | |
| 55,000 |
Amortization of property, plant and mine development | |
| 1,514,076 | |
| 1,491,771 | |
| 1,094,691 |
Revaluation gain | |
| — | |
| (1,543,414) | |
| — |
Exploration, corporate and other | |
| 864,042 | |
| 599,220 | |
| 832,727 |
Income before income and mining taxes | |
| 2,821,555 | |
| 2,359,069 | |
| 1,115,423 |
Income and mining taxes | |
| 925,974 | |
| 417,762 | |
| 445,174 |
Net income for the year | | $ | 1,895,581 | | $ | 1,941,307 | | $ | 670,249 |
Net income per share — basic | | $ | 3.79 | | $ | 3.97 | | $ | 1.53 |
Net income per share — diluted | | $ | 3.78 | | $ | 3.95 | | $ | 1.53 |
Cash provided by operating activities | | $ | 3,960,892 | | $ | 2,601,562 | | $ | 2,096,636 |
Cash used in investing activities | | $ | (2,007,114) | | $ | (2,760,783) | | $ | (710,458) |
Cash used in financing activities | | $ | (1,356,331) | | $ | (163,958) | | $ | (914,853) |
Dividends declared per share | | $ | 1.60 | | $ | 1.60 | | $ | 1.60 |
Capital expenditures per Consolidated Statements of Cash Flows | | $ | 1,817,949 | | $ | 1,654,129 | | $ | 1,538,237 |
Realized price per ounce of gold | | $ | 2,384 | | $ | 1,946 | | $ | 1,797 |
Realized price per ounce of silver | | $ | 28.85 | | $ | 23.72 | | $ | 21.63 |
Realized price per tonne of zinc | | $ | 2,755 | | $ | 2,705 | | $ | 3,440 |
Realized price per tonne of copper | | $ | 9,291 | | $ | 8,282 | | $ | 8,381 |
Weighted average number of common shares outstanding - basic (thousands) | |
| 499,904 | |
| 488,723 | |
| 437,678 |
Total assets | | $ | 29,987,018 | | $ | 28,684,949 | | $ | 23,494,808 |
Long-term debt | | $ | 1,052,956 | | $ | 1,743,086 | | $ | 1,242,070 |
Shareholders’ equity | | $ | 20,832,900 | | $ | 19,422,915 | | $ | 16,241,345 |
67
AGNICO EAGLE MINES LIMITED
THREE YEAR FINANCIAL AND OPERATING SUMMARY
(thousands of United States dollars, except where noted)
Operating Summary |
| 2024 |
| 2023 |
| 2022 | |||
LaRonde mine |
| |
|
| |
|
| |
|
Revenues from mining operations | | $ | 588,839 | | $ | 483,065 | | $ | 553,931 |
Production costs | |
| 239,309 | |
| 218,020 | |
| 213,393 |
Operating margin(i) | | $ | 349,530 | | $ | 265,045 | | $ | 340,538 |
Amortization of property, plant and mine development | |
| 119,295 | |
| 101,016 | |
| 79,067 |
Tonnes of ore milled | |
| 1,554,153 | |
| 1,501,481 | |
| 1,669,900 |
Gold — grams per tonne | |
| 4.91 | |
| 5.23 | |
| 5.62 |
Gold production — ounces | |
| 227,512 | |
| 235,991 | |
| 284,780 |
Silver production — thousands of ounces | |
| 577 | |
| 575 | |
| 609 |
Zinc production — tonnes | |
| 6,339 | |
| 7,663 | |
| 8,195 |
Copper production — tonnes | |
| 2,212 | |
| 2,543 | |
| 2,901 |
Production costs per ounce of gold produced ($per ounce basis) | | $ | 1,052 | | $ | 924 | | $ | 749 |
Total cash costs per ounce of gold produced - co-product basis(ii) | | $ | 1,137 | | $ | 1,067 | | $ | 850 |
By-product metal revenues | |
| (248) | |
| (227) | |
| (227) |
Total cash costs per ounce of gold produced - by-product basis(ii) | | $ | 889 | | $ | 840 | | $ | 623 |
Production costs per tonne | | C$ | 210 | | C$ | 196 | | C$ | 166 |
Minesite costs per tonne(iii) | | C$ | 208 | | C$ | 201 | | C$ | 162 |
LZ5 | |
|
| |
|
| |
|
|
Revenues from mining operations | | $ | 181,475 | | $ | 130,711 | | $ | 129,569 |
Production costs | |
| 80,186 | |
| 81,624 | |
| 72,096 |
Operating margin(i) | | $ | 101,289 | | $ | 49,087 | | $ | 57,473 |
Amortization of property, plant and mine development | |
| 17,824 | |
| 13,333 | |
| 8,927 |
Tonnes of ore milled | |
| 1,295,238 | |
| 1,156,915 | |
| 1,145,788 |
Gold — grams per tonne | |
| 2.06 | |
| 2.01 | |
| 2.05 |
Gold production — ounces | |
| 79,238 | |
| 70,657 | |
| 71,557 |
Silver production — thousands of ounces | |
| 12 | |
| 13 | |
| 13 |
Zinc production — tonnes | |
| — | |
| 39 | |
| — |
Copper production — tonnes | |
| 78 | |
| 35 | |
| — |
Production costs per ounce of gold produced ($per ounce basis) | | $ | 1,012 | | $ | 1,155 | | $ | 1,008 |
Total cash costs per ounce of gold produced - co-product basis(ii) | | $ | 1,118 | | $ | 1,158 | | $ | 1,025 |
By-product metal revenues | |
| (13) | |
| (10) | |
| (4) |
Total cash costs per ounce of gold produced - by-product basis(ii) | | $ | 1,105 | | $ | 1,148 | | $ | 1,021 |
Production costs per tonne | | C$ | 85 | | C$ | 95 | | C$ | 82 |
Minesite costs per tonne(iii) | | C$ | 90 | | C$ | 91 | | C$ | 81 |
68
AGNICO EAGLE MINES LIMITED
THREE YEAR FINANCIAL AND OPERATING SUMMARY
(thousands of United States dollars, except where noted)
LaRonde |
| 2024 |
| 2023 |
| 2022 | |||
Revenues from mining operations | | $ | 770,314 | | $ | 613,776 | | $ | 683,500 |
Production costs | |
| 319,495 | |
| 299,644 | |
| 285,489 |
Operating margin(i) | | $ | 450,819 | | $ | 314,132 | | $ | 398,011 |
Amortization of property, plant and mine development | |
| 137,119 | |
| 114,349 | |
| 87,994 |
Tonnes of ore milled | |
| 2,849,391 | |
| 2,658,396 | |
| 2,815,688 |
Gold — grams per tonne | |
| 3.62 | |
| 3.83 | |
| 4.17 |
Gold production — ounces | |
| 306,750 | |
| 306,648 | |
| 356,337 |
Silver production — thousands of ounces | |
| 589 | |
| 588 | |
| 622 |
Zinc production — tonnes | |
| 6,339 | |
| 7,702 | |
| 8,195 |
Copper production — tonnes | |
| 2,290 | |
| 2,578 | |
| 2,901 |
Production costs per ounce of gold produced ($per ounce basis) | | $ | 1,042 | | $ | 977 | | $ | 801 |
Total cash costs per ounce of gold produced - co-product basis(ii) | | $ | 1,132 | | $ | 1,088 | | $ | 885 |
By-product metal revenues | |
| (187) | |
| (177) | |
| (182) |
Total cash costs per ounce of gold produced - by-product basis(ii) | | $ | 945 | | $ | 911 | | $ | 703 |
Production costs per tonne | | C$ | 153 | | C$ | 152 | | C$ | 132 |
Minesite costs per tonne(iii) | | C$ | 154 | | C$ | 153 | | C$ | 129 |
Canadian Malartic(iv) | |
|
| |
|
| |
|
|
Revenues from mining operations | | $ | 1,492,313 | | $ | 1,124,480 | | $ | 575,938 |
Production costs | |
| 532,037 | |
| 465,814 | |
| 235,735 |
Operating margin(i) | | $ | 960,276 | | $ | 658,666 | | $ | 340,203 |
Amortization of property, plant and mine development | |
| 348,866 | |
| 340,737 | |
| 127,842 |
Tonnes of ore milled | |
| 20,317,261 | |
| 17,332,886 | |
| 9,769,942 |
Gold — grams per tonne | |
| 1.09 | |
| 1.17 | |
| 1.15 |
Gold production — ounces | |
| 655,654 | |
| 603,955 | |
| 329,396 |
Silver production — thousands of ounces | |
| 306 | |
| 311 | |
| 245 |
Production costs per ounce of gold produced ($per ounce basis) | | $ | 811 | | $ | 771 | | $ | 716 |
Total cash costs per ounce of gold produced - co-product basis(ii) | | $ | 943 | | $ | 835 | | $ | 803 |
By-product metal revenues | |
| (13) | |
| (11) | |
| (16) |
Total cash costs per ounce of gold produced - by-product basis(ii) | | $ | 930 | | $ | 824 | | $ | 787 |
Production costs per tonne | | C$ | 36 | | C$ | 36 | | C$ | 31 |
Minesite costs per tonne(iii) | | C$ | 41 | | C$ | 39 | | C$ | 35 |
69
AGNICO EAGLE MINES LIMITED
THREE YEAR FINANCIAL AND OPERATING SUMMARY
(thousands of United States dollars, except where noted)
Goldex |
| 2024 |
| 2023 |
| 2022 | |||
Revenues from mining operations | | $ | 321,346 | | $ | 272,801 | | $ | 250,512 |
Production costs | |
| 129,977 | |
| 112,022 | |
| 103,830 |
Operating margin(i) | | $ | 191,369 | | $ | 160,779 | | $ | 146,682 |
Amortization of property, plant and mine development | |
| 43,562 | |
| 39,069 | |
| 42,160 |
Tonnes of ore milled | |
| 3,075,697 | |
| 2,886,927 | |
| 2,940,103 |
Gold — grams per tonne | |
| 1.55 | |
| 1.74 | |
| 1.68 |
Gold production — ounces | |
| 130,813 | |
| 140,983 | |
| 141,502 |
Silver production — thousands of ounces | |
| 3 | |
| 2 | |
| 2 |
Copper production — tonnes | |
| 1,661 | |
| 39 | |
| — |
Production costs per ounce of gold produced ($per ounce basis) | | $ | 994 | | $ | 795 | | $ | 734 |
Total cash costs per ounce of gold produced - co-product basis(ii) | | $ | 1,041 | | $ | 822 | | $ | 765 |
By-product metal revenues | |
| (118) | |
| (2) | |
| — |
Total cash costs per ounce of gold produced - by-product basis(ii) | | $ | 923 | | $ | 820 | | $ | 765 |
Production costs per tonne | | C$ | 58 | | C$ | 52 | | C$ | 46 |
Minesite costs per tonne(iii) | | C$ | 59 | | C$ | 53 | | C$ | 47 |
Meliadine | |
|
| |
|
| |
|
|
Revenues from mining operations | | $ | 890,243 | | $ | 697,431 | | $ | 677,713 |
Production costs | |
| 350,280 | |
| 343,650 | |
| 318,141 |
Operating margin(i) | | $ | 539,963 | | $ | 353,781 | | $ | 359,572 |
Amortization of property, plant and mine development | |
| 202,834 | |
| 182,530 | |
| 155,482 |
Tonnes of ore milled | |
| 1,966,236 | |
| 1,918,143 | |
| 1,756,971 |
Gold — grams per tonne | |
| 6.22 | |
| 6.11 | |
| 6.83 |
Gold production — ounces | |
| 378,886 | |
| 364,141 | |
| 372,874 |
Silver production — thousands of ounces | |
| 34 | |
| 27 | |
| 35 |
Production costs per ounce of gold produced ($per ounce basis) | | $ | 924 | | $ | 944 | | $ | 853 |
Total cash costs per ounce of gold produced - co-product basis(ii) | | $ | 942 | | $ | 981 | | $ | 865 |
By-product metal revenues | |
| (2) | |
| (1) | |
| (2) |
Total cash costs per ounce of gold produced - by-product basis(ii) | | $ | 940 | | $ | 980 | | $ | 863 |
Production costs per tonne | | C$ | 243 | | C$ | 241 | | C$ | 232 |
Minesite costs per tonne(iii) | | C$ | 247 | | C$ | 249 | | C$ | 234 |
70
AGNICO EAGLE MINES LIMITED
THREE YEAR FINANCIAL AND OPERATING SUMMARY
(thousands of United States dollars, except where noted)
Meadowbank |
| 2024 |
| 2023 |
| 2022 | |||
Revenues from mining operations | | $ | 1,178,132 | | $ | 858,209 | | $ | 645,021 |
Production costs | |
| 463,464 | |
| 524,008 | |
| 442,681 |
Operating margin(i) | | $ | 714,668 | | $ | 334,201 | | $ | 202,340 |
Amortization of property, plant and mine development | |
| 148,414 | |
| 192,509 | |
| 117,068 |
Tonnes of ore milled | |
| 4,142,766 | |
| 3,842,649 | |
| 3,739,419 |
Gold — grams per tonne | |
| 4.18 | |
| 3.86 | |
| 3.40 |
Gold production — ounces | |
| 504,719 | |
| 431,666 | |
| 373,785 |
Silver production — thousands of ounces | |
| 142 | |
| 125 | |
| 103 |
Production costs per ounce of gold produced ($per ounce basis) | | $ | 918 | | $ | 1,214 | | $ | 1,184 |
Total cash costs per ounce of gold produced - co-product basis(ii) | | $ | 946 | | $ | 1,183 | | $ | 1,216 |
By-product metal revenues | |
| (8) | |
| (7) | |
| (6) |
Total cash costs per ounce of gold produced - by-product basis(ii) | | $ | 938 | | $ | 1,176 | | $ | 1,210 |
Production costs per tonne | | C$ | 153 | | C$ | 183 | | C$ | 154 |
Minesite costs per tonne(iii) | | C$ | 156 | | C$ | 179 | | C$ | 157 |
Kittila | |
|
| |
|
| |
|
|
Revenues from mining operations | | $ | 523,550 | | $ | 448,719 | | $ | 407,669 |
Production costs | |
| 227,334 | |
| 205,857 | |
| 210,661 |
Operating margin(i) | | $ | 296,216 | | $ | 242,862 | | $ | 197,008 |
Amortization of property, plant and mine development | |
| 117,679 | |
| 102,686 | |
| 96,975 |
Tonnes of ore milled | |
| 2,026,251 | |
| 1,954,215 | |
| 1,924,784 |
Gold — grams per tonne | |
| 4.11 | |
| 4.48 | |
| 4.13 |
Gold production — ounces | |
| 218,860 | |
| 234,402 | |
| 216,947 |
Silver production — thousands of ounces | |
| 17 | |
| 15 | |
| 13 |
Production costs per ounce of gold produced ($per ounce basis) | | $ | 1,039 | | $ | 878 | | $ | 971 |
Total cash costs per ounce of gold produced - co-product basis(ii) | | $ | 1,033 | | $ | 872 | | $ | 981 |
By-product metal revenues | |
| (2) | |
| (1) | |
| (1) |
Total cash costs per ounce of gold produced - by-product basis(ii) | | $ | 1,031 | | $ | 871 | | $ | 980 |
Production costs per tonne | | € | 103 | | € | 98 | | € | 103 |
Minesite costs per tonne(iii) | | € | 103 | | € | 99 | | € | 101 |
71
AGNICO EAGLE MINES LIMITED
THREE YEAR FINANCIAL AND OPERATING SUMMARY
(thousands of United States dollars, except where noted)
Detour Lake |
| 2024 | | 2023 | | 2022 | |||
Revenues from mining operations | | $ | 1,582,974 | | $ | 1,262,839 | | $ | 1,188,741 |
Production costs | |
| 497,079 | |
| 453,498 | |
| 489,703 |
Operating margin(i) | | $ | 1,085,895 | | $ | 809,341 | | $ | 699,038 |
Amortization of property, plant and mine development | |
| 185,972 | |
| 161,819 | |
| 200,360 |
Tonnes of ore milled | |
| 27,462,385 | |
| 25,434,854 | |
| 22,781,511 |
Gold — grams per tonne | |
| 0.85 | |
| 0.91 | |
| 0.97 |
Gold production — ounces | |
| 671,950 | |
| 677,446 | |
| 651,182 |
Silver production — thousands of ounces | |
| 107 | |
| 79 | |
| 125 |
Production costs per ounce of gold produced ($per ounce basis) | | $ | 740 | | $ | 669 | | $ | 752 |
Total cash costs per ounce of gold produced - co-product basis(ii) | | $ | 801 | | $ | 738 | | $ | 663 |
By-product metal revenues | |
| (5) | |
| (3) | |
| (6) |
Total cash costs per ounce of gold produced - by-product basis(ii) | | $ | 796 | | $ | 735 | | $ | 657 |
Production costs per tonne | | C$ | 25 | | C$ | 24 | | C$ | 28 |
Minesite costs per tonne(iii) | | C$ | 26 | | C$ | 26 | | C$ | 25 |
Macassa | |
|
| |
|
| |
|
|
Revenues from mining operations | | $ | 670,568 | | $ | 431,827 | | $ | 327,028 |
Production costs | |
| 201,371 | |
| 155,046 | |
| 129,774 |
Operating margin(i) | | $ | 469,197 | | $ | 276,781 | | $ | 197,254 |
Amortization of property, plant and mine development | |
| 169,272 | |
| 155,944 | |
| 83,780 |
Tonnes of ore milled | |
| 573,702 | |
| 441,588 | |
| 280,012 |
Gold — grams per tonne | |
| 15.55 | |
| 16.47 | |
| 20.47 |
Gold production — ounces | |
| 279,384 | |
| 228,535 | |
| 180,833 |
Silver production — thousands of ounces | |
| 38 | |
| 21 | |
| 17 |
Production costs per ounce of gold produced ($per ounce basis) | | $ | 721 | | $ | 678 | | $ | 718 |
Total cash costs per ounce of gold produced - co-product basis(ii) | | $ | 752 | | $ | 733 | | $ | 684 |
By-product metal revenues | |
| (4) | |
| (2) | |
| (1) |
Total cash costs per ounce of gold produced - by-product basis(ii) | | $ | 748 | | $ | 731 | | $ | 683 |
Production costs per tonne | | C$ | 482 | | C$ | 475 | | C$ | 602 |
Minesite costs per tonne(iii) | | C$ | 498 | | C$ | 503 | | C$ | 577 |
72
AGNICO EAGLE MINES LIMITED
THREE YEAR FINANCIAL AND OPERATING SUMMARY
(thousands of United States dollars, except where noted)
Fosterville |
| 2024 |
| 2023 |
| 2022 | |||
Revenues from mining operations | | $ | 545,152 | | $ | 552,468 | | $ | 645,371 |
Production costs | |
| 147,045 | |
| 131,298 | |
| 204,649 |
Operating margin(i) | | $ | 398,107 | | $ | 421,170 | | $ | 440,722 |
Amortization of property, plant and mine development | |
| 92,424 | |
| 88,044 | |
| 65,074 |
Tonnes of ore milled | |
| 809,475 | |
| 650,666 | |
| 524,007 |
Gold — grams per tonne | |
| 8.96 | |
| 13.61 | |
| 20.41 |
Gold production — ounces | |
| 225,203 | |
| 277,694 | |
| 338,327 |
Silver production — thousands of ounces | |
| 17 | |
| 20 | |
| 32 |
Production costs per ounce of gold produced ($per ounce basis) | | $ | 653 | | $ | 473 | | $ | 605 |
Total cash costs per ounce of gold produced - co-product basis(ii) | | $ | 650 | | $ | 489 | | $ | 379 |
By-product metal revenues | |
| (3) | |
| (1) | |
| (1) |
Total cash costs per ounce of gold produced - by-product basis(ii) | | $ | 647 | | $ | 488 | | $ | 378 |
Production costs per tonne | | A$ | 277 | | A$ | 304 | | A$ | 561 |
Minesite costs per tonne(iii) | | A$ | 276 | | A$ | 301 | | A$ | 356 |
Pinos Altos | | | | | | | | | |
Revenues from mining operations | | $ | 245,997 | | $ | 212,876 | | $ | 199,830 |
Production costs | |
| 168,231 | |
| 145,936 | |
| 144,489 |
Operating margin(i) | | $ | 77,766 | | $ | 66,940 | | $ | 55,341 |
Amortization of property, plant and mine development | |
| 45,943 | |
| 63,125 | |
| 57,459 |
Tonnes of ore processed | |
| 1,707,216 | |
| 1,656,466 | |
| 1,510,393 |
Gold — grams per tonne processed at the mill | |
| 1.69 | |
| 1.92 | |
| 2.07 |
Gold production — ounces | |
| 88,433 | |
| 97,642 | |
| 96,522 |
Silver production — thousands of ounces | |
| 1,198 | |
| 1,153 | |
| 1,014 |
Production costs per ounce of gold produced ($per ounce basis) | | $ | 1,902 | | $ | 1,495 | | $ | 1,497 |
Total cash costs per ounce of gold produced - co-product basis(ii) | | $ | 1,925 | | $ | 1,509 | | $ | 1,477 |
By-product metal revenues | |
| (395) | |
| (280) | |
| (228) |
Total cash costs per ounce of gold produced - by-product basis(ii) | | $ | 1,530 | | $ | 1,229 | | $ | 1,249 |
Production costs per tonne | | $ | 99 | | $ | 88 | | $ | 96 |
Minesite costs per tonne(iii) | | $ | 99 | | $ | 88 | | $ | 94 |
73
AGNICO EAGLE MINES LIMITED
THREE YEAR FINANCIAL AND OPERATING SUMMARY
(thousands of United States dollars, except where noted)
Creston Mascota |
| 2024 |
| 2023 |
| 2022 | |||
Revenues from mining operations | | $ | — | | $ | — | | $ | 4,476 |
Production costs | |
| — | |
| — | |
| 1,943 |
Operating margin(i) | | $ | — | | $ | — | | $ | 2,533 |
Amortization of property, plant and mine development | |
| 9 | |
| — | |
| — |
Tonnes of ore processed | |
| — | |
| — | |
| — |
Gold — grams per tonne | |
| — | |
| — | |
| — |
Gold production — ounces | |
| 104 | |
| 638 | |
| 2,630 |
Silver production — thousands of ounces | |
| — | |
| 1 | |
| 7 |
Production costs per ounce of gold produced ($per ounce basis) | | $ | — | | $ | — | | $ | 739 |
Total cash costs per ounce of gold produced - co-product basis(ii) | | $ | — | | $ | — | | $ | 853 |
By-product metal revenues | |
| — | |
| — | |
| (60) |
Total cash costs per ounce of gold produced - by-product basis(ii) | | $ | — | | $ | — | | $ | 793 |
Production costs per tonne | | $ | — | | $ | — | | $ | — |
Minesite costs per tonne(iii)(v) | | $ | — | | $ | — | | $ | — |
La India | |
|
| |
|
| |
|
|
Revenues from mining operations | | $ | 65,164 | | $ | 151,483 | | $ | 135,219 |
Production costs | |
| 49,767 | |
| 96,490 | |
| 76,226 |
Operating margin(i) | | $ | 15,397 | | $ | 54,993 | | $ | 58,993 |
Amortization of property, plant and mine development | |
| 9,508 | |
| 37,140 | |
| 49,373 |
Tonnes of ore processed | |
| — | |
| 3,009,922 | |
| 5,101,814 |
Gold — grams per tonne | |
| — | |
| 0.87 | |
| 0.59 |
Gold production — ounces | |
| 24,580 | |
| 75,904 | |
| 74,672 |
Silver production — thousands of ounces | |
| 34 | |
| 66 | |
| 77 |
Production costs per ounce of gold produced ($per ounce basis) | | $ | 2,025 | | $ | 1,271 | | $ | 1,021 |
Total cash costs per ounce of gold produced - co-product basis(ii) | | $ | 1,987 | | $ | 1,261 | | $ | 1,078 |
By-product metal revenues | |
| (42) | |
| (20) | |
| (22) |
Total cash costs per ounce of gold produced - by-product basis(ii) | | $ | 1,945 | | $ | 1,241 | | $ | 1,056 |
Production costs per tonne | | $ | — | | $ | 32 | | $ | 15 |
Minesite costs per tonne(iii)(vi) | | $ | — | | $ | 32 | | $ | 16 |
Notes:
| (i) | Operating margin is calculated as revenues from mining operations less production costs. Operating margin is not a recognized measure under IFRS and may not be comparable to data reported by other gold producers. Refer to “Non-GAAP Financial Performance Measures - Operating Margin” in this MD&A for additional details. |
| (ii) | The total cash costs per ounce of gold produced is not a recognized measure under IFRS and this data may not be comparable to data reported by other gold producers. Refer to “Non-GAAP Financial Performance Measures” and “Non-GAAP Financial Performance Measures - Total Cash Costs Per Ounce of Gold Produced and Minesite Costs per Tonne” in this MD&A for additional details. |
| (iii) | Minesite costs per tonne is not a recognized measure under IFRS and this data may not be comparable to data reported by other gold producers. Refer to “Non-GAAP Financial Performance Measures” and “Non-GAAP Financial Performance Measures - Total Cash Costs Per Ounce of Gold Produced and Minesite Costs per Tonne” in this MD&A for additional details. |
| (iv) | The information set out in this table for the year ended December 31, 2023 reflects the Company’s 50% interest in the Canadian Malartic complex up to and including March 30, 2023 and 100% interest thereafter. The information set out in this table for the year ended December 31, 2022 reflects the contributions from Detour Lake, Macassa and Fosterville for the year ended December 31, 2022 reflects the period from February 8 to December 31, 2022. |
| (v) | Creston Mascota’s cost data per tonne for the year ended December 31, 2022 exclude approximately $2.2 million of production costs incurred during the period, following the cessation of mining activities at the Bravo pit during the third quarter of 2020. |
74