Exhibit (c)(ii)
Project Frontenac Preliminary Report to the Special Committee May 8, 2021 A Confidential Presentation
Disclaimer Disclaimer These materials were prepared exclusively for the benefit and internal use of the Special Committee of the board of directors of EXFO in order to assist the Special Committee in considering and evaluating, on a preliminary basis, potential values of the Subordinate Voting Shares of EXFO in connection with a non-binding proposal made by G. Lamonde Investissements Financiers Inc. dated March 15, 2021. These materials were prepared on a confidential basis solely and exclusively for the use of the Special Committee and not with a view to public disclosure (whether under Canadian or U.S. securities laws or otherwise). The information in these materials is preliminary and for discussion purposes only. These materials may not be used for any purpose other than as may be specifically contemplated by a written agreement with TD Securities. These materials and the information contained herein does not purport to identify or suggest all of the risks (direct or indirect) which may be associated with any possible transaction or provide any advice or conclusion as to the value of the Subordinate Voting Shares of EXFO.In preparing this document, we: (i) used information obtained from the Company and public sources; (ii) assumed and relied upon, without independent verification, the accuracy and completeness of the information supplied or otherwise made available to us for the purposes of this document; and (iii) assumed that the financial projections and other financial data relating to the Company have been reasonably and properly prepared on bases reflecting the best currently available estimates and judgments of the future financial performance of the Company as at the date of this document.Neither we, our affiliates nor any of our or their respective directors, officers, employees or agents gives any representation or warranty, express or implied, as to: (i) the achievement or reasonableness of future projections, management targets, estimates, prospects or returns contained in this document, if any; or (ii) the accuracy or completeness of any information contained in this document, any oral information provided in connection therewith or any data that either generates.This document does not contain any advice and in connection hereto no employee, affiliate, advisor or representative of TD Securities owes you any fiduciary duty. We reserve the right to alter or update this document as we see fit. This document is not a financial opinion or recommendation by TD Securities.The information in this presentation reflects prevailing conditions and our views as of this date, all of which are accordingly subject to change. TD Securities' opinions and estimates constitute TD Securities' judgment and should be regarded as indicative, preliminary and for illustrative purposes only. In preparing the materials, TD Securities has relied upon documents and information prepared or supplied to TD Securities from the Company and other sources, without independent verification by TD Securities. Any estimates and projections contained herein have been based upon estimates and projections contained in such documents and third party sources and there is no assurance that such estimates and projections will be realized. Neither TD Securities nor any of its employees, affiliates, advisors or representatives makes any representations (express or implied) as to the accuracy or completeness of such information contained herein and nothing contained herein is or shall be construed or relied upon as, a representation, whether as to the past, present or future. Nothing herein should be construed as tax, accounting or legal advice. TD Securities does not have any obligation to update or otherwise revise the materials and information contained herein.TD Securities believes that these materials must be considered as a whole and that selecting portions of the analyses and the factors considered by TD Securities, without considering all of the factors and analyses together, could create a misleading view of the presentation. The preparation of a presentation such as this is complex and is not necessarily susceptible to partial analysis or summary description. Any attempt to do so could lend to undue emphasis on any particular factor or analysis.Any market valuations contained herein are indicative values as of the time and date indicated. Such market valuations as well as any calculations are believed to be reliable, but TD Securities does not warrant their completeness or accuracy. Any price or valuation constitutes our judgment and are subject to change without notice. Investors should understand that statements regarding future prospects may not be realized. TD Securities cannot guarantee that different prices and/or valuations would not be available elsewhere and suggests that valuations from other sources be obtained for comparison. Actual quotations could differ subject to market conditions.These materials must not be disclosed, copied or reproduced, distributed or passed to others at any time without the prior written consent of TD Securities.Notwithstanding anything herein to the contrary, the Company and each of its employees, representatives or other agents may disclose to any and all persons, without limitation of any kind, the U.S. federal and state income tax structure of the transactions contemplated hereby and all materials of any kind (including opinions or other tax analyses) that are provided to the Company relating to such tax treatment and tax structure insofar as such treatment and/or structure relates to a U.S. federal or state income tax strategy provided to the Company by TD Securities.TD Securities' policies prohibit employees from offering, directly or indirectly, a favorable research rating or specific price target, or offering to change a rating or price target, to a subject company as consideration or inducement for the receipt of business or for compensation. TD Securities also prohibits its research analysts from being compensated for involvement in investment banking transactions except to the extent that such participation is intended to benefit investors.TD Securities will not be liable to the Company or any third party, whether for negligence, breach of contract or otherwise, for any loss or damage of whatsoever nature suffered by the Company or a third party (including, without limitation, direct loss or damage, indirect or consequential loss or damage, loss of goodwill, loss of business opportunity, loss of data or loss of profit), arising from TD Securities providing you with these materials or the information contained herein."TD Securities" is a trademark of The Toronto-Dominion Bank and represents TD Securities Inc., TD Securities (USA) LLC, TD Securities Limited, TD Global Finance unlimited company and certain investment and corporate banking activities of The Toronto-Dominion Bank and its subsidiaries. TD Securities Inc. is registered in the category of Investment Dealer in each of the provinces and territories of Canada and is a member of the Investment Industry Regulatory Organization of Canada. TD Securities (USA) LLC is a registered broker-dealer and a member of the Financial Industry Regulatory Authority. The Toronto-Dominion Bank is authorized in the United Kingdom by the Prudential Regulation Authority and subject to regulation by the Financial Conduct Authority and limited regulation by the Prudential Regulation Authority. TD Bank Europe Limited is authorized by the Prudential Regulation Authority and regulated by the Financial Conduct Authority and limited regulation by the Prudential Regulation Authority. TD Securities Limited is authorized and regulated by the Financial Conduct Authority. TD Global Finance unlimited company is regulated by the Central Bank of Ireland. All logos are property of their respective owners and are for identification purposes only. Use of these names, logos, and brands does not imply endorsement.These materials do not constitute a commitment by any TD Securities entity to underwrite, subscribe for or place any securities or to extend or arrange credit or to provide any other services. Nothing in these materials should be construed as, and may not be used in connection with, an offer to sell, or a solicitation of an offer to buy or hold, an interest in any security or investment product. Final terms and conditions, if any, for any transaction discussed herein will be subject to a variety of reviews and approvals as well as market conditions.
Table of Contents 3 1 Situation Overview 4 2 Company and Market Overview 8 3 Management Forecast 20 4 Preliminary Indications of Value 23 Appendices A WACC Analysis 34 The analysis presented in this document is not a formal valuation of EXFO or any of its securities or assets, or a fairness opinion with respect to the Proposed Transaction. This document has been prepared solely for the purpose of outlining, on a preliminary basis, certain matters considered by TD Securities to date as part of its preparation of the Valuation. This preliminary report is summary in nature.
Situation Overview
Situation Overview 5 TD Securities understands that Germain Lamonde (through G. Lamonde Investissements Financiers Inc.), Founder and Executive Chairman of EXFO Inc. ("EXFO" or the "Company"), has submitted a non-binding proposal to the board of directors (the "Board") of EXFO to acquire all of the outstanding subordinate voting shares of EXFO (the "Subordinate Voting Shares") not held by Germain Lamonde (the "Proposed Transaction" or "Offer") for US$5.25 in cash per Subordinate Voting Share (the "Consideration")Offer represents a 22% premium to the closing price on the NASDAQ on March 15, 2021 (the "Initial Offer Date") and a 41% premium to the current trading price (closing price on May 6, 2021)We also understand that Germain Lamonde currently has an ~61.5% economic interest and an ~93.5% voting interest in EXFO through his ownership of Subordinate Voting Shares and 100% of the outstanding Multiple Voting Shares of the CompanyHe has indicated that he will not consider any alternative proposal to acquire EXFO by a third party or any other alternative transactionTD Securities' mandate includes the preparation and delivery to the special committee of independent directors of EXFO (the "Special Committee") of:A formal valuation (the "Valuation") of the Subordinate Voting Shares in accordance with the requirements of Regulation 61-101 of the Autorité des marches financiers and Multilateral Instrument 61-101 of the Ontario Securities Commission; andIf requested, an opinion (the "Fairness Opinion") as to the fairness, from a financial point of view, of the Consideration to be received by the shareholders of EXFO, other than Germain Lamonde, in connection with the Proposed TransactionThis presentation provides preliminary indications of value of the Subordinate Voting SharesThe preliminary report has been prepared on the basis of securities markets, economic and general business and financial conditions prevailing on the date hereofThe preliminary analysis herein should be considered indicative and subject to change based on TD Securities' ongoing workAll figures in this preliminary report are in US$ unless otherwise indicated
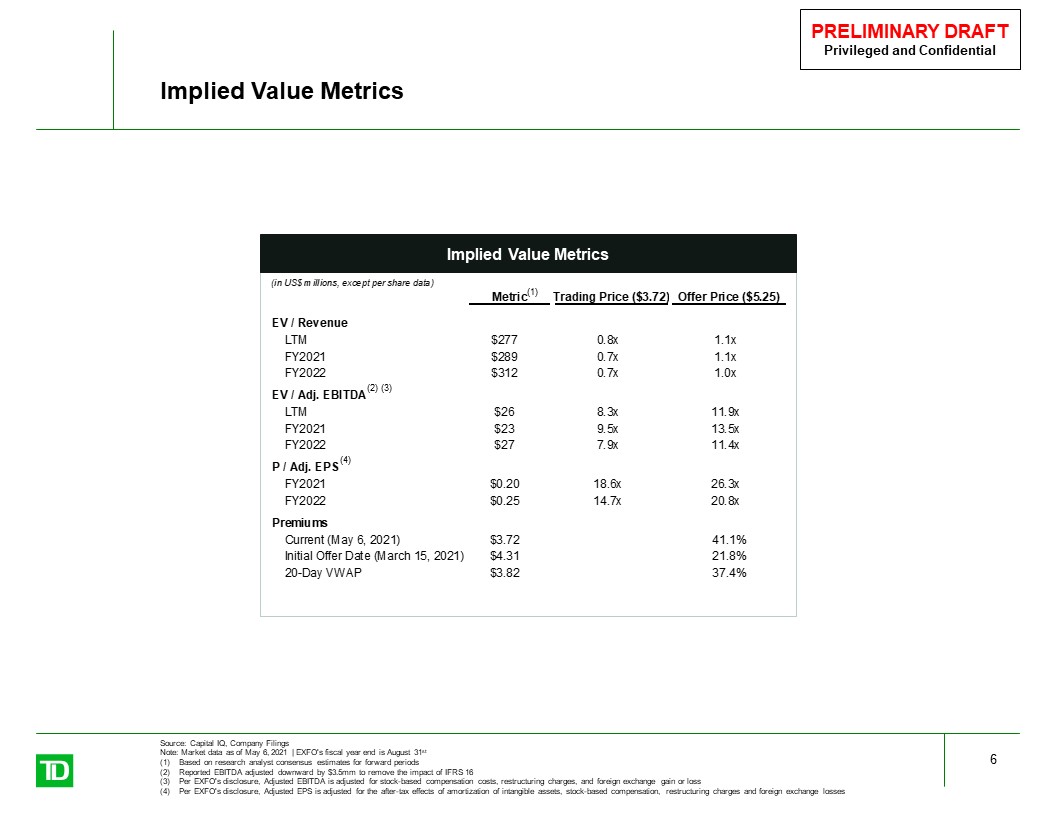
Implied Value Metrics Source: Capital IQ, Company FilingsNote: Market data as of May 6, 2021 | EXFO's fiscal year end is August 31st Based on research analyst consensus estimates for forward periodsReported EBITDA adjusted downward by $3.5mm to remove the impact of IFRS 16Per EXFO's disclosure, Adjusted EBITDA is adjusted for stock-based compensation costs, restructuring charges, and foreign exchange gain or lossPer EXFO's disclosure, Adjusted EPS is adjusted for the after-tax effects of amortization of intangible assets, stock-based compensation, restructuring charges and foreign exchange losses 6 Implied Value Metrics (1) (2) (3) (4)
Scope of Review 7 In connection with this Preliminary Report to the Special Committee, TD Securities reviewed and relied upon (without attempting to verify independently the completeness, accuracy or reasonableness of) or carried out, among other things, the following:non-binding proposal from G. Lamonde Investissements Financiers Inc. dated March 15, 2021;audited financial statements of EXFO and related management’s discussion and analysis for the fiscal years ended August 31, 2018, 2019 and 2020;unaudited financial statements of EXFO and related management’s discussion and analysis for the fiscal quarters ended November 30, 2020, and February 28, 2021;other securities regulatory filings of EXFO for the fiscal years ended August 31, 2018, 2019 and 2020;unaudited projected financial and operational information for EXFO for the fiscal years ending August 31, 2021 through August 31, 2026 prepared by management of EXFO (the "Management Forecast");various financial, operational and corporate information regarding EXFO prepared or provided by management of EXFO; discussions with senior management of EXFO with respect to the information referred to above and other issues and matters considered relevant;discussions with the offeror, German Lamonde, Founder and Executive Chairman of EXFO;discussions with members of the Special Committee with respect to the matters noted above and other matters considered relevant; various research publications prepared by industry and equity research analysts regarding EXFO and other selected public entities considered relevant; public information relating to the business, operations, financial performance and security trading history of EXFO and other selected public entities considered relevant;public information with respect to certain other transactions of a comparable nature considered relevant; and such other corporate, industry, and financial market information, investigations and analyses as TD Securities considered necessary or appropriate in the circumstances.TD Securities did not meet with the auditors of EXFO and has assumed the accuracy, completeness and fair presentation of, and has relied upon, without independent verification, the financial statements of EXFO and any reports of the auditors thereon.
Company and Market Overview
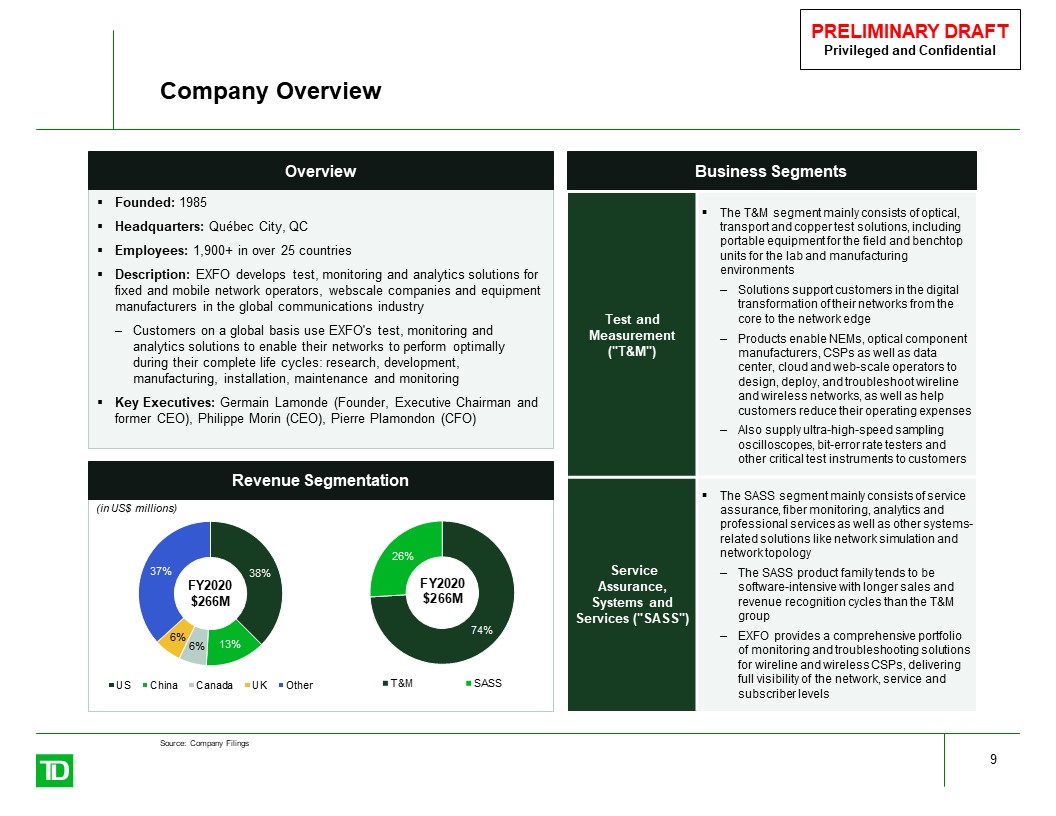
Company Overview 9 Founded: 1985Headquarters: Québec City, QCEmployees: 1,900+ in over 25 countriesDescription: EXFO develops test, monitoring and analytics solutions for fixed and mobile network operators, webscale companies and equipment manufacturers in the global communications industryCustomers on a global basis use EXFO's test, monitoring and analytics solutions to enable their networks to perform optimally during their complete life cycles: research, development, manufacturing, installation, maintenance and monitoringKey Executives: Germain Lamonde (Founder, Executive Chairman and former CEO), Philippe Morin (CEO), Pierre Plamondon (CFO) Overview Business Segments Revenue Segmentation Test and Measurement ("T&M") The T&M segment mainly consists of optical, transport and copper test solutions, including portable equipment for the field and benchtop units for the lab and manufacturing environmentsSolutions support customers in the digital transformation of their networks from the core to the network edgeProducts enable NEMs, optical component manufacturers, CSPs as well as data center, cloud and web-scale operators to design, deploy, and troubleshoot wireline and wireless networks, as well as help customers reduce their operating expensesAlso supply ultra-high-speed sampling oscilloscopes, bit-error rate testers and other critical test instruments to customers Service Assurance,Systems and Services ("SASS") The SASS segment mainly consists of service assurance, fiber monitoring, analytics and professional services as well as other systems-related solutions like network simulation and network topologyThe SASS product family tends to be software-intensive with longer sales and revenue recognition cycles than the T&M groupEXFO provides a comprehensive portfolio of monitoring and troubleshooting solutions for wireline and wireless CSPs, delivering full visibility of the network, service and subscriber levels (in US$ millions) Source: Company Filings

Driver Key Elements Comments 5G Converged coreCloud RANInfrastructure investmentsNetwork slicingOptimizing capex/opex Investment in 5G is a big factor driving the telecoms software and services industry. Such investments drive software spending for the network itself, for network orchestration and automation and for improvements to OSS and BSS. Cloud Moving current payloads to public cloudCloud native developmentCloud technology for telecoms networksPlatform data services/AIEdge computing Cloud is disrupting the way in which all industries work, including telecoms. The biggest near-term issue is moving existing payloads to the cloud. However, there is a greater emphasis on using software offered as a service, generally in the public cloud and for new cloud-native development, including of the network itself. Enterprise Services SD WANIoT ecosystemsCloud IT servicesEnterprise digital experience/self servicePrivate 5G Communications service providers ("CSPs") are placing a greater emphasis on enterprise services. There are a range of drivers including cloud IT services and IoT. SD-WAN provides lower costs and faster deployments, thereby enabling new use cases. Enterprises now expect self-service through a digital experience. Digital Transformation Digital experienceAutomated customer journeysCloud loop automation/lower TCOUse of cloud services/SaaSCulture change (to be like cloud providers) The telecoms industry has been pushing digital transformation for some time and is now getting significant pay-off. Nearly all CSPs have deployed and are improving digital customer channels. Increased levels of automation lower network operational costs. All this has been made possible by underlying changes to enable the use of cloud methods and more cloud services. Network Disaggregation Impact of virtual networksInfrastructure capex changesInfrastructure as real estateCell densificationPrivate 5G Digital transformation has led to network disaggregation. The full vertical integration of networks and services is no longer necessary nor always efficient. Investors such as towercos, fibrecos and hosting centres provide wholesale access to fundamental infrastructure used by many retail service providers. Telecoms Services Industry Drivers 10 Source: Analysys Mason
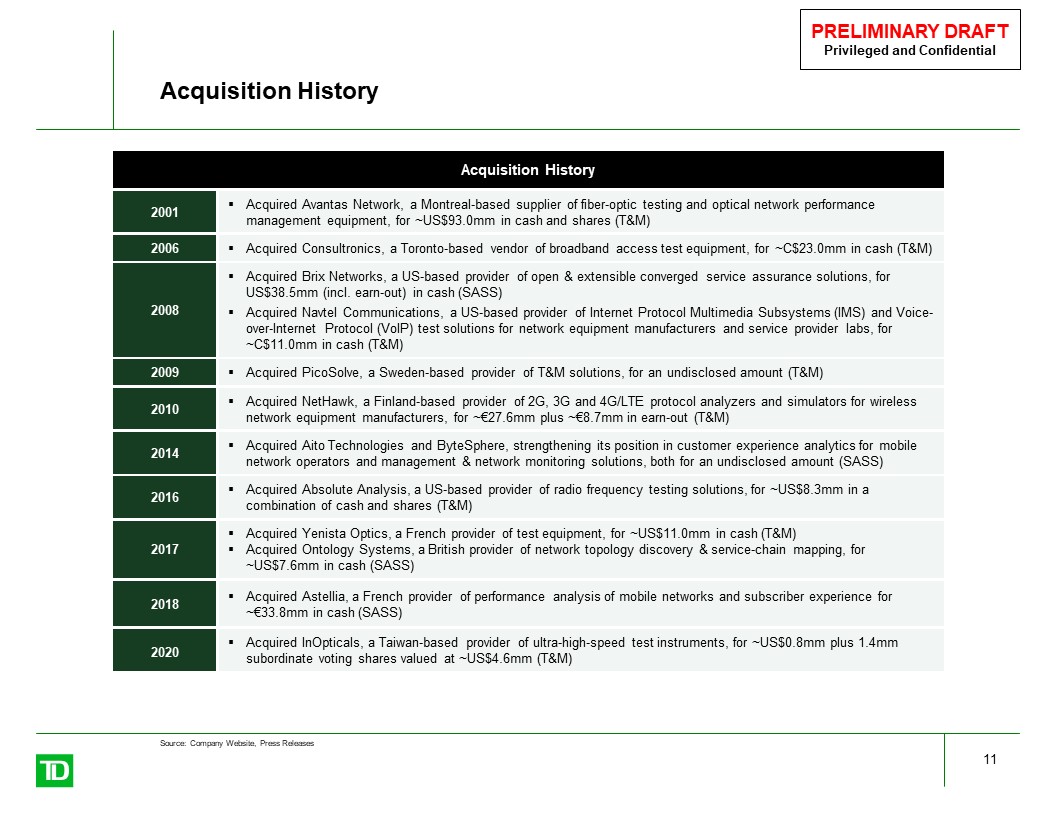
Acquisition History 11 Acquisition History 2001 Acquired Avantas Network, a Montreal-based supplier of fiber-optic testing and optical network performance management equipment, for ~US$93.0mm in cash and shares (T&M) 2006 Acquired Consultronics, a Toronto-based vendor of broadband access test equipment, for ~C$23.0mm in cash (T&M) 2008 Acquired Brix Networks, a US-based provider of open & extensible converged service assurance solutions, for US$38.5mm (incl. earn-out) in cash (SASS)Acquired Navtel Communications, a US-based provider of Internet Protocol Multimedia Subsystems (IMS) and Voice-over-Internet Protocol (VoIP) test solutions for network equipment manufacturers and service provider labs, for ~C$11.0mm in cash (T&M) 2009 Acquired PicoSolve, a Sweden-based provider of T&M solutions, for an undisclosed amount (T&M) 2010 Acquired NetHawk, a Finland-based provider of 2G, 3G and 4G/LTE protocol analyzers and simulators for wireless network equipment manufacturers, for ~€27.6mm plus ~€8.7mm in earn-out (T&M) 2014 Acquired Aito Technologies and ByteSphere, strengthening its position in customer experience analytics for mobile network operators and management & network monitoring solutions, both for an undisclosed amount (SASS) 2016 Acquired Absolute Analysis, a US-based provider of radio frequency testing solutions, for ~US$8.3mm in a combination of cash and shares (T&M) 2017 Acquired Yenista Optics, a French provider of test equipment, for ~US$11.0mm in cash (T&M)Acquired Ontology Systems, a British provider of network topology discovery & service-chain mapping, for ~US$7.6mm in cash (SASS) 2018 Acquired Astellia, a French provider of performance analysis of mobile networks and subscriber experience for ~€33.8mm in cash (SASS) 2020 Acquired InOpticals, a Taiwan-based provider of ultra-high-speed test instruments, for ~US$0.8mm plus 1.4mm subordinate voting shares valued at ~US$4.6mm (T&M) Source: Company Website, Press Releases
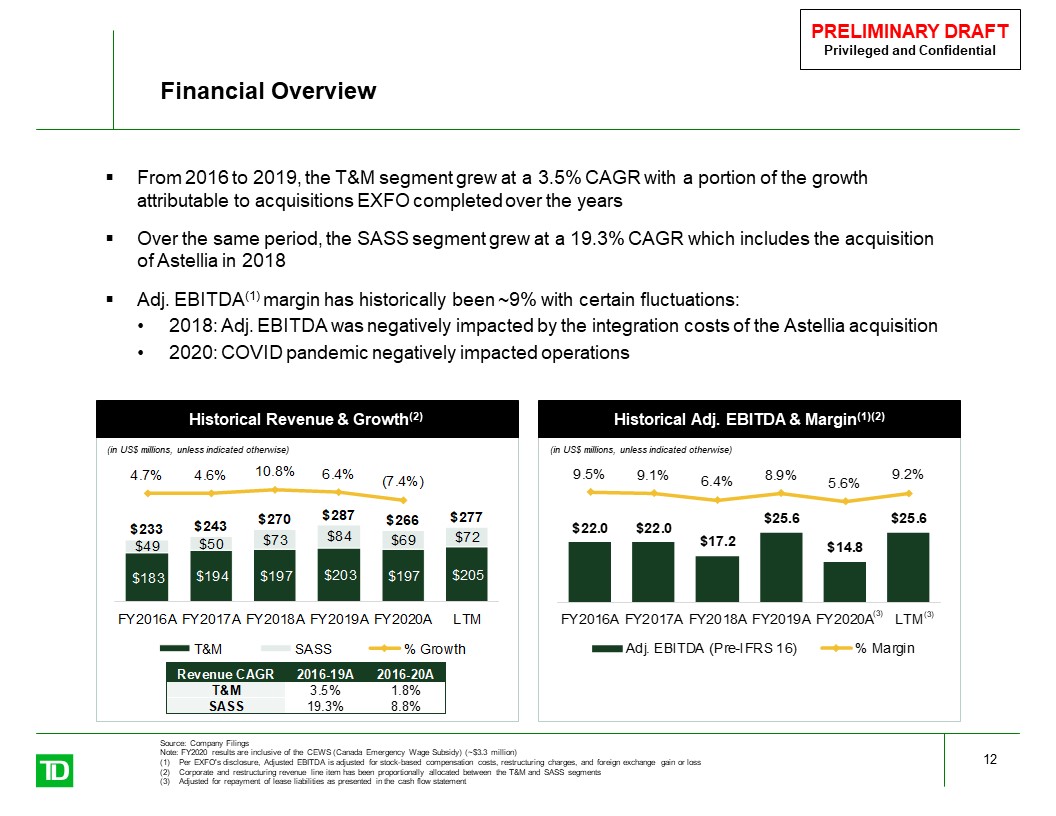
Financial Overview 12 (in US$ millions, unless indicated otherwise) Historical Adj. EBITDA & Margin(1)(2) (in US$ millions, unless indicated otherwise) Historical Revenue & Growth(2) From 2016 to 2019, the T&M segment grew at a 3.5% CAGR with a portion of the growth attributable to acquisitions EXFO completed over the yearsOver the same period, the SASS segment grew at a 19.3% CAGR which includes the acquisition of Astellia in 2018Adj. EBITDA(1) margin has historically been ~9% with certain fluctuations:2018: Adj. EBITDA was negatively impacted by the integration costs of the Astellia acquisition 2020: COVID pandemic negatively impacted operations Source: Company FilingsNote: FY2020 results are inclusive of the CEWS (Canada Emergency Wage Subsidy) (~$3.3 million)Per EXFO's disclosure, Adjusted EBITDA is adjusted for stock-based compensation costs, restructuring charges, and foreign exchange gain or lossCorporate and restructuring revenue line item has been proportionally allocated between the T&M and SASS segmentsAdjusted for repayment of lease liabilities as presented in the cash flow statement (3) (3)
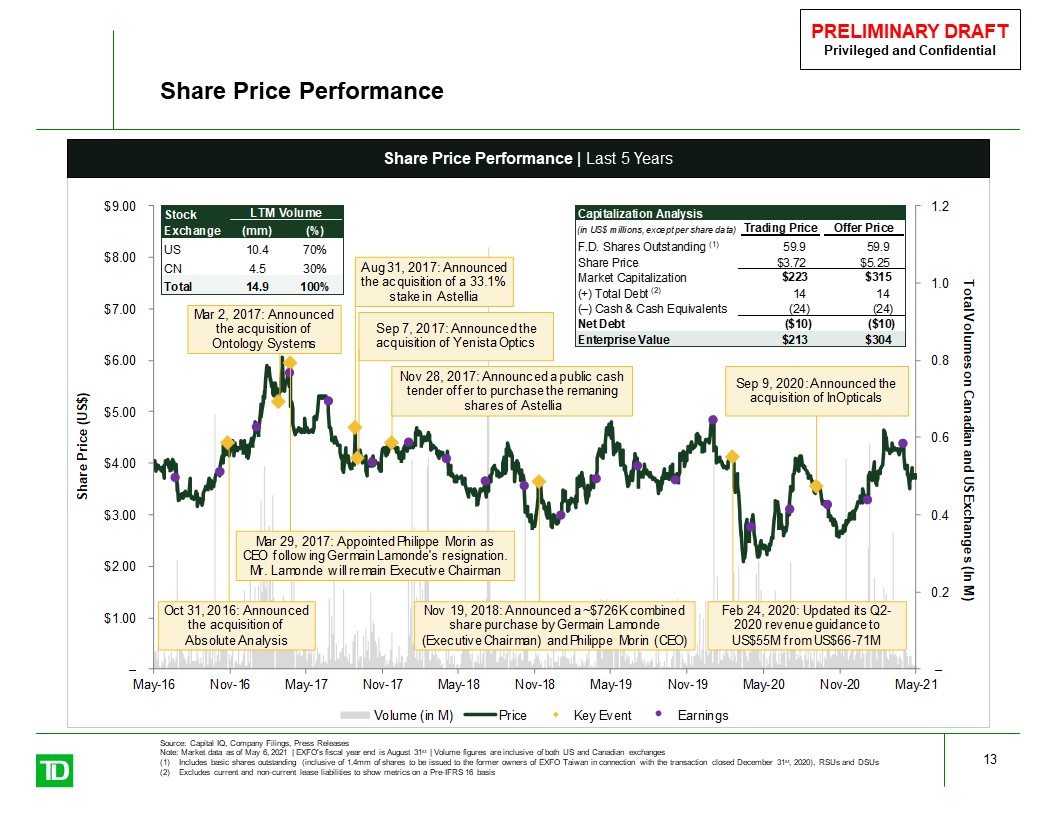
Share Price Performance 13 Share Price Performance | Last 5 Years (1) (2) Source: Capital IQ, Company Filings, Press ReleasesNote: Market data as of May 6, 2021 | EXFO's fiscal year end is August 31st | Volume figures are inclusive of both US and Canadian exchangesIncludes basic shares outstanding (inclusive of 1.4mm of shares to be issued to the former owners of EXFO Taiwan in connection with the transaction closed December 31st, 2020), RSUs and DSUsExcludes current and non-current lease liabilities to show metrics on a Pre-IFRS 16 basis
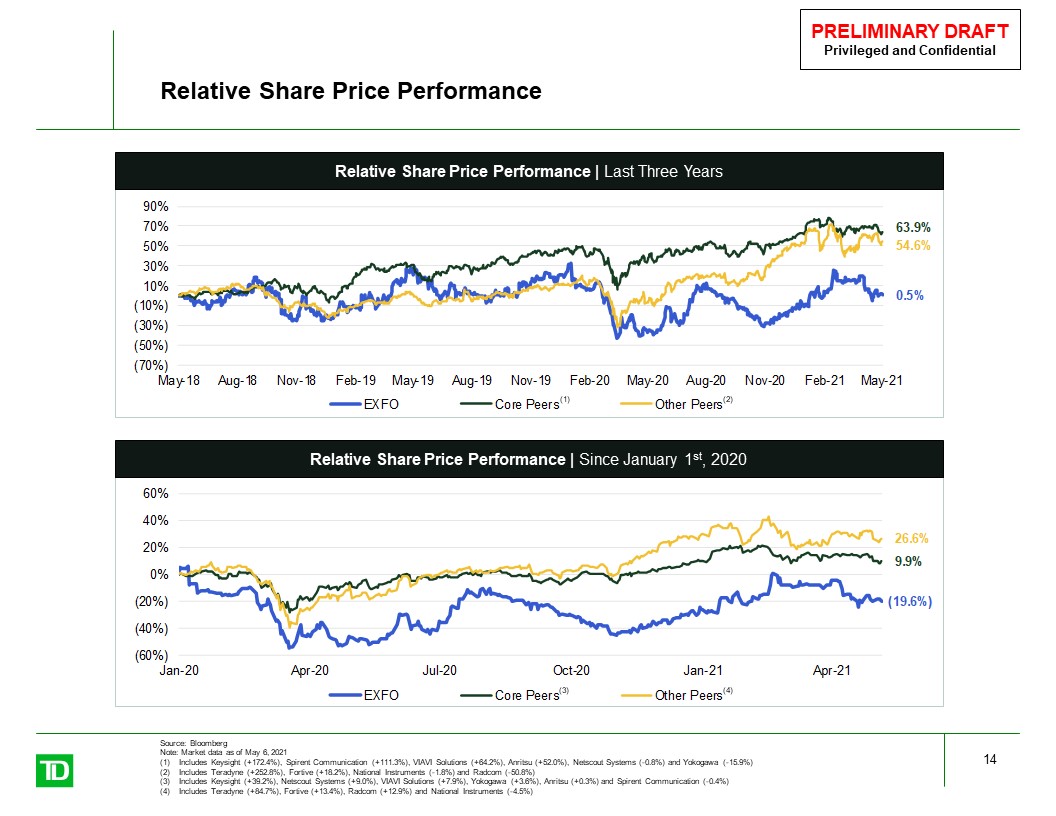
Relative Share Price Performance 14 Source: BloombergNote: Market data as of May 6, 2021Includes Keysight (+172.4%), Spirent Communication (+111.3%), VIAVI Solutions (+64.2%), Anritsu (+52.0%), Netscout Systems (-0.8%) and Yokogawa (-15.9%) Includes Teradyne (+252.8%), Fortive (+18.2%), National Instruments (-1.8%) and Radcom (-50.8%) Includes Keysight (+39.2%), Netscout Systems (+9.0%), VIAVI Solutions (+7.9%), Yokogawa (+3.6%), Anritsu (+0.3%) and Spirent Communication (-0.4%) Includes Teradyne (+84.7%), Fortive (+13.4%), Radcom (+12.9%) and National Instruments (-4.5%) (1) (2) Relative Share Price Performance | Last Three Years Relative Share Price Performance | Since January 1st, 2020 (3) (4)
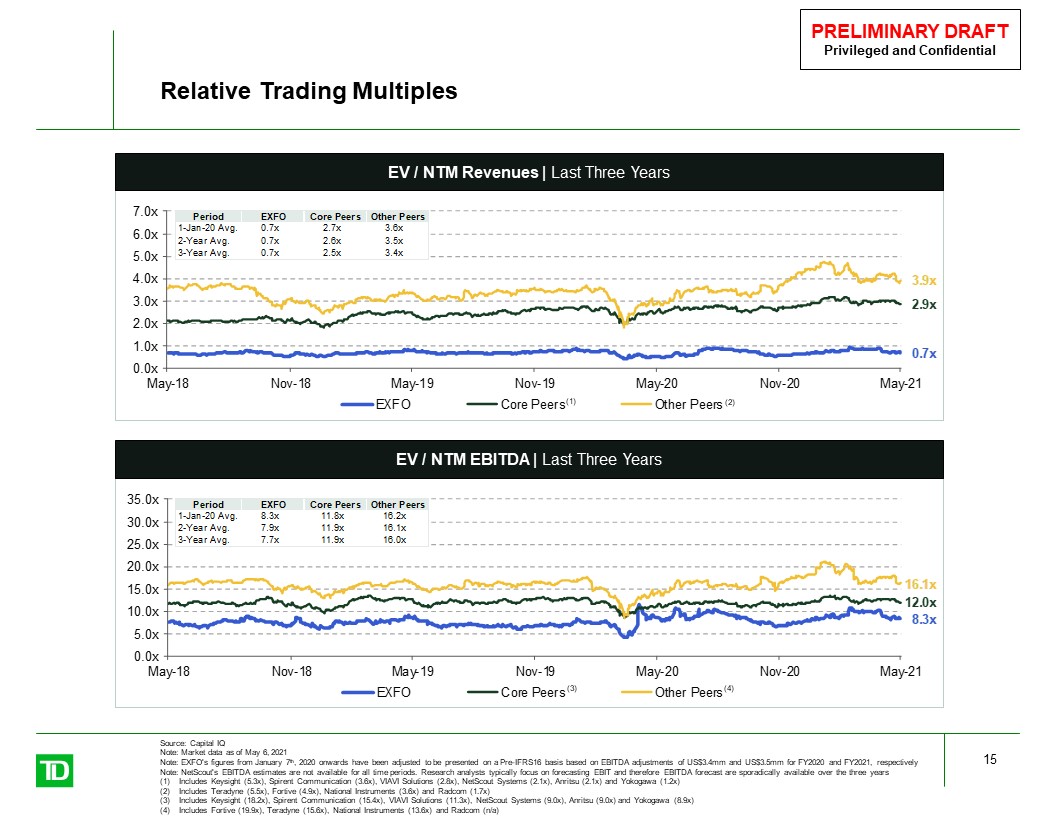
Relative Trading Multiples 15 Source: Capital IQ Note: Market data as of May 6, 2021Note: EXFO's figures from January 7th, 2020 onwards have been adjusted to be presented on a Pre-IFRS16 basis based on EBITDA adjustments of US$3.4mm and US$3.5mm for FY2020 and FY2021, respectivelyNote: NetScout's EBITDA estimates are not available for all time periods. Research analysts typically focus on forecasting EBIT and therefore EBITDA forecast are sporadically available over the three yearsIncludes Keysight (5.3x), Spirent Communication (3.6x), VIAVI Solutions (2.8x), NetScout Systems (2.1x), Anritsu (2.1x) and Yokogawa (1.2x)Includes Teradyne (5.5x), Fortive (4.9x), National Instruments (3.6x) and Radcom (1.7x)Includes Keysight (18.2x), Spirent Communication (15.4x), VIAVI Solutions (11.3x), NetScout Systems (9.0x), Anritsu (9.0x) and Yokogawa (8.9x)Includes Fortive (19.9x), Teradyne (15.6x), National Instruments (13.6x) and Radcom (n/a) (3) (4) (1) (2) EV / NTM EBITDA | Last Three Years EV / NTM Revenues | Last Three Years
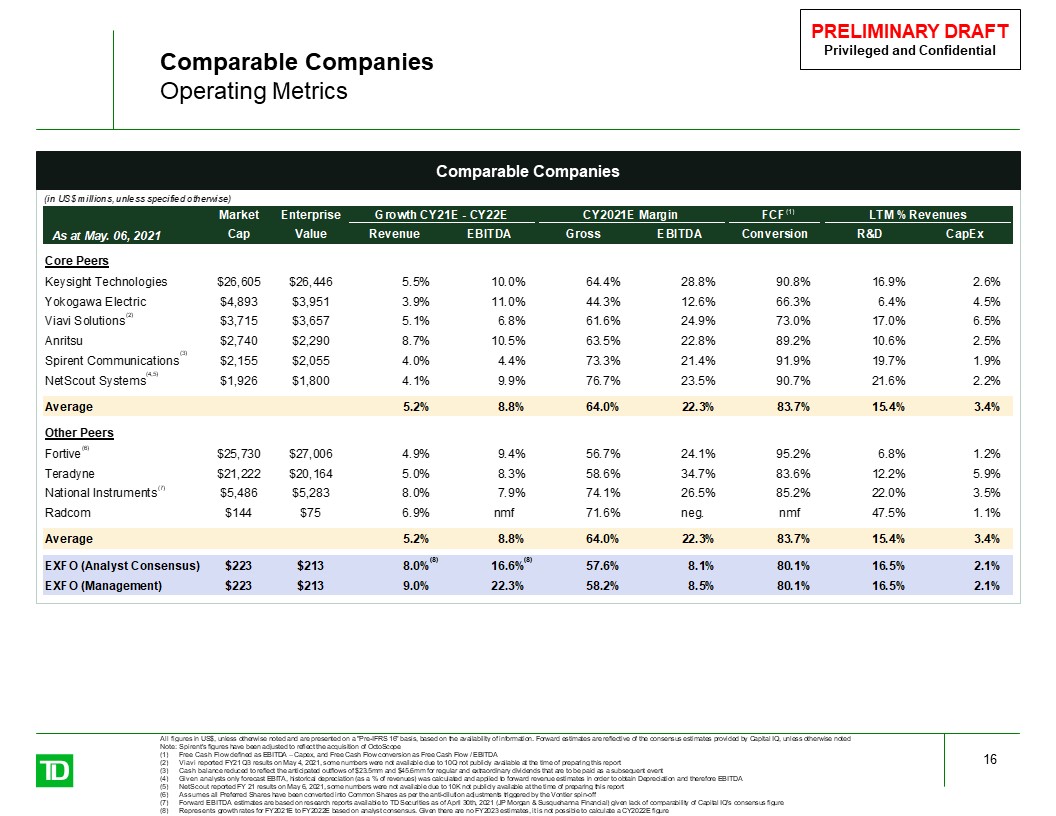
Comparable Companies Comparable CompaniesOperating Metrics 16 All figures in US$, unless otherwise noted and are presented on a "Pre-IFRS 16" basis, based on the availability of information. Forward estimates are reflective of the consensus estimates provided by Capital IQ, unless otherwise notedNote: Spirent's figures have been adjusted to reflect the acquisition of OctoScopeFree Cash Flow defined as EBITDA – Capex, and Free Cash Flow conversion as Free Cash Flow / EBITDAViavi reported FY21 Q3 results on May 4, 2021, some numbers were not available due to 10Q not publicly available at the time of preparing this reportCash balance reduced to reflect the anticipated outflows of $23.5mm and $45.6mm for regular and extraordinary dividends that are to be paid as a subsequent eventGiven analysts only forecast EBITA, historical depreciation (as a % of revenues) was calculated and applied to forward revenue estimates in order to obtain Depreciation and therefore EBITDANetScout reported FY 21 results on May 6, 2021, some numbers were not available due to 10K not publicly available at the time of preparing this reportAssumes all Preferred Shares have been converted into Common Shares as per the anti-dilution adjustments triggered by the Vontier spin-offForward EBITDA estimates are based on research reports available to TD Securities as of April 30th, 2021 (JP Morgan & Susquehanna Financial) given lack of comparability of Capital IQ's consensus figureRepresents growth rates for FY2021E to FY2022E based on analyst consensus. Given there are no FY2023 estimates, it is not possible to calculate a CY2022E figure (6) (3) (4,5) (7) (1) (8) (8) (2)
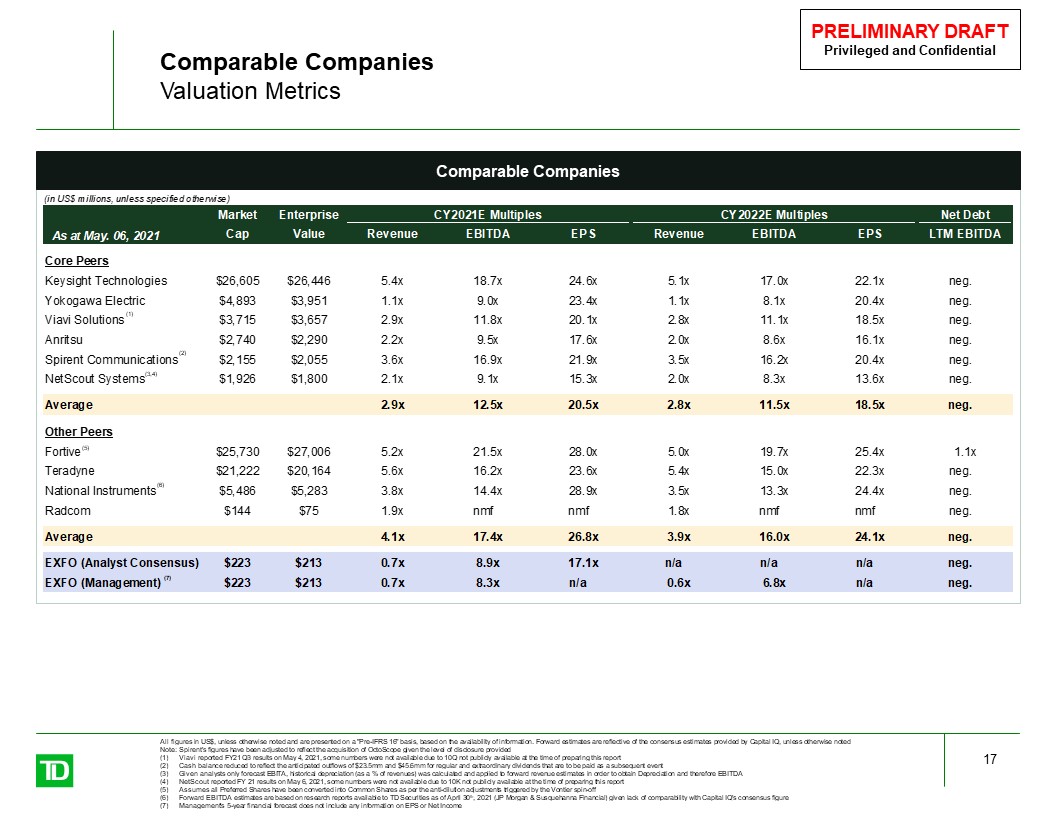
Comparable CompaniesValuation Metrics 17 (7) All figures in US$, unless otherwise noted and are presented on a "Pre-IFRS 16" basis, based on the availability of information. Forward estimates are reflective of the consensus estimates provided by Capital IQ, unless otherwise notedNote: Spirent's figures have been adjusted to reflect the acquisition of OctoScope given the level of disclosure providedViavi reported FY21 Q3 results on May 4, 2021, some numbers were not available due to 10Q not publicly available at the time of preparing this reportCash balance reduced to reflect the anticipated outflows of $23.5mm and $45.6mm for regular and extraordinary dividends that are to be paid as a subsequent eventGiven analysts only forecast EBITA, historical depreciation (as a % of revenues) was calculated and applied to forward revenue estimates in order to obtain Depreciation and therefore EBITDANetScout reported FY 21 results on May 6, 2021, some numbers were not available due to 10K not publicly available at the time of preparing this reportAssumes all Preferred Shares have been converted into Common Shares as per the anti-dilution adjustments triggered by the Vontier spin-offForward EBITDA estimates are based on research reports available to TD Securities as of April 30th, 2021 (JP Morgan & Susquehanna Financial) given lack of comparability with Capital IQ's consensus figureManagement's 5-year financial forecast does not include any information on EPS or Net Income (2) (5) (6) Comparable Companies (3,4) (1)
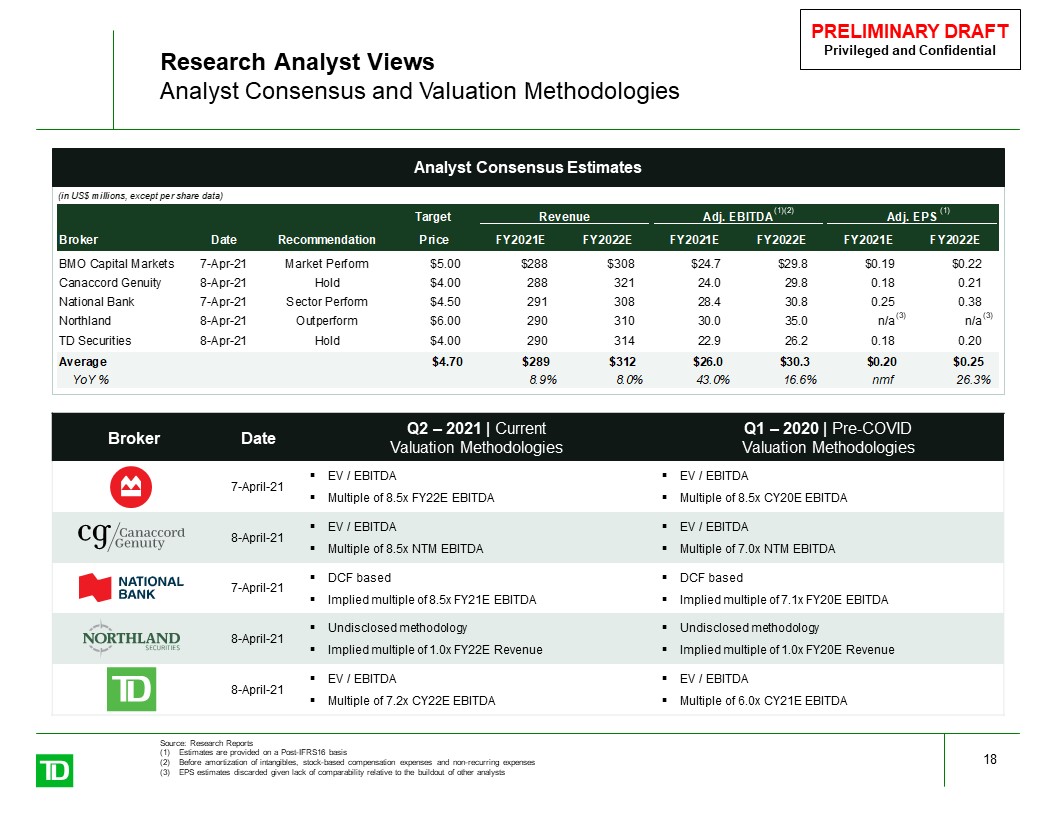
Research Analyst ViewsAnalyst Consensus and Valuation Methodologies Source: Research ReportsEstimates are provided on a Post-IFRS16 basisBefore amortization of intangibles, stock-based compensation expenses and non-recurring expensesEPS estimates discarded given lack of comparability relative to the buildout of other analysts 18 Broker Date Q2 ‒ 2021 | CurrentValuation Methodologies Q1 ‒ 2020 | Pre-COVIDValuation Methodologies 7-April-21 EV / EBITDAMultiple of 8.5x FY22E EBITDA EV / EBITDAMultiple of 8.5x CY20E EBITDA 8-April-21 EV / EBITDAMultiple of 8.5x NTM EBITDA EV / EBITDAMultiple of 7.0x NTM EBITDA 7-April-21 DCF basedImplied multiple of 8.5x FY21E EBITDA DCF basedImplied multiple of 7.1x FY20E EBITDA 8-April-21 Undisclosed methodologyImplied multiple of 1.0x FY22E Revenue Undisclosed methodologyImplied multiple of 1.0x FY20E Revenue 8-April-21 EV / EBITDAMultiple of 7.2x CY22E EBITDA EV / EBITDAMultiple of 6.0x CY21E EBITDA Analyst Consensus Estimates (3) (3) (1) (1)(2)
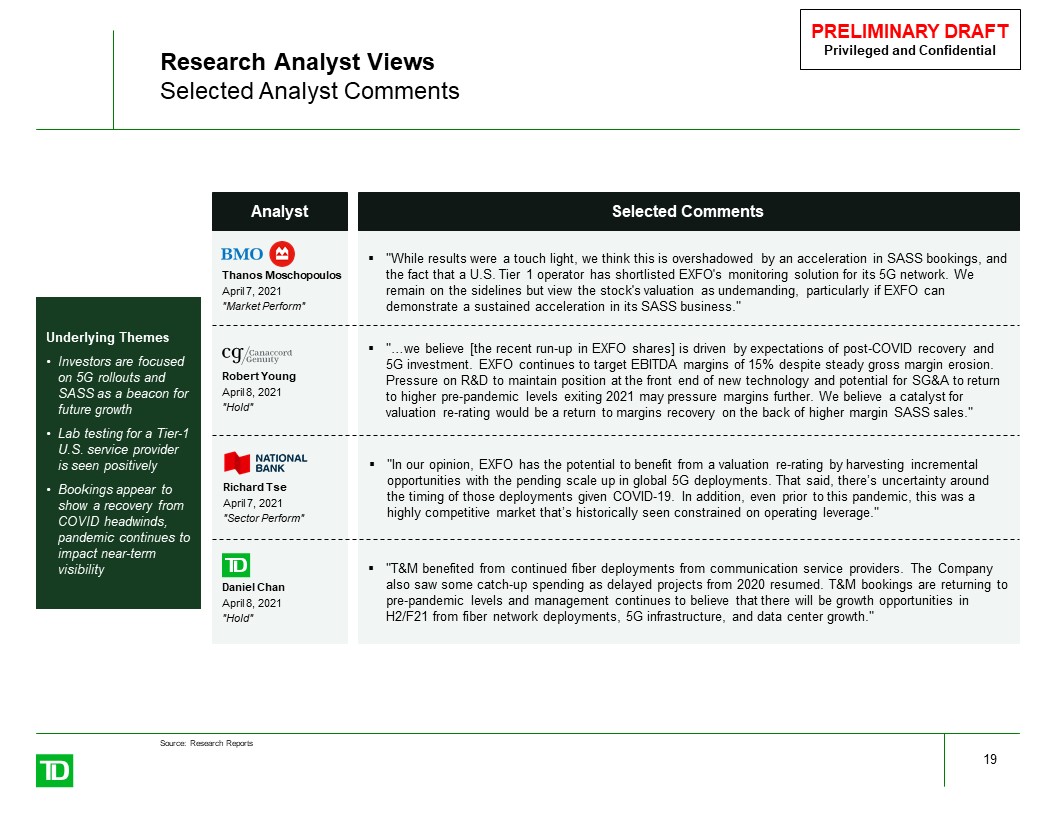
Research Analyst ViewsSelected Analyst Comments 19 Analyst Selected Comments Underlying ThemesInvestors are focused on 5G rollouts and SASS as a beacon for future growthLab testing for a Tier-1 U.S. service provider is seen positivelyBookings appear to show a recovery from COVID headwinds, pandemic continues to impact near-term visibility "T&M benefited from continued fiber deployments from communication service providers. The Company also saw some catch-up spending as delayed projects from 2020 resumed. T&M bookings are returning to pre-pandemic levels and management continues to believe that there will be growth opportunities in H2/F21 from fiber network deployments, 5G infrastructure, and data center growth." Daniel ChanApril 8, 2021"Hold" Source: Research Reports Robert YoungApril 8, 2021"Hold" "…we believe [the recent run-up in EXFO shares] is driven by expectations of post-COVID recovery and 5G investment. EXFO continues to target EBITDA margins of 15% despite steady gross margin erosion. Pressure on R&D to maintain position at the front end of new technology and potential for SG&A to return to higher pre-pandemic levels exiting 2021 may pressure margins further. We believe a catalyst for valuation re-rating would be a return to margins recovery on the back of higher margin SASS sales." "While results were a touch light, we think this is overshadowed by an acceleration in SASS bookings, and the fact that a U.S. Tier 1 operator has shortlisted EXFO's monitoring solution for its 5G network. We remain on the sidelines but view the stock's valuation as undemanding, particularly if EXFO can demonstrate a sustained acceleration in its SASS business." Thanos MoschopoulosApril 7, 2021"Market Perform" "In our opinion, EXFO has the potential to benefit from a valuation re-rating by harvesting incremental opportunities with the pending scale up in global 5G deployments. That said, there’s uncertainty around the timing of those deployments given COVID-19. In addition, even prior to this pandemic, this was a highly competitive market that’s historically seen constrained on operating leverage." Richard TseApril 7, 2021"Sector Perform"
Management Forecast
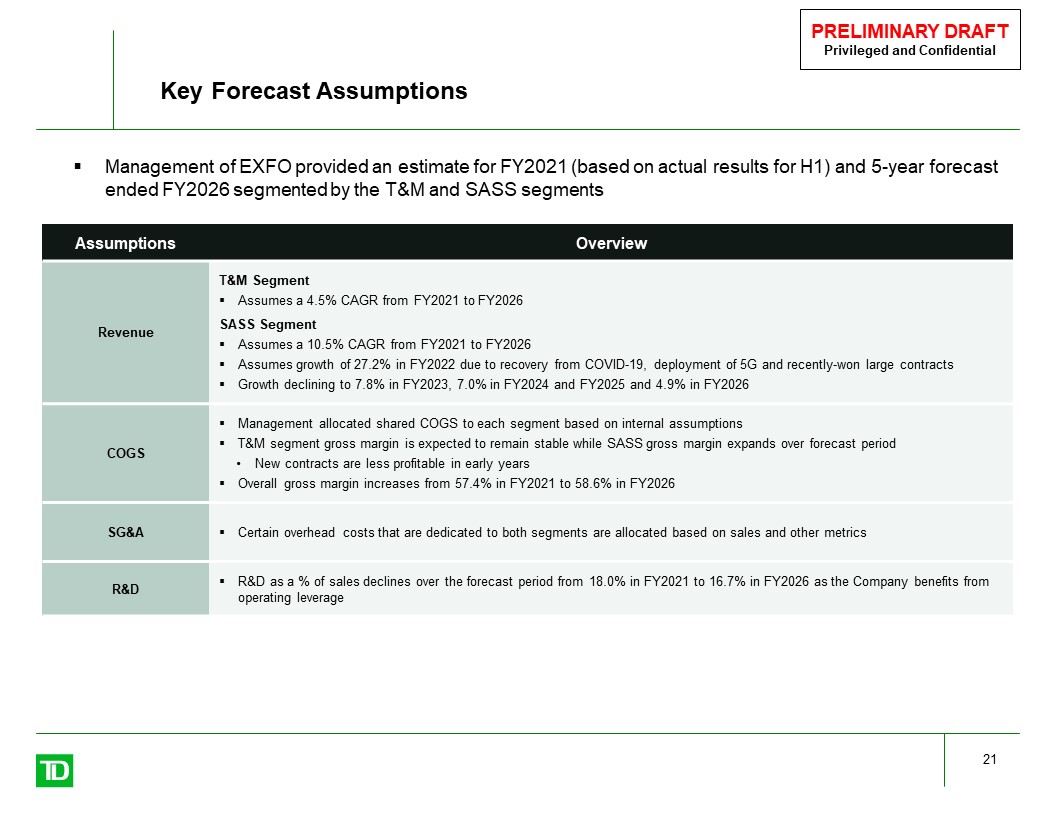
Key Forecast Assumptions 21 Assumptions Overview Revenue T&M SegmentAssumes a 4.5% CAGR from FY2021 to FY2026SASS SegmentAssumes a 10.5% CAGR from FY2021 to FY2026Assumes growth of 27.2% in FY2022 due to recovery from COVID-19, deployment of 5G and recently-won large contractsGrowth declining to 7.8% in FY2023, 7.0% in FY2024 and FY2025 and 4.9% in FY2026 COGS Management allocated shared COGS to each segment based on internal assumptionsT&M segment gross margin is expected to remain stable while SASS gross margin expands over forecast periodNew contracts are less profitable in early yearsOverall gross margin increases from 57.4% in FY2021 to 58.6% in FY2026 SG&A Certain overhead costs that are dedicated to both segments are allocated based on sales and other metrics R&D R&D as a % of sales declines over the forecast period from 18.0% in FY2021 to 16.7% in FY2026 as the Company benefits from operating leverage Management of EXFO provided an estimate for FY2021 (based on actual results for H1) and 5-year forecast ended FY2026 segmented by the T&M and SASS segments
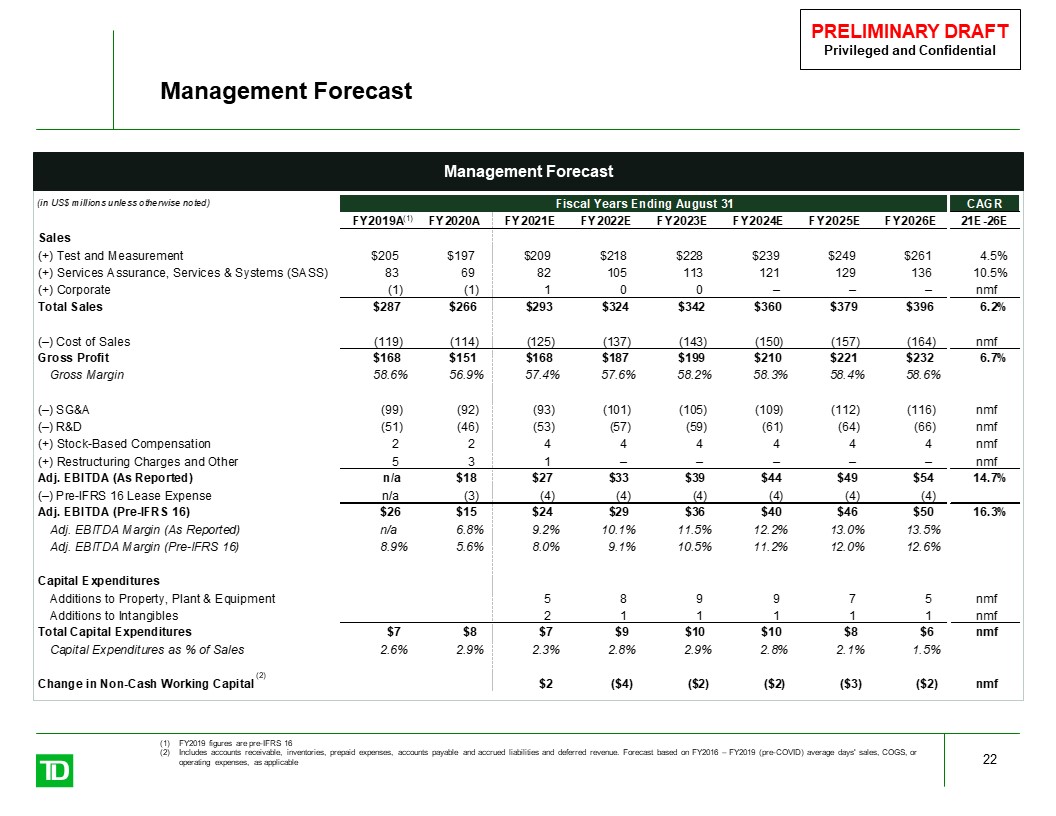
Management Forecast 22 Management Forecast FY2019 figures are pre-IFRS 16Includes accounts receivable, inventories, prepaid expenses, accounts payable and accrued liabilities and deferred revenue. Forecast based on FY2016 – FY2019 (pre-COVID) average days' sales, COGS, or operating expenses, as applicable (1) (2)
Preliminary Indications of Value
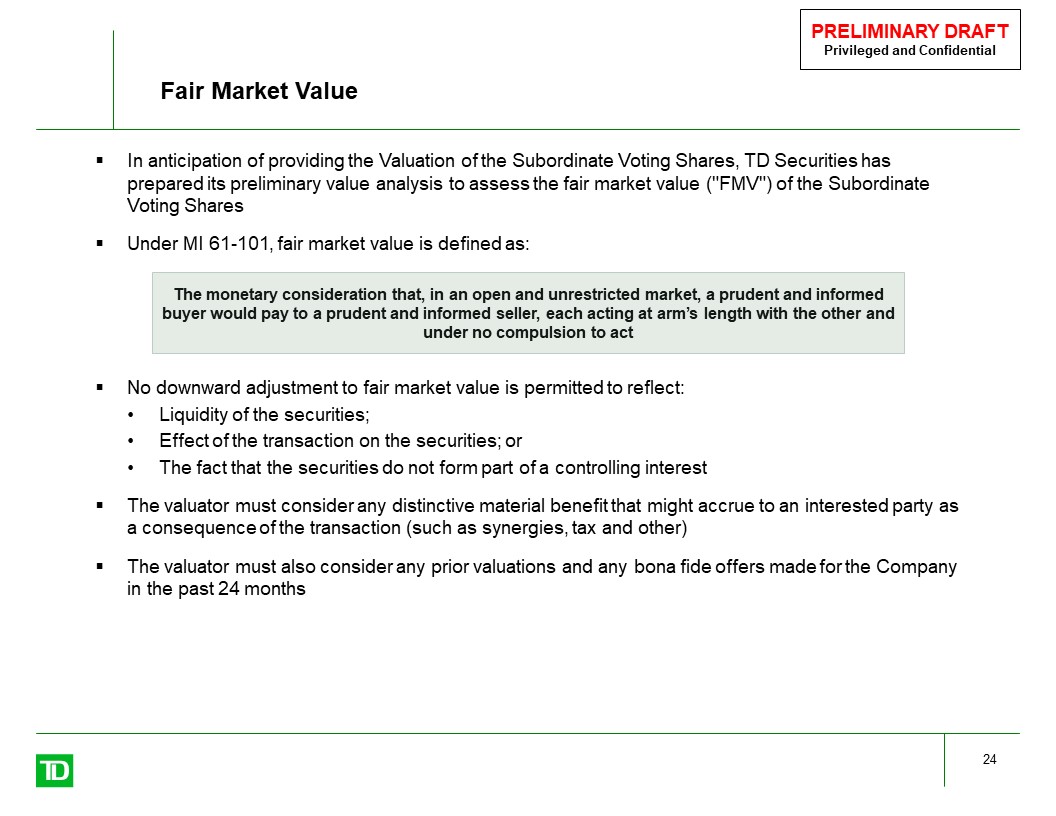
Fair Market Value 24 In anticipation of providing the Valuation of the Subordinate Voting Shares, TD Securities has prepared its preliminary value analysis to assess the fair market value ("FMV") of the Subordinate Voting SharesUnder MI 61-101, fair market value is defined as:No downward adjustment to fair market value is permitted to reflect:Liquidity of the securities;Effect of the transaction on the securities; orThe fact that the securities do not form part of a controlling interestThe valuator must consider any distinctive material benefit that might accrue to an interested party as a consequence of the transaction (such as synergies, tax and other)The valuator must also consider any prior valuations and any bona fide offers made for the Company in the past 24 months The monetary consideration that, in an open and unrestricted market, a prudent and informed buyer would pay to a prudent and informed seller, each acting at arm’s length with the other and under no compulsion to act
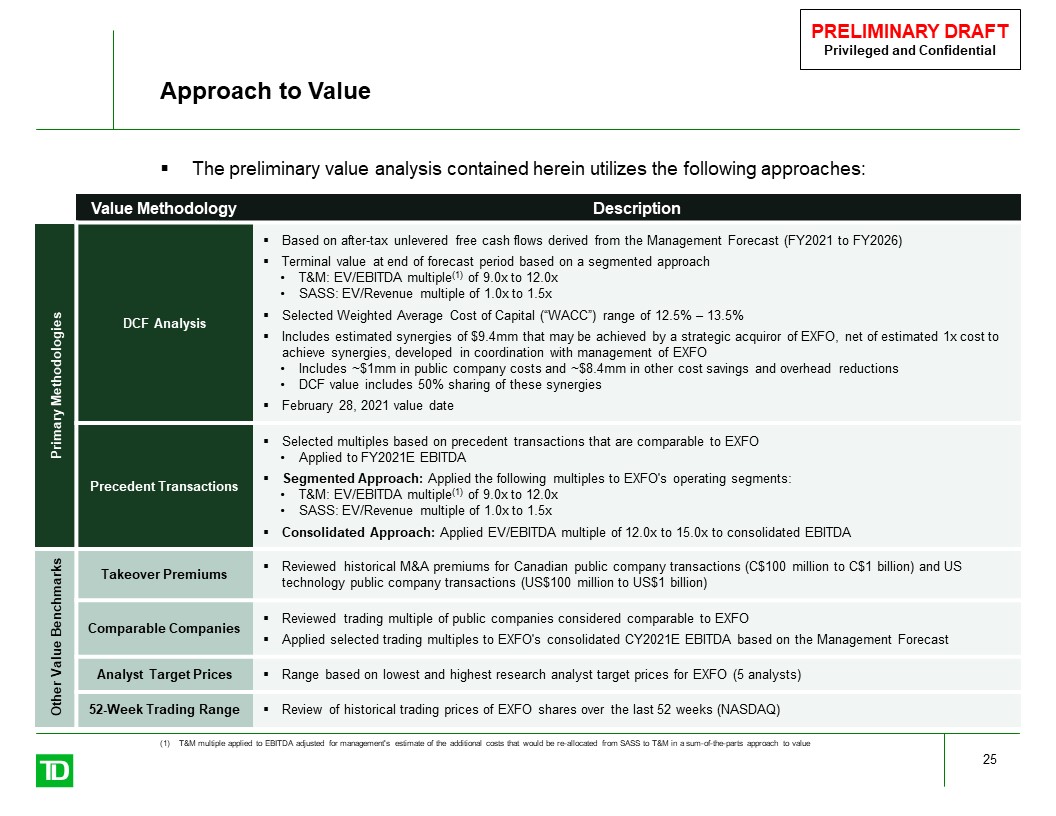
Approach to Value 25 The preliminary value analysis contained herein utilizes the following approaches: Value Methodology Description Primary Methodologies DCF Analysis Based on after-tax unlevered free cash flows derived from the Management Forecast (FY2021 to FY2026)Terminal value at end of forecast period based on a segmented approachT&M: EV/EBITDA multiple(1) of 9.0x to 12.0xSASS: EV/Revenue multiple of 1.0x to 1.5xSelected Weighted Average Cost of Capital (“WACC”) range of 12.5% – 13.5%Includes estimated synergies of $9.4mm that may be achieved by a strategic acquiror of EXFO, net of estimated 1x cost to achieve synergies, developed in coordination with management of EXFOIncludes ~$1mm in public company costs and ~$8.4mm in other cost savings and overhead reductionsDCF value includes 50% sharing of these synergiesFebruary 28, 2021 value date Precedent Transactions Selected multiples based on precedent transactions that are comparable to EXFOApplied to FY2021E EBITDASegmented Approach: Applied the following multiples to EXFO's operating segments:T&M: EV/EBITDA multiple(1) of 9.0x to 12.0xSASS: EV/Revenue multiple of 1.0x to 1.5xConsolidated Approach: Applied EV/EBITDA multiple of 12.0x to 15.0x to consolidated EBITDA Other Value Benchmarks Takeover Premiums Reviewed historical M&A premiums for Canadian public company transactions (C$100 million to C$1 billion) and US technology public company transactions (US$100 million to US$1 billion) Comparable Companies Reviewed trading multiple of public companies considered comparable to EXFOApplied selected trading multiples to EXFO's consolidated CY2021E EBITDA based on the Management Forecast Analyst Target Prices Range based on lowest and highest research analyst target prices for EXFO (5 analysts) 52-Week Trading Range Review of historical trading prices of EXFO shares over the last 52 weeks (NASDAQ) T&M multiple applied to EBITDA adjusted for management's estimate of the additional costs that would be re-allocated from SASS to T&M in a sum-of-the-parts approach to value
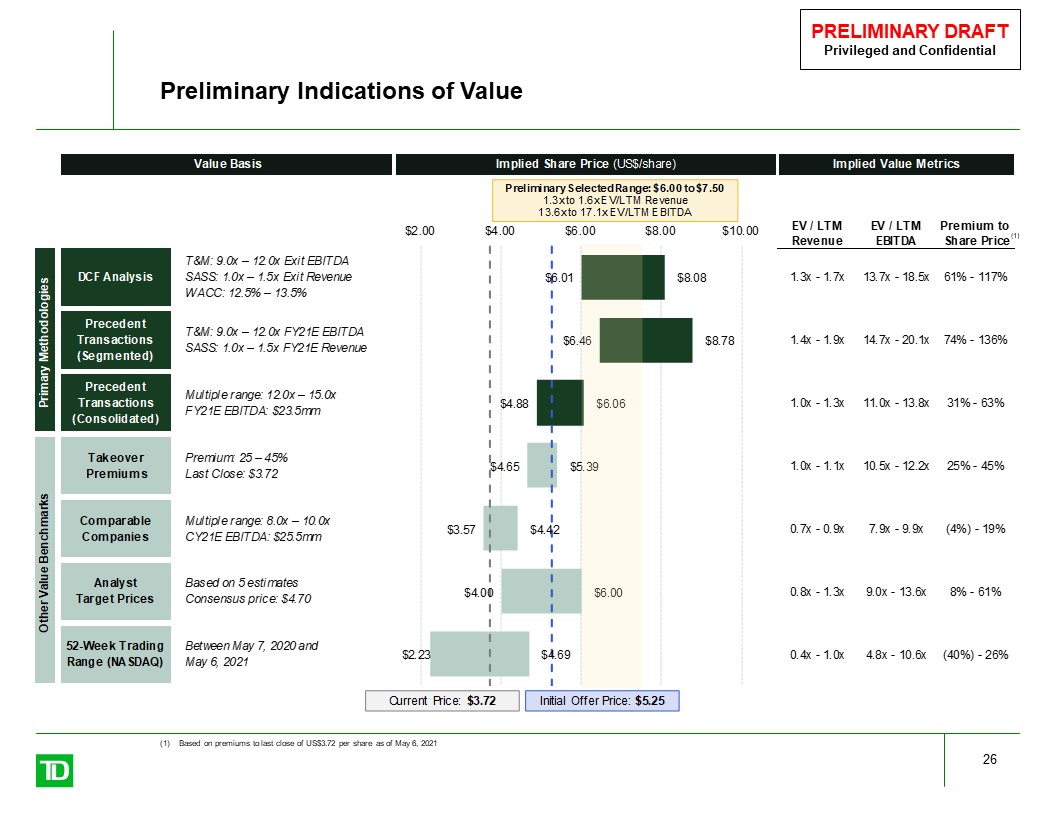
Preliminary Indications of Value 26 Based on premiums to last close of US$3.72 per share as of May 6, 2021 (1)
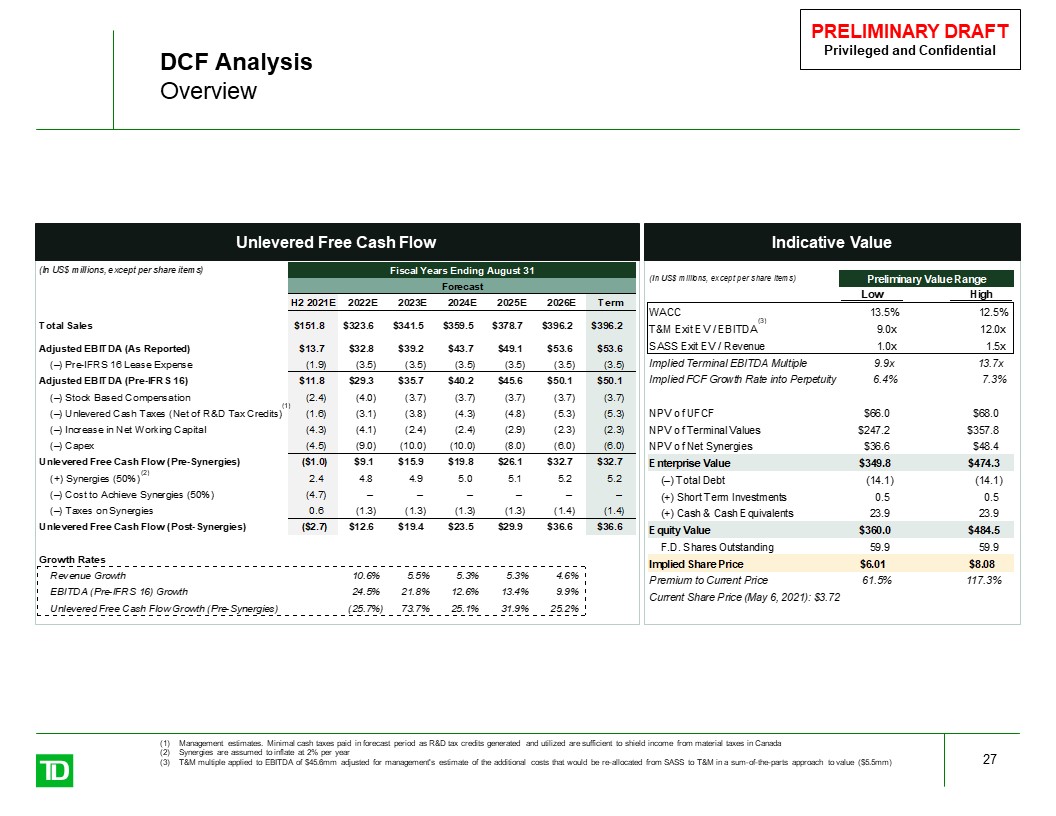
DCF AnalysisOverview 27 Unlevered Free Cash Flow Indicative Value (2) (1) Management estimates. Minimal cash taxes paid in forecast period as R&D tax credits generated and utilized are sufficient to shield income from material taxes in CanadaSynergies are assumed to inflate at 2% per yearT&M multiple applied to EBITDA of $45.6mm adjusted for management's estimate of the additional costs that would be re-allocated from SASS to T&M in a sum-of-the-parts approach to value ($5.5mm) (3)
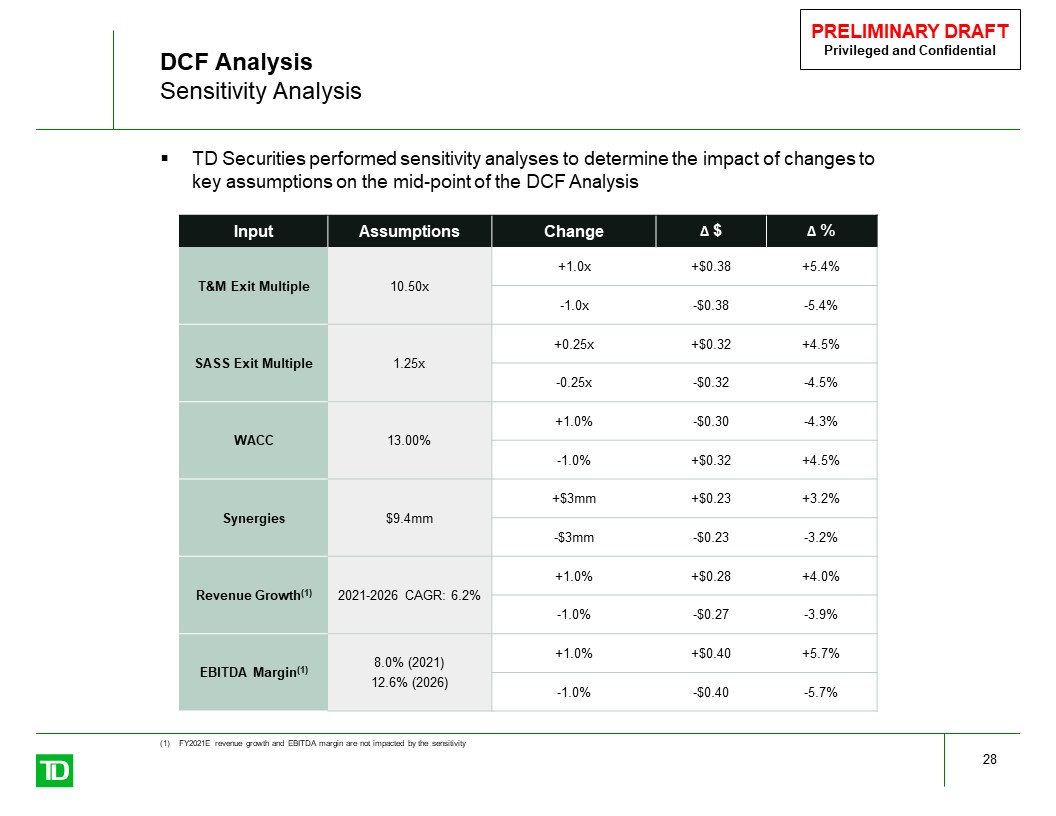
DCF AnalysisSensitivity Analysis 28 TD Securities performed sensitivity analyses to determine the impact of changes to key assumptions on the mid-point of the DCF Analysis Input Assumptions Change Δ $ Δ % T&M Exit Multiple 10.50x +1.0x +$0.38 +5.4% -1.0x -$0.38 -5.4% SASS Exit Multiple 1.25x +0.25x +$0.32 +4.5% -0.25x -$0.32 -4.5% WACC 13.00% +1.0% -$0.30 -4.3% -1.0% +$0.32 +4.5% Synergies $9.4mm +$3mm +$0.23 +3.2% -$3mm -$0.23 -3.2% Revenue Growth(1) 2021-2026 CAGR: 6.2% +1.0% +$0.28 +4.0% -1.0% -$0.27 -3.9% EBITDA Margin(1) 8.0% (2021)12.6% (2026) +1.0% +$0.40 +5.7% -1.0% -$0.40 -5.7% FY2021E revenue growth and EBITDA margin are not impacted by the sensitivity
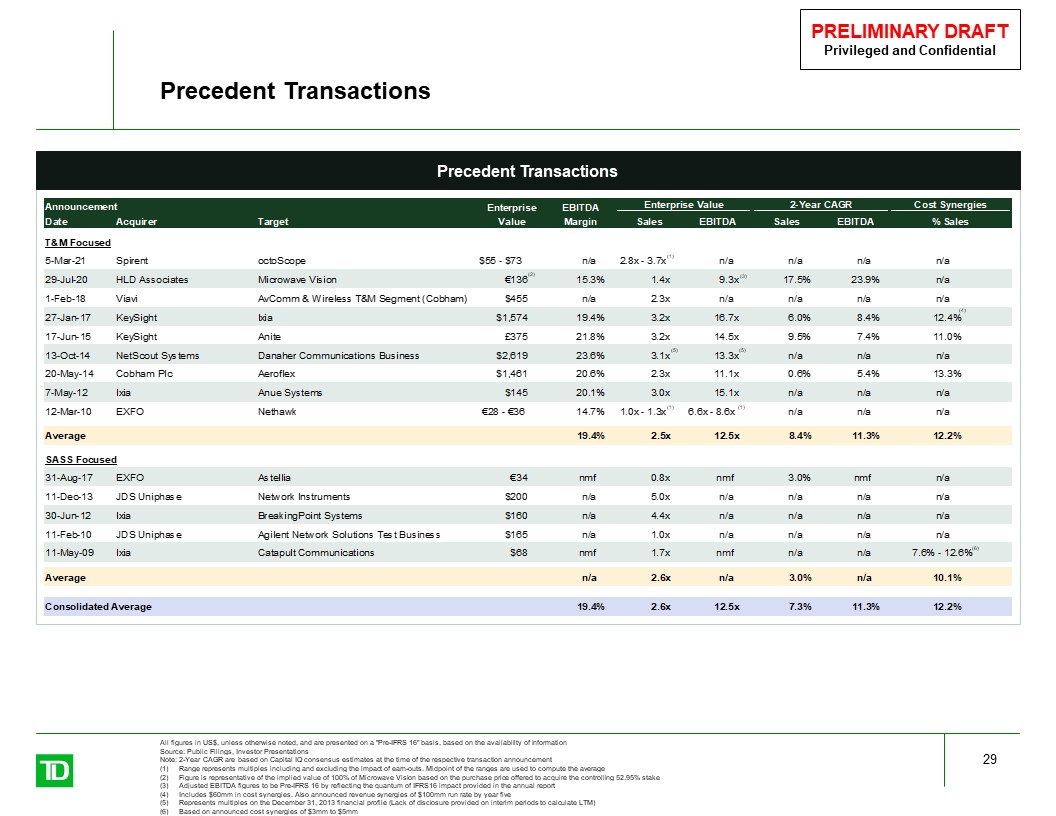
Precedent Transactions Precedent Transactions 29 All figures in US$, unless otherwise noted, and are presented on a "Pre-IFRS 16" basis, based on the availability of informationSource: Public Filings, Investor PresentationsNote: 2-Year CAGR are based on Capital IQ consensus estimates at the time of the respective transaction announcementRange represents multiples including and excluding the impact of earn-outs. Midpoint of the ranges are used to compute the averageFigure is representative of the implied value of 100% of Microwave Vision based on the purchase price offered to acquire the controlling 52.95% stakeAdjusted EBITDA figures to be Pre-IFRS 16 by reflecting the quantum of IFRS16 impact provided in the annual reportIncludes $60mm in cost synergies. Also announced revenue synergies of $100mm run rate by year fiveRepresents multiples on the December 31, 2013 financial profile (Lack of disclosure provided on interim periods to calculate LTM)Based on announced cost synergies of $3mm to $5mm (4) (5) (5) (6) (3) (1) (1) (1) (2)

Precedent Transactions AnalysisSegmented Basis 30 Selected range implies enterprise value for EXFO of $377mm to $516mmImplies share price range of $6.46 to $8.78 Precedents Transaction Analysis | Segmented Basis (1) Reflects management's estimate of the additional costs that would be re-allocated from SASS to T&M in a sum-of-the-parts approach to valueRepresents portion of Canada Emergency Wage Subsidy which will be received in FY2021 (T&M allocation as a % of sales) (2)
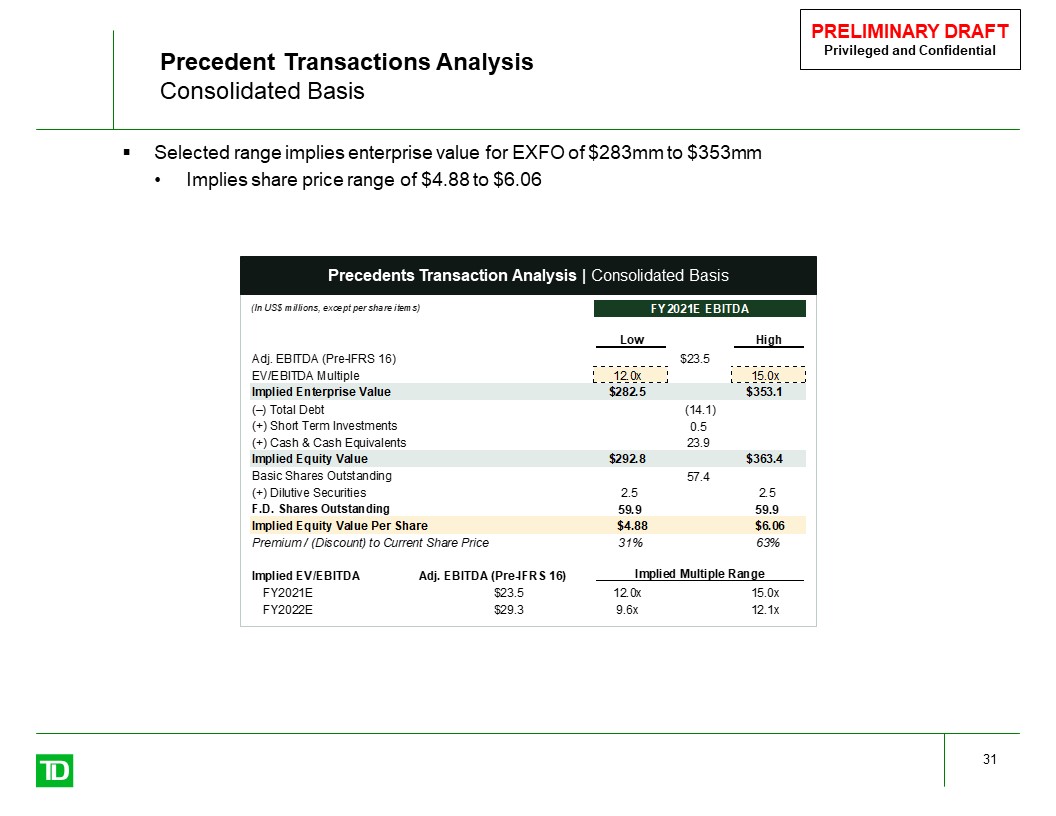
Precedent Transactions AnalysisConsolidated Basis 31 Selected range implies enterprise value for EXFO of $283mm to $353mmImplies share price range of $4.88 to $6.06 Precedents Transaction Analysis | Consolidated Basis
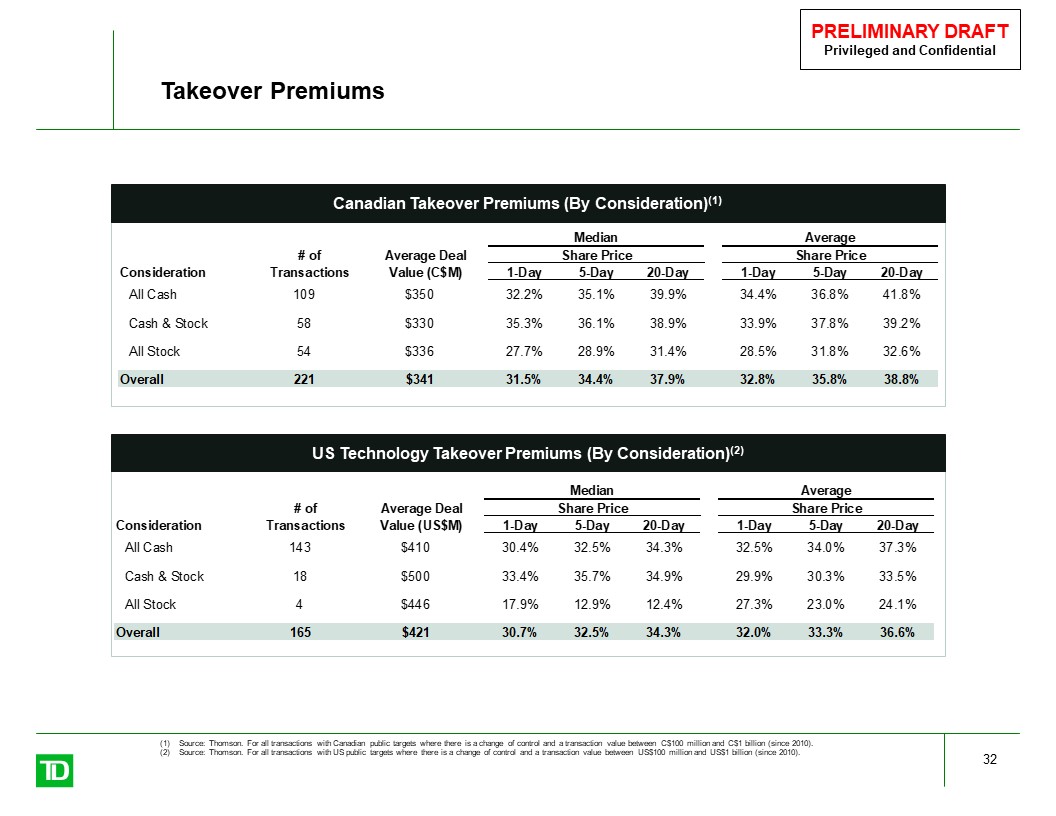
Takeover Premiums 32 Source: Thomson. For all transactions with Canadian public targets where there is a change of control and a transaction value between C$100 million and C$1 billion (since 2010).Source: Thomson. For all transactions with US public targets where there is a change of control and a transaction value between US$100 million and US$1 billion (since 2010). Canadian Takeover Premiums (By Consideration)(1) US Technology Takeover Premiums (By Consideration)(2)
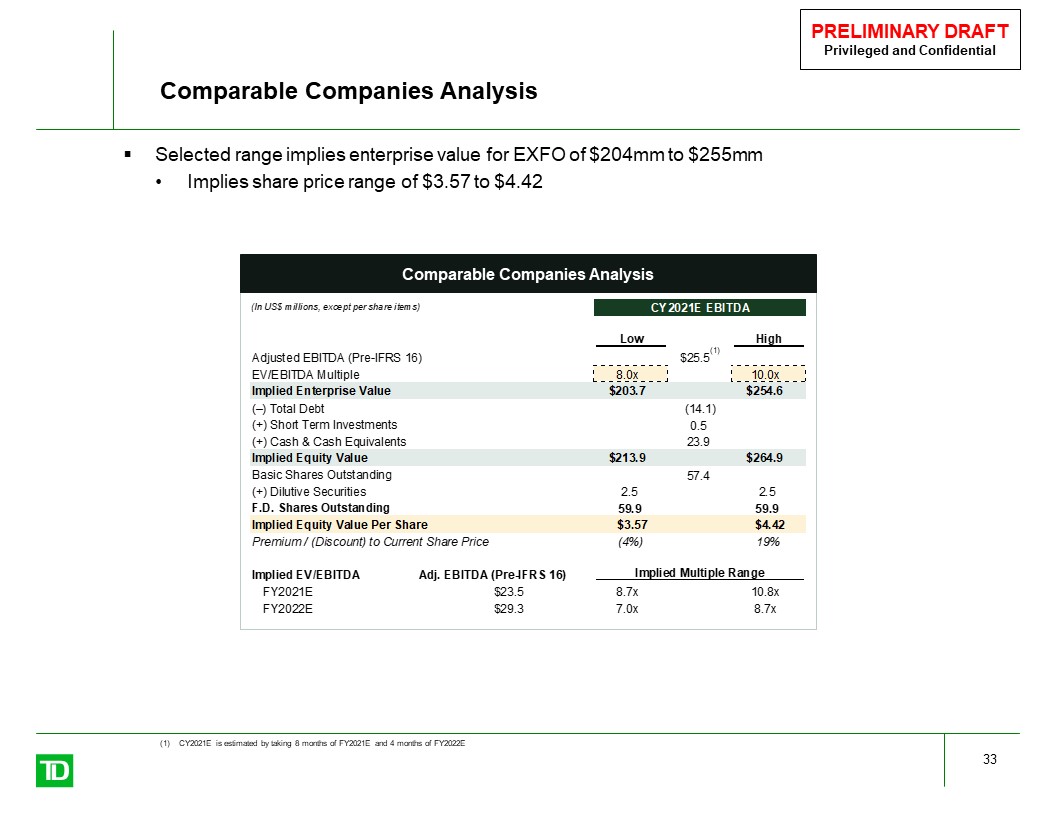
Comparable Companies Analysis 33 Selected range implies enterprise value for EXFO of $204mm to $255mmImplies share price range of $3.57 to $4.42 (1) CY2021E is estimated by taking 8 months of FY2021E and 4 months of FY2022E Comparable Companies Analysis
WACC Analysis Appendix A:
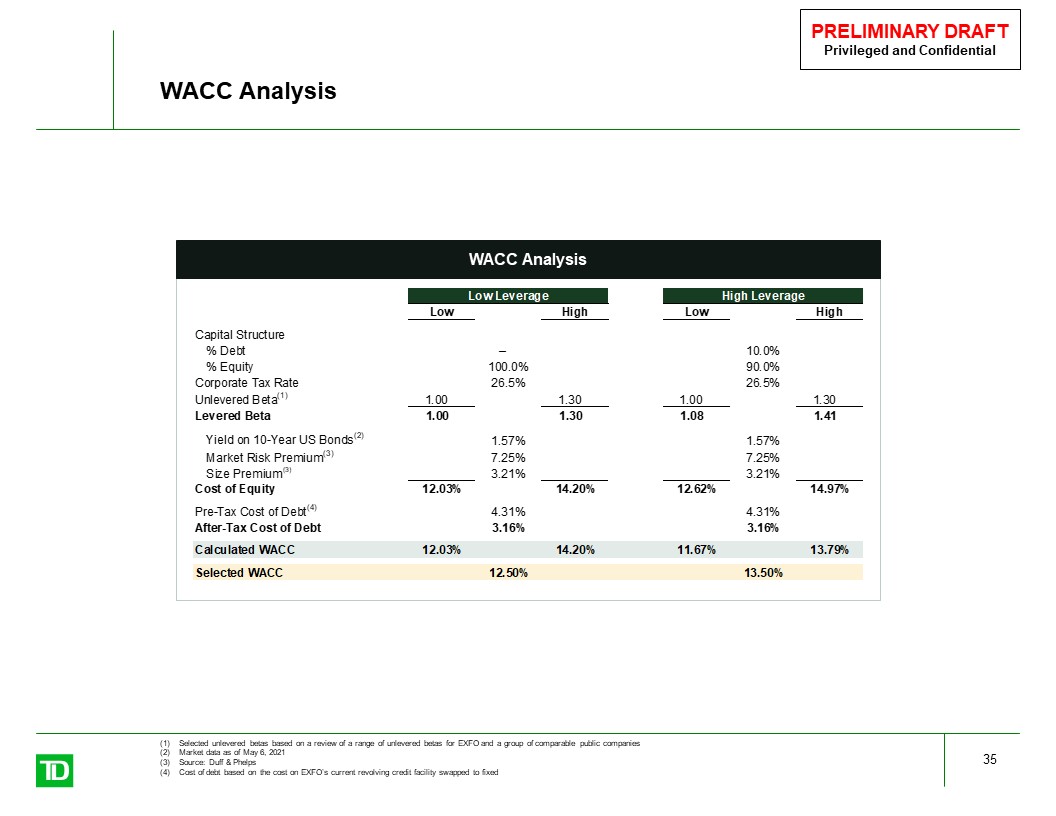
WACC Analysis 35 Selected unlevered betas based on a review of a range of unlevered betas for EXFO and a group of comparable public companiesMarket data as of May 6, 2021Source: Duff & PhelpsCost of debt based on the cost on EXFO’s current revolving credit facility swapped to fixed WACC Analysis